
EC coupling
excitation contraction coupling skeletal muscle T-tubule sarcoplasmic reticulum calcium
![This physiological diagram illustrates simulated calcium dynamics in rat ventricular myocytes, focusing on the mechanisms of excitation-contraction coupling. The image is divided into five panels (A-E) tracking parameters over a 1.0-second timeline. Panel A (Ca2+ sparks) shows high-amplitude calcium spikes in the dyadic subspace ([Ca2+]ds) reaching ~100 µM. Panel B (Ca2+ quarks) displays lower-amplitude, high-frequency [Ca2+]ds fluctuations below 10 µM, representing 'invisible' leak events. Panel C tracks the dynamics of junctional sarcoplasmic reticulum (jSR) calcium release ([Ca2+]jsr), demonstrating local depletion following release events. Panel D quantifies the number of Ryanodine Receptor (RyR) openings, ranging from 0 to 50. Panel E illustrates the concentration of calcium-bound calmodulin complex ([CaCm2+]ds). These charts demonstrate the stochastic nature of calcium release units (CRUs) and the correlation between RyR channel opening and subspace calcium elevation. The data is relevant to cardiac electrophysiology, specifically the study of cardiac alternans and intracellular calcium signaling in cardiomyocytes.](https://cdn.orris.care/cdss_images/pmc_clinical_VQA_79b4efe7519feda5ae5e3f2a613f9970132beae439a1d7f553d9ac4973bb6d97.jpg)
This physiological diagram illustrates simulated calcium dynamics in rat ventricular myocytes, focusing on the mechanisms of excitation-contraction coupling. The image is divided into five panels (A-E) tracking parameters over a 1.0-second timeline. Panel A (Ca2+ sparks) shows high-amplitude calcium spikes in the dyadic subspace ([Ca2+]ds) reaching ~100 µM. Panel B (Ca2+ quarks) displays lower-amplitude, high-frequency [Ca2+]ds fluctuations below 10 µM, representing 'invisible' leak events. Panel C tracks the dynamics of junctional sarcoplasmic reticulum (jSR) calcium release ([Ca2+]jsr), demonstrating local depletion following release events. Panel D quantifies the number of Ryanodine Receptor (RyR) openings, ranging from 0 to 50. Panel E illustrates the concentration of calcium-bound calmodulin complex ([CaCm2+]ds). These charts demonstrate the stochastic nature of calcium release units (CRUs) and the correlation between RyR channel opening and subspace calcium elevation. The data is relevant to cardiac electrophysiology, specifically the study of cardiac alternans and intracellular calcium signaling in cardiomyocytes.
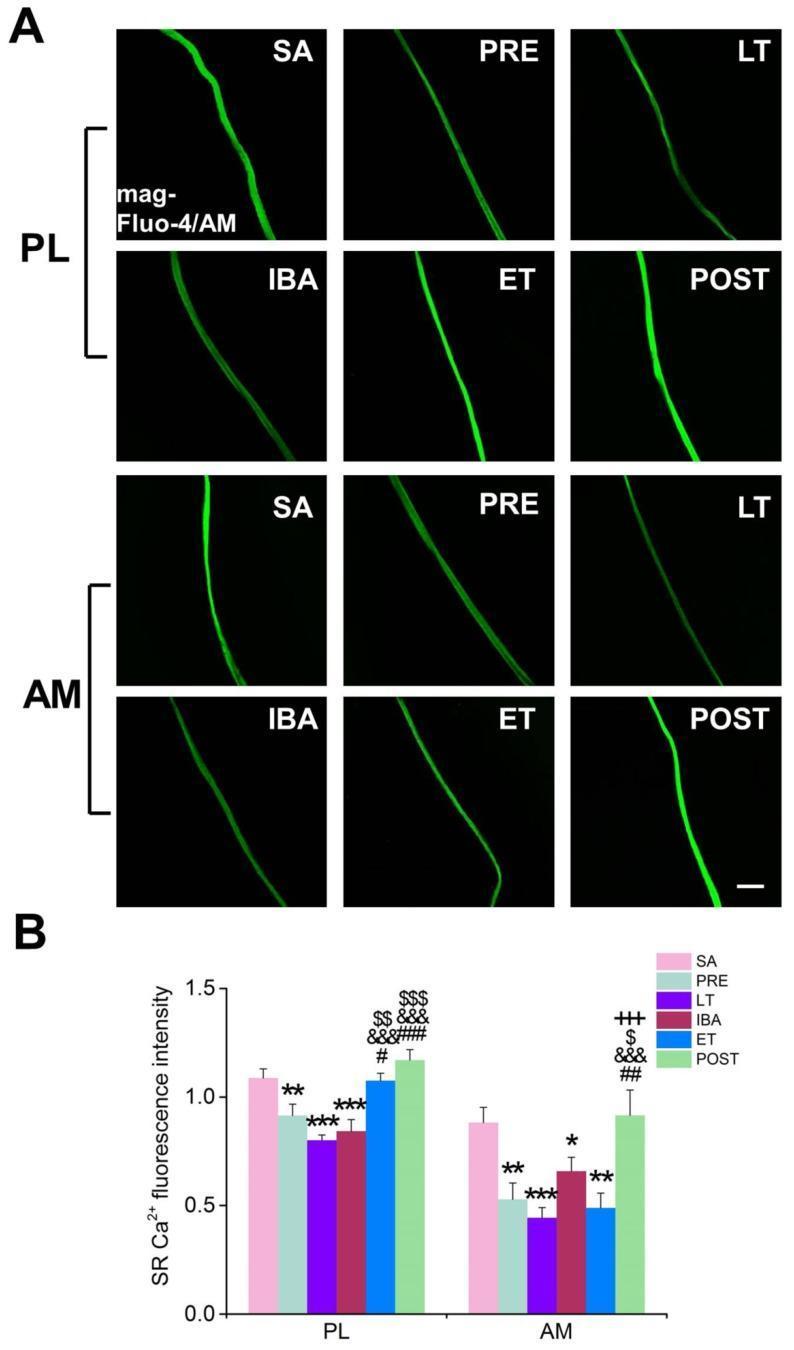
This composite educational graphic illustrates changes in sarcoplasmic reticulum (SR) Calcium (Ca2+) concentrations in skeletal muscle fibers across different physiological states. Panel A displays representative fluorescence microscopy images using mag-Fluo-4/AM staining on single muscle fibers from the plantaris (PL) and adductor magnus (AM). The green fluorescence signal qualitatively represents SR Ca2+ levels across six experimental groups: Summer Active (SA), Pre-hibernation (PRE), Late Torpor (LT), Inter-bout Arousal (IBA), Early Torpor (ET), and Post-hibernation (POST). Panel B provides a quantitative comparison through a bar histogram showing SR Ca2+ fluorescence intensity. The data reveals a significant decrease in SR Ca2+ levels during hibernation phases (LT, IBA, ET) compared to the SA and PRE groups, with substantial recovery observed in the POST group. Statistical significance is indicated by symbols (asterisks, hashtags, etc.) representing various group comparisons. This material is useful for studying muscle physiology, calcium signaling, and the cellular adaptations of skeletal muscle to metabolic shifts and environmental changes.
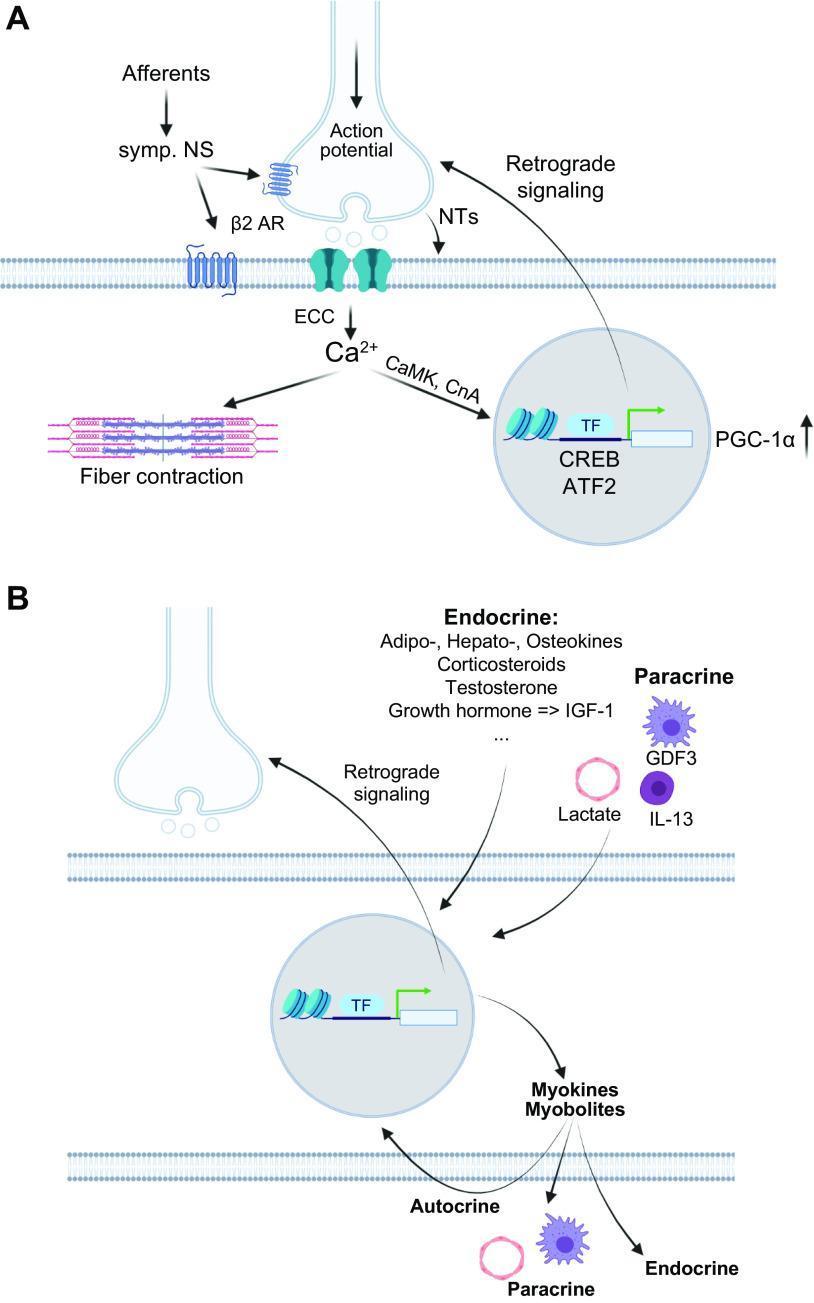
A two-panel (A and B) pathophysiology diagram illustrating motor neuron signaling, excitation-contraction coupling (ECC), and (neuro)endocrine skeletal muscle responses. Panel A depicts the neuromuscular junction where an action potential triggers ECC and the release of intramyocellular calcium (Ca2+), leading to myofiber contraction. It also shows Ca2+ activating signaling pathways (CaMK, CnA) that modulate transcriptional factors (CREB, ATF2) and the coactivator PGC-1̑ in the nucleus, alongside retrograde feedback to the motor neuron via neurotrophic factors (NTs). Adrenergic signaling through ̒2-adrenoreceptors (̒2 AR) from the sympathetic nervous system is also represented. Panel B focuses on 'exerkines,' showing the secretion of myokines and myobolites from the muscle cell. It classifies signaling effects as autocrine, paracrine (e.g., GDF3, IL-13, Lactate), and endocrine. Endocrine factors listed include adipokines, hepatokines, osteokines, corticosteroids, testosterone, and growth hormone-regulated IGF-1, highlighting the systemic coordination between muscle, liver, adipose, and bone tissues during contractile activity.
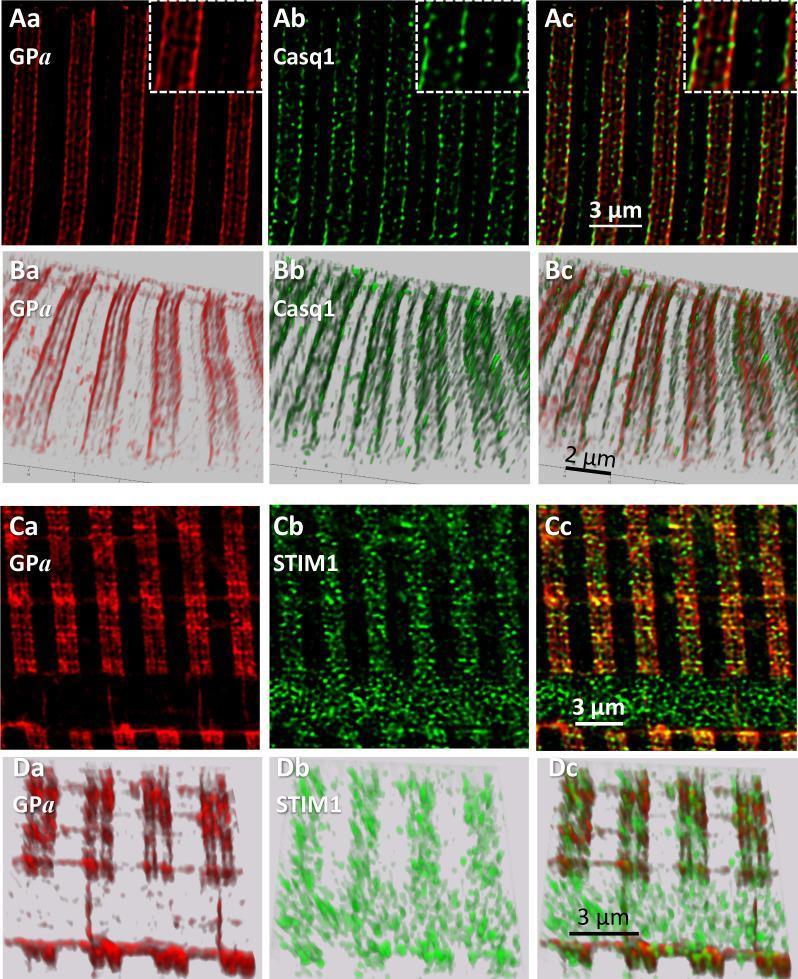
This composite diagnostic image displays high-resolution confocal fluorescence microscopy sections (A, C) and 3D renderings (B, D) of human myofibers, illustrating the spatial localization of key calcium handling and metabolic proteins. Panels Aa-Ac and Ba-Bc show co-staining for phosphorylated glycogen phosphorylase (GPa, red) and Calsequestrin 1 (Casq1, green). Both proteins delineate the terminal cisternae (TC) of the sarcoplasmic reticulum (SR) within skeletal muscle triads, appearing as parallel double bands. While closely apposed, GPa and Casq1 show close proximity without direct colocalization. Panels Ca-Cc and Da-Dc illustrate the relationship between GPa (red) and Stromal Interaction Molecule 1 (STIM1, green). GPa maintains its delineation of the TC, while STIM1 forms distinct clusters adjacent to the GPa bands. The imagery resolves the two TC within a single triad junction at a resolution of approximately 100 nm, highlighting the structural organization of the sarcoplasmic reticulum and the recruitment of glycogenolytic enzymes like GPa to these calcium-rich sub-compartments.
Excitation-Contraction (EC) Coupling
Structural Basis
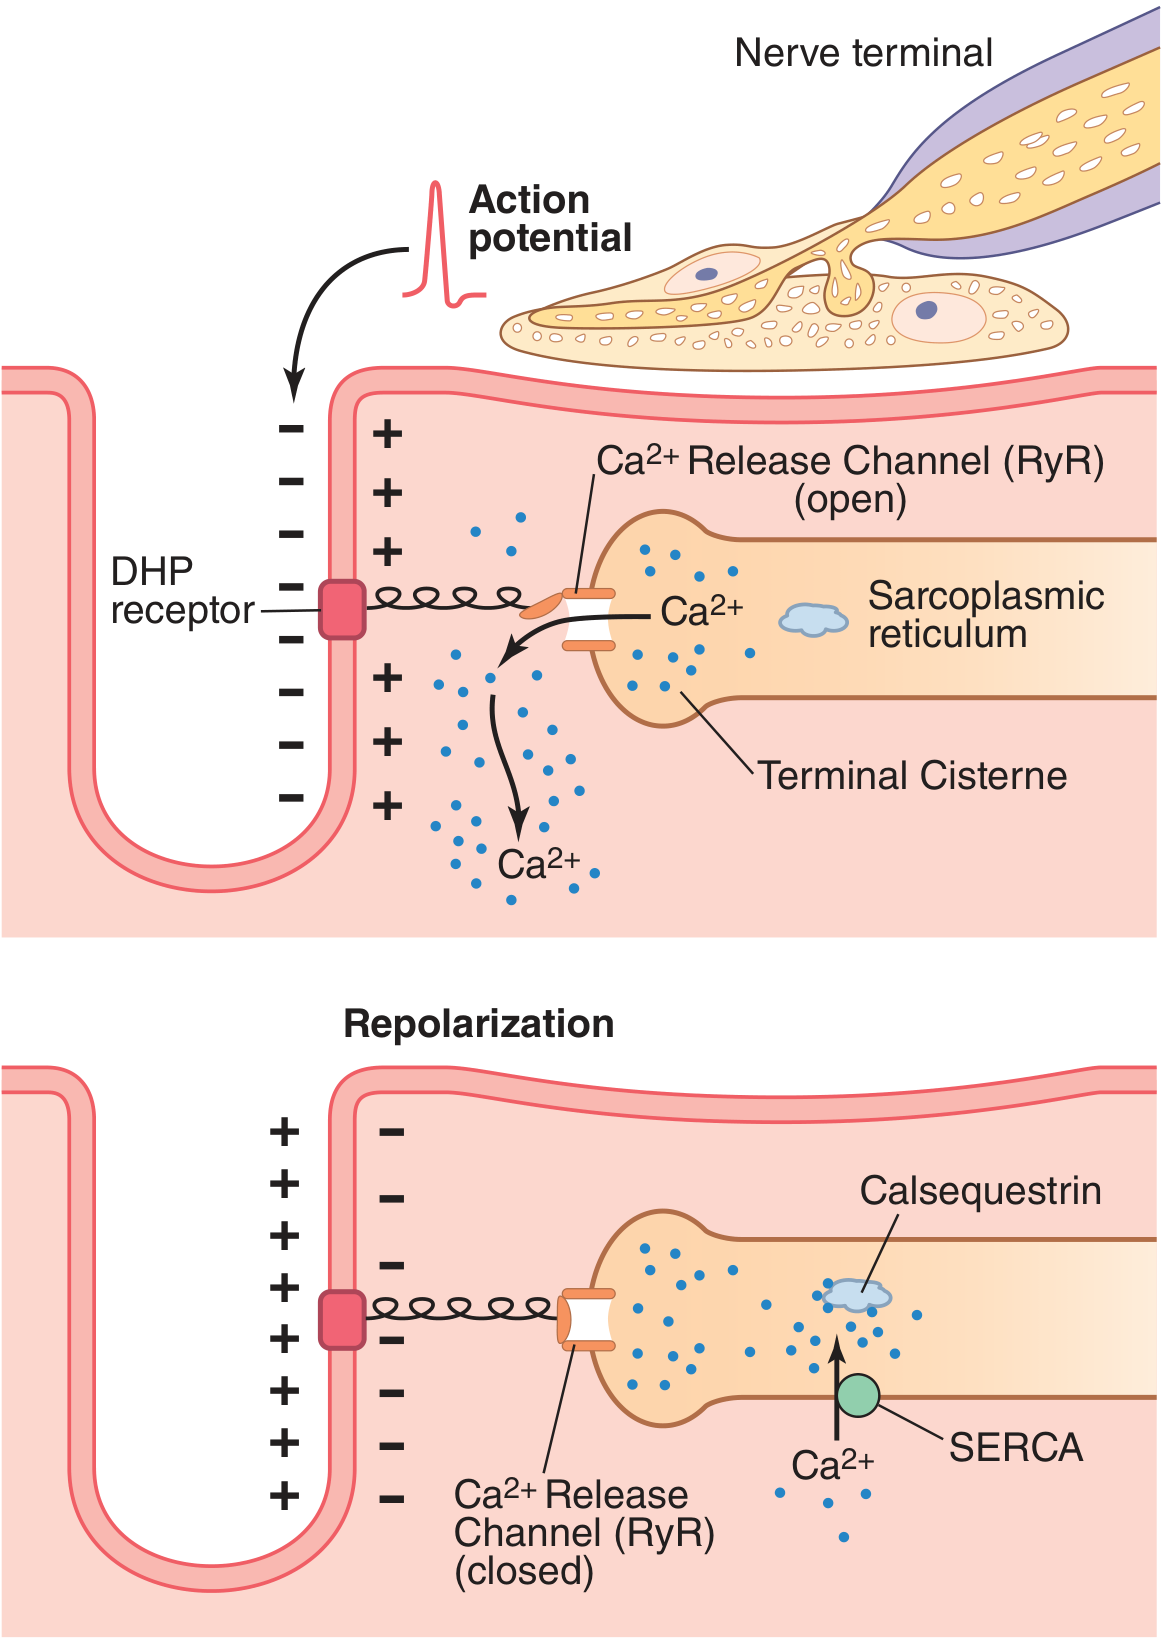
- Terminal cisternae - enlarged SR sacs abutting T-tubules
- Longitudinal tubules - connecting SR tubes along myofibrils
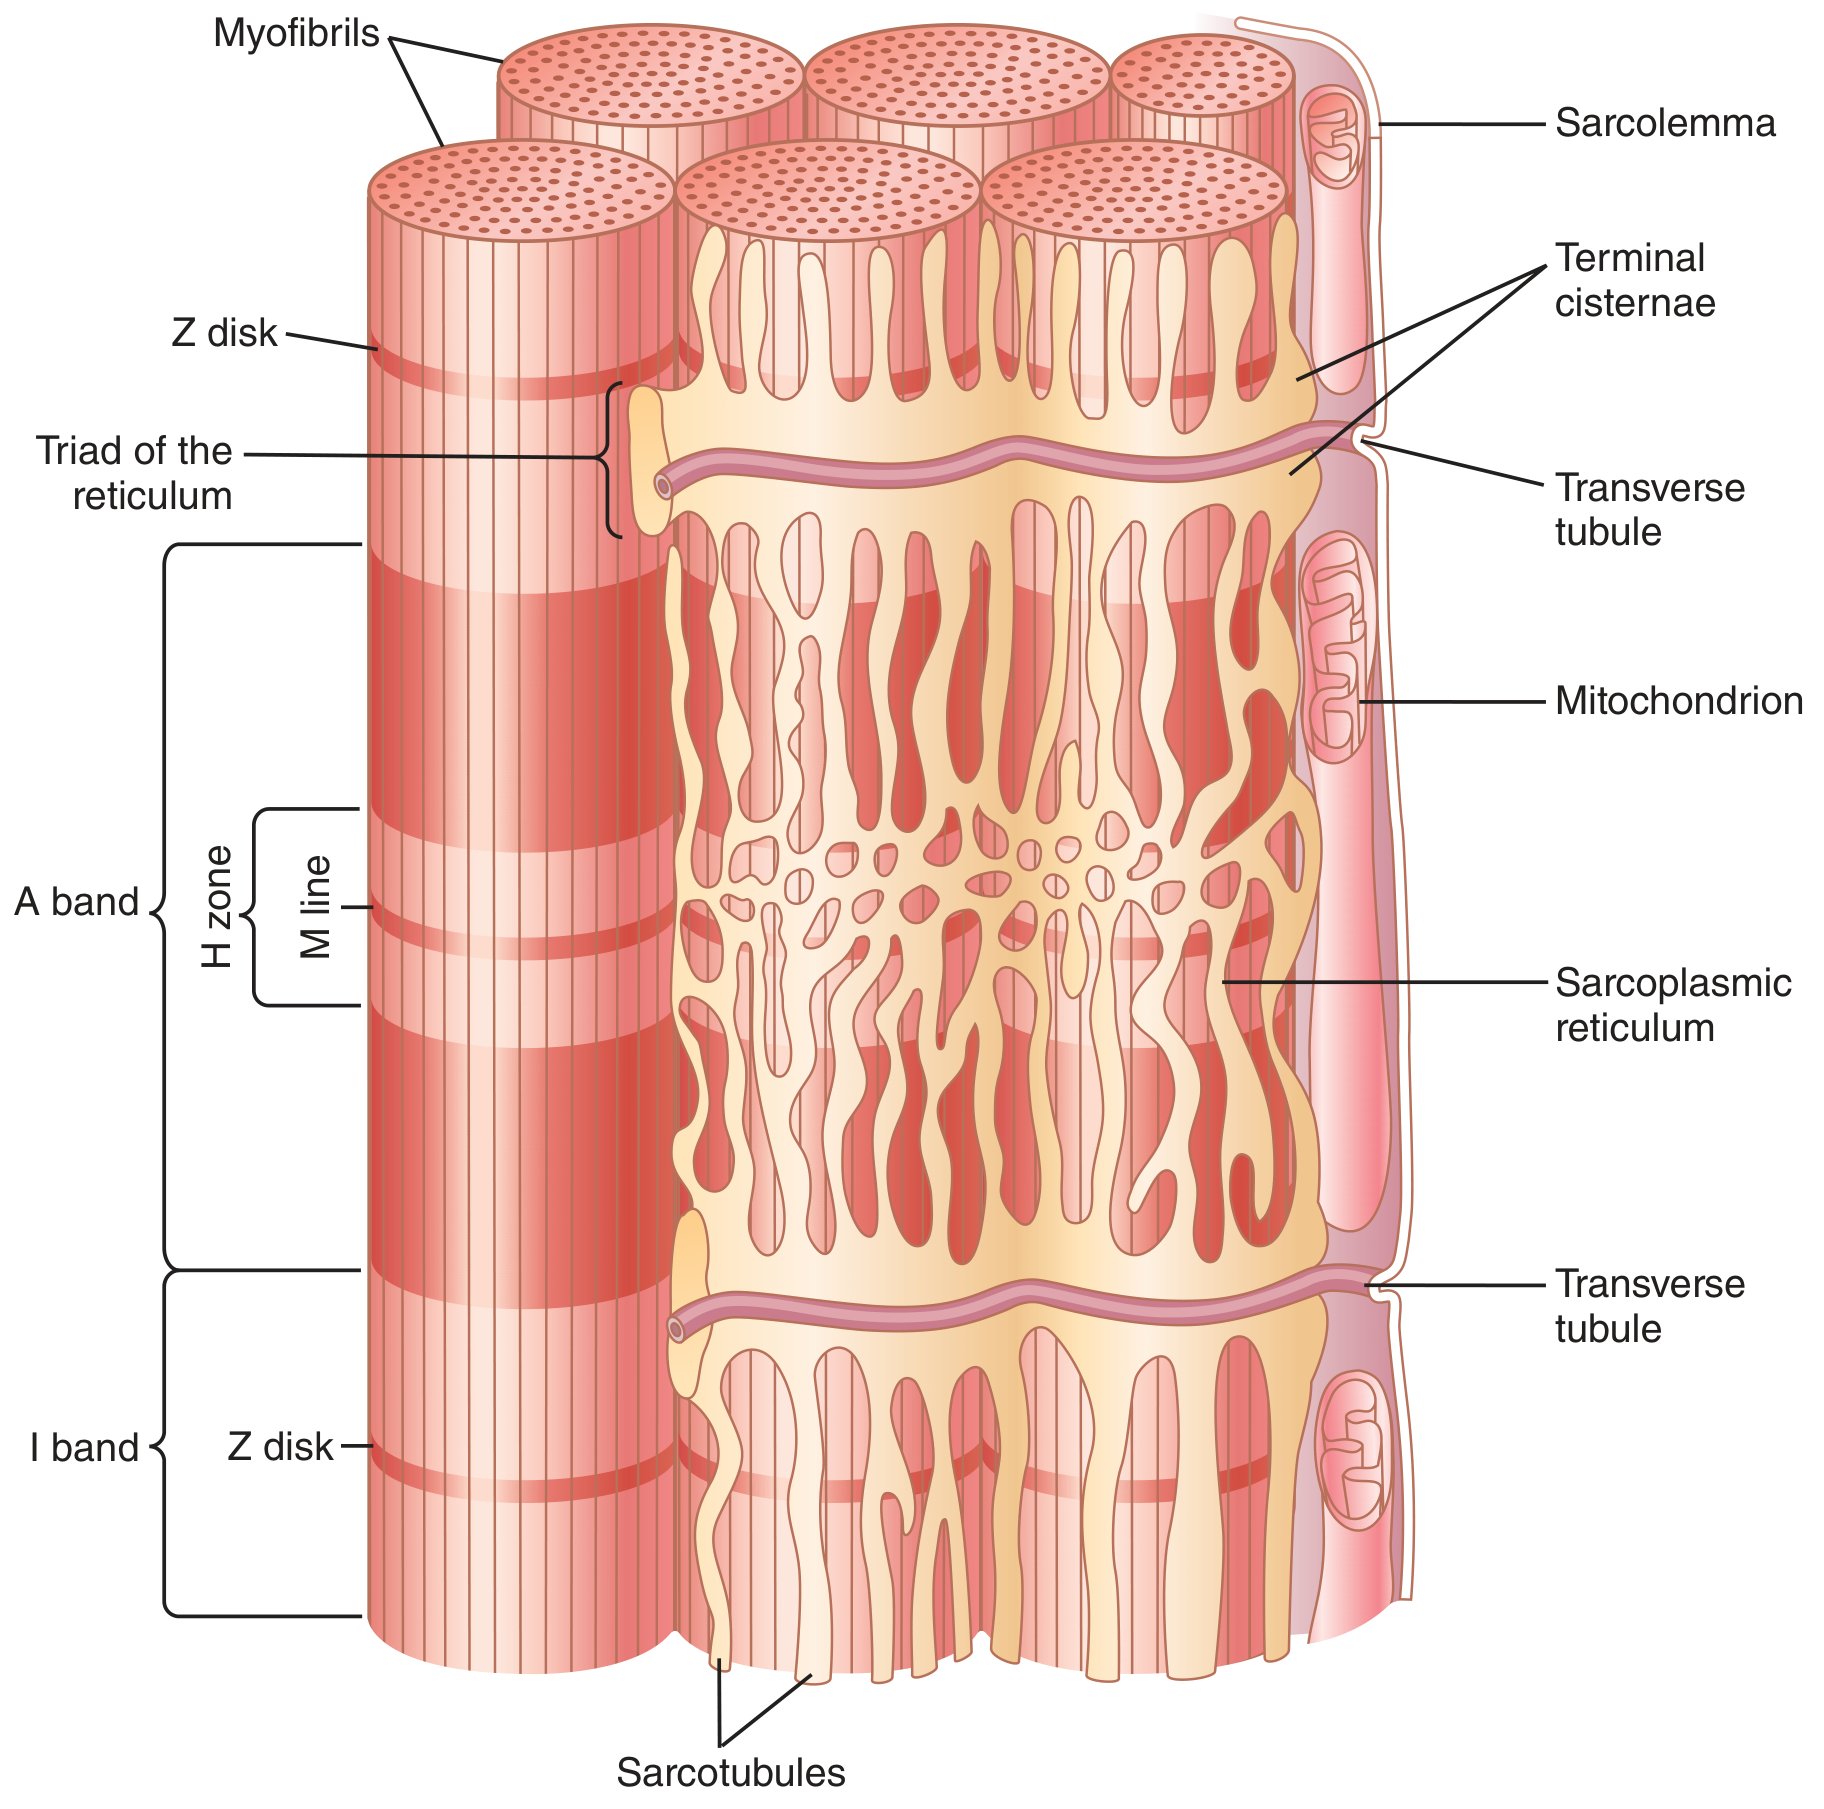
Skeletal Muscle EC Coupling
Steps:
- Action potential propagates along the sarcolemma and into the T-tubule membrane
- Voltage sensing - the T-tubule AP causes a conformational change in the dihydropyridine receptor (DHPR), a voltage-gated L-type Ca²⁺ channel in the T-tubule wall. In skeletal muscle, DHPR acts purely as a voltage sensor, not primarily as a Ca²⁺ channel
- Mechanical coupling - DHPR physically interacts with (and mechanically opens) the ryanodine receptor type 1 (RyR1) on the terminal cisternae of the SR
- Ca²⁺ release - RyR1 opens and Ca²⁺ floods out of the SR lumen into the cytosol, raising [Ca²⁺]i from <10⁻⁷ M (resting) up to 2 × 10⁻⁴ M - a ~500-fold rise, about 10x the threshold for maximal contraction
- Troponin C activation - Ca²⁺ binds troponin C → conformational shift moves tropomyosin away from actin's myosin-binding sites
- Cross-bridge cycling - myosin heads bind actin, undergo power stroke, detach (ATP-dependent); cycling continues as long as [Ca²⁺]i remains high
- Relaxation - SERCA (Sarcoplasmic Reticulum Ca²⁺-ATPase) actively pumps Ca²⁺ back into the SR, concentrating it ~10,000-fold. Ca²⁺ is buffered inside the SR by calsequestrin (binds ~40 Ca²⁺ per molecule). When [Ca²⁺]i falls, troponin releases Ca²⁺, tropomyosin re-blocks actin, and the muscle relaxes
Cardiac Muscle EC Coupling
Steps:
- Action potential spreads over the sarcolemma and into the T-tubules (cardiac T-tubules are ~5x wider than skeletal, with 25x the volume, and carry abundant Ca²⁺ bound to mucopolysaccharides)
- L-type Ca²⁺ channel (DHPR) opens - unlike skeletal muscle, cardiac DHPR is a true Ca²⁺ channel; the plateau phase (Phase 2) of the cardiac AP opens these channels, admitting Ca²⁺ from extracellular fluid into the cell ("trigger Ca²⁺")
- CICR - this small trigger Ca²⁺ influx activates RyR2 on the SR, releasing a much larger Ca²⁺ store (80% of total cytosolic Ca²⁺ comes from SR). The amount released depends on (a) the SR Ca²⁺ load and (b) the size of the trigger Ca²⁺ current
- Troponin C / cross-bridge cycling - same as skeletal muscle
- Relaxation - 80% of Ca²⁺ is recaptured by SERCA2 (regulated by phospholamban); ~15% is extruded by the Na⁺/Ca²⁺ exchanger (NCX, 3:1 ratio) using the inward Na⁺ gradient; ~5% by sarcolemmal Ca²⁺-ATPase
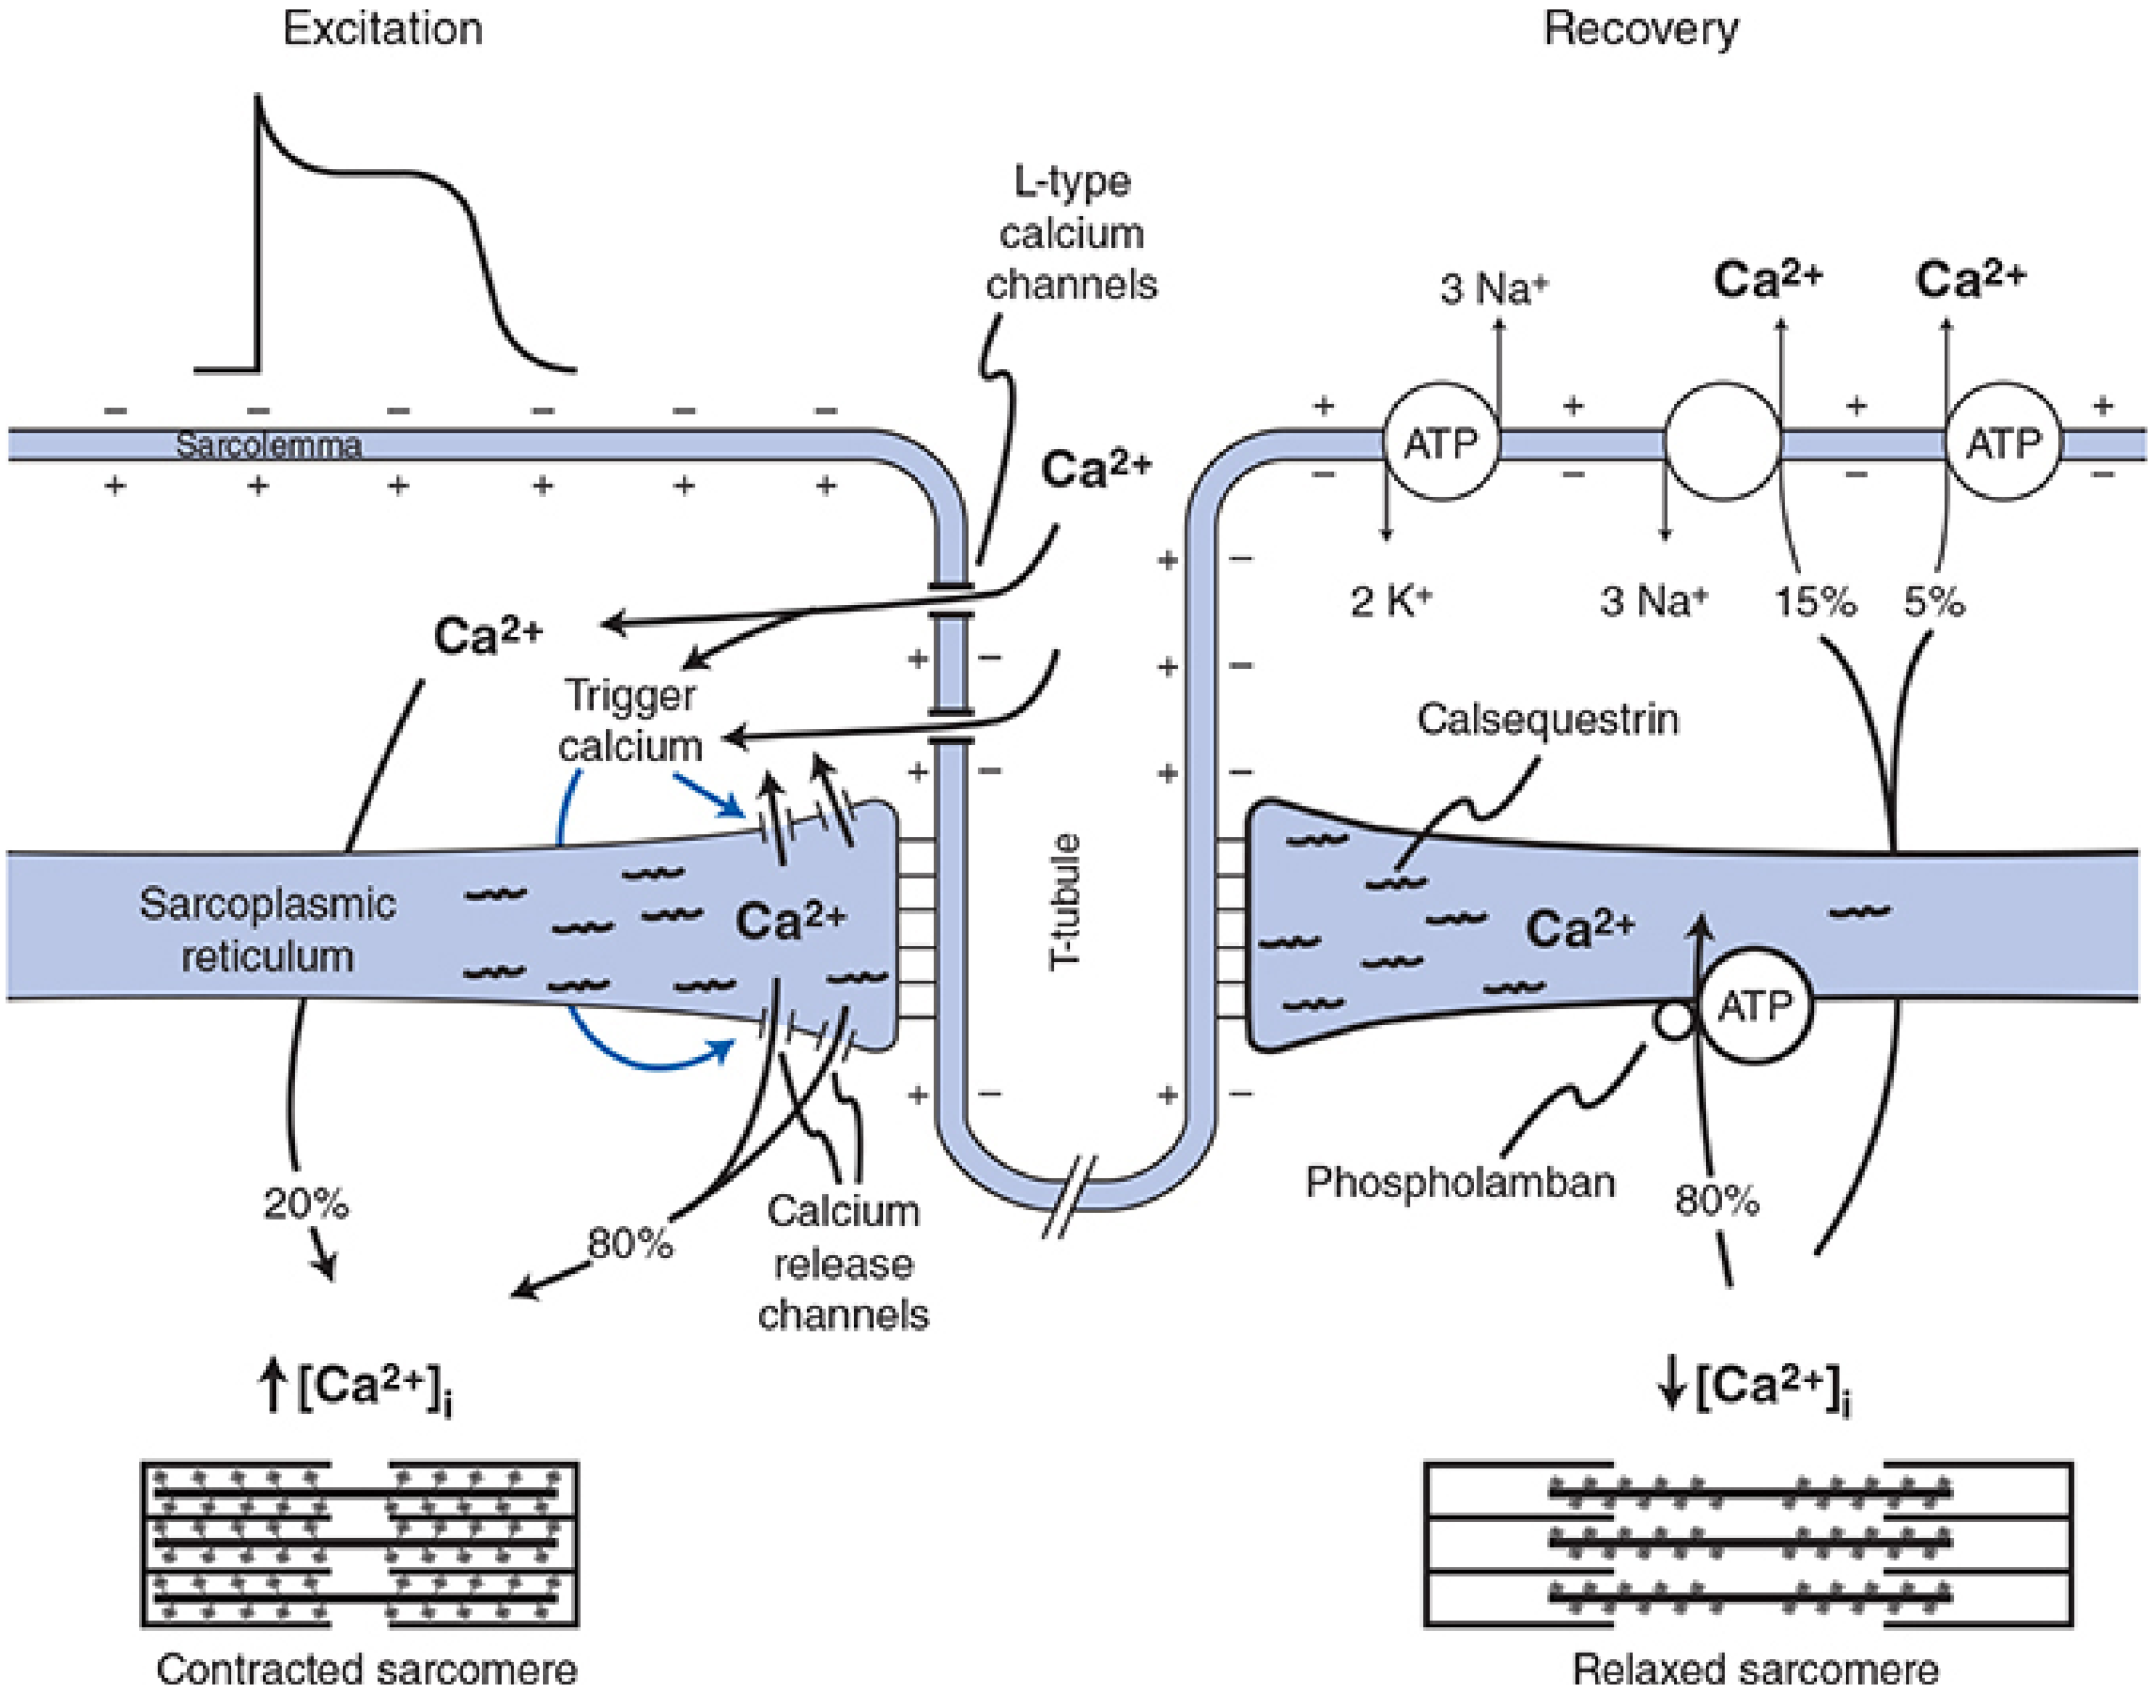
Key clinical consequence: Cardiac contractile force is proportional to intracellular Ca²⁺ concentration. This is why extracellular Ca²⁺ is critical for cardiac function (a Ca²⁺-free heart stops beating), and why agents that modulate Ca²⁺ are powerful cardiac drugs. - Guyton & Hall Textbook of Medical Physiology
Comparison: Skeletal vs. Cardiac EC Coupling
| Feature | Skeletal Muscle | Cardiac Muscle |
|---|---|---|
| DHPR role | Voltage sensor only | Voltage sensor + Ca²⁺ channel |
| RyR subtype | RyR1 | RyR2 |
| Mechanism | Direct mechanical coupling (DHPR-RyR1) | Ca²⁺-induced Ca²⁺ release (CICR) |
| Ca²⁺ from ECF needed? | No | Yes (essential) |
| T-tubule diameter | Smaller | ~5x larger |
| SR Ca²⁺ stores | Sufficient for full contraction | Insufficient alone |
| Tetanus possible? | Yes | No (refractory period = AP duration) |
| Ca²⁺ re-uptake | SERCA (skeletal isoform) | SERCA2a + NCX + sarcolemmal Ca²⁺-ATPase |
| Relaxation regulation | SERCA activity | SERCA2a regulated by phospholamban |
Modulation of Cardiac EC Coupling (Clinically Relevant)
| Agent/Mechanism | Effect | Mechanism |
|---|---|---|
| β₁-adrenergic agonists (e.g. adrenaline) | ↑ inotropy, ↑ lusitropy | ↑ cAMP → PKA → phosphorylates DHPR, RyR2, phospholamban → more Ca²⁺ release, faster re-uptake |
| Phosphodiesterase inhibitors (milrinone) | ↑ inotropy + lusitropy | ↑ cAMP (prevent breakdown) |
| Digoxin | ↑ inotropy | Inhibits Na⁺/K⁺-ATPase → ↑ intracellular Na⁺ → ↓ NCX activity → ↑ Ca²⁺ |
| Levosimendan | ↑ inotropy | Ca²⁺ sensitizer - binds troponin C, stabilizes Ca²⁺-troponin C complex |
| L-type Ca²⁺ blockers (verapamil, diltiazem) | ↓ inotropy, ↓ HR | Block trigger Ca²⁺, reduce CICR |
- Costanzo Physiology 7th Edition, p. 150
- Guyton and Hall Textbook of Medical Physiology
- Morgan and Mikhail's Clinical Anesthesiology, 7e, p. 648-649