
Concept of lead time.
Lead time is the total time elapsed between the initiation of a process and its completion. In supply chain and inventory management, it typically means the time from placing an order to receiving the goods. It has slightly different meanings depending on the context - manufacturing, procurement, project management, etc.
Searching sources...
Searching the Web
concept of lead time supply chain inventory management explained
Lead Time - Complete Concept
Definition
Lead time is the total elapsed time from the initiation of a process to its completion. In the most common business context (supply chain/inventory), it is the time from when a customer or buyer places an order to when the goods are ready for delivery or use.
The Chartered Institute of Procurement & Supply (CIPS) defines total lead time as:
- Internal lead time - time for the buying organization's internal processes (identifying a need, approvals, issuing a purchase order)
- External lead time - time for the supplier's processes (manufacturing, dispatch, delivery)
Types of Lead Time
| Type | Description |
|---|---|
| Order/Procurement Lead Time | Time from placing a purchase order to receiving goods |
| Manufacturing Lead Time | Time from starting production to completing a finished product |
| Customer/Delivery Lead Time | Time from customer order to final delivery |
| Supplier Lead Time | Time a supplier needs to fulfill an order |
| Material Lead Time | Time to source raw materials before production begins |
| Cumulative Lead Time | The longest chain of lead times across the entire supply network |
Lead Time Formulas
Basic formula:
Lead Time = Order Delivery Date - Order Request Date
For inventory management:
Lead Time = Supply Delay (SD) + Reordering Delay (RD)
For manufacturing:
Lead Time = Pre-processing Time + Processing Time + Post-processing Time
Components of Lead Time
- Pre-processing - Reviewing requirements, approvals, issuing a purchase order
- Processing - Actual production or picking/packing of goods
- Shipping/Transit - Time in transit from supplier to buyer
- Receiving & Inspection - Unloading, quality checks, put-away time
Why Lead Time Matters
Inventory Management
- Determines how much safety stock must be held. Longer or more variable lead times require larger buffer inventory
- Drives reorder point (ROP) calculations:
ROP = (Average Daily Demand x Lead Time) + Safety Stock
Customer Service
- Directly affects how fast customers receive orders - a key competitive differentiator
Cash Flow
- Long lead times tie up capital in inventory and work-in-progress
Supply Chain Risk
- Variable or unpredictable lead times cause the bullwhip effect - small demand fluctuations get amplified upstream, creating large swings in orders and inventory
Lead Time vs. Related Concepts
| Concept | Meaning |
|---|---|
| Lead Time | Total time from order placed to delivery received |
| Cycle Time | Time actually spent working on the task (excludes wait times) |
| Takt Time | Rate at which products must be produced to meet demand |
| Throughput Time | Time a unit spends in the production system |
Strategies to Reduce Lead Time
- Supplier collaboration - Share demand forecasts, establish VMI (Vendor Managed Inventory)
- Just-In-Time (JIT) - Reduce stock holdings by synchronizing supply with demand
- Process streamlining - Eliminate non-value-adding steps in procurement and production
- Nearshoring/local sourcing - Shorten transit distances
- Automation - Faster order processing, production, and dispatch
- Safety stock optimization - Use statistical models to buffer variability without over-stocking
Context-Specific Uses
- Manufacturing: Includes shipping time from supplier because MRP (Material Requirements Planning) systems need to know when parts arrive - put-away and inspection time can be significant, especially in JIT environments
- Project Management: Time between initiating a project phase and its completion
- Software/Agile: Time from a feature request entering the backlog to it being shipped
- Information Lead Time: The parallel to material lead time - how fast information flows up and down the supply chain; reducing both is necessary for supply chain performance improvement (Mason-Jones & Towill)
In short, lead time is one of the most fundamental metrics in operations management. Shorter, predictable lead times mean leaner inventories, lower costs, and better customer service. The goal is not just to minimize lead time, but to make it reliable and consistent, since variability is often more damaging than length alone.
concept of lead time in the screening lesson
In the context of screening (epidemiology/preventive medicine), lead time refers to the period of time by which early detection through screening advances the diagnosis compared to when it would have been diagnosed symptomatically. This is a medical topic - let me search the textbooks first.
Searching sources...
Reading File
Finding Sources
Finding Sources
Good - multiple textbook hits. Let me read the most comprehensive ones alongside the diagram images.
Reading File
Reading File
Reading File
Excellent - rich content and diagram URLs found. Let me fetch the key diagrams now.
Loading Image
Loading Image
All the content needed is now in context. Here is a complete, textbook-sourced explanation:
Lead Time in Screening (Epidemiology)
Definition
Lead time is the period between the detection of a disease by screening and the point when it would have been diagnosed based on symptoms alone (i.e., clinical presentation).
In simpler terms: it is how much earlier the disease clock starts ticking after a screening test finds it, compared to waiting for the patient to feel ill.
"Lead time is the period from detection of disease (which is intimately related to novel screening and detection modalities) and the disease's clinical presentation and diagnosis."
- Campbell-Walsh-Wein Urology
The Core Problem: Lead Time Bias
Lead time becomes a bias when it is used to falsely claim that a screening test improves survival.
How the bias works:
Imagine two patients with the same disease, following the exact same biological course - both will die at the same time:
- Unscreened patient: diagnosed at symptom onset, survives 2 years after diagnosis
- Screened patient: diagnosed 3 years earlier by screening, survives 5 years after diagnosis
At first glance, the screened patient appears to have lived 3 years longer. But in reality, the point of death has not moved - the disease was simply detected earlier. The "extra" 3 years of survival is entirely the lead time, not a genuine benefit.
"Lead time bias means that the disease is detected earlier, but the outcome is not changed. The point of death is not moved back; the disease was simply detected earlier making it seem that life expectancy is improved."
- Textbook of Family Medicine, 9e
Diagram: Lead Time Bias
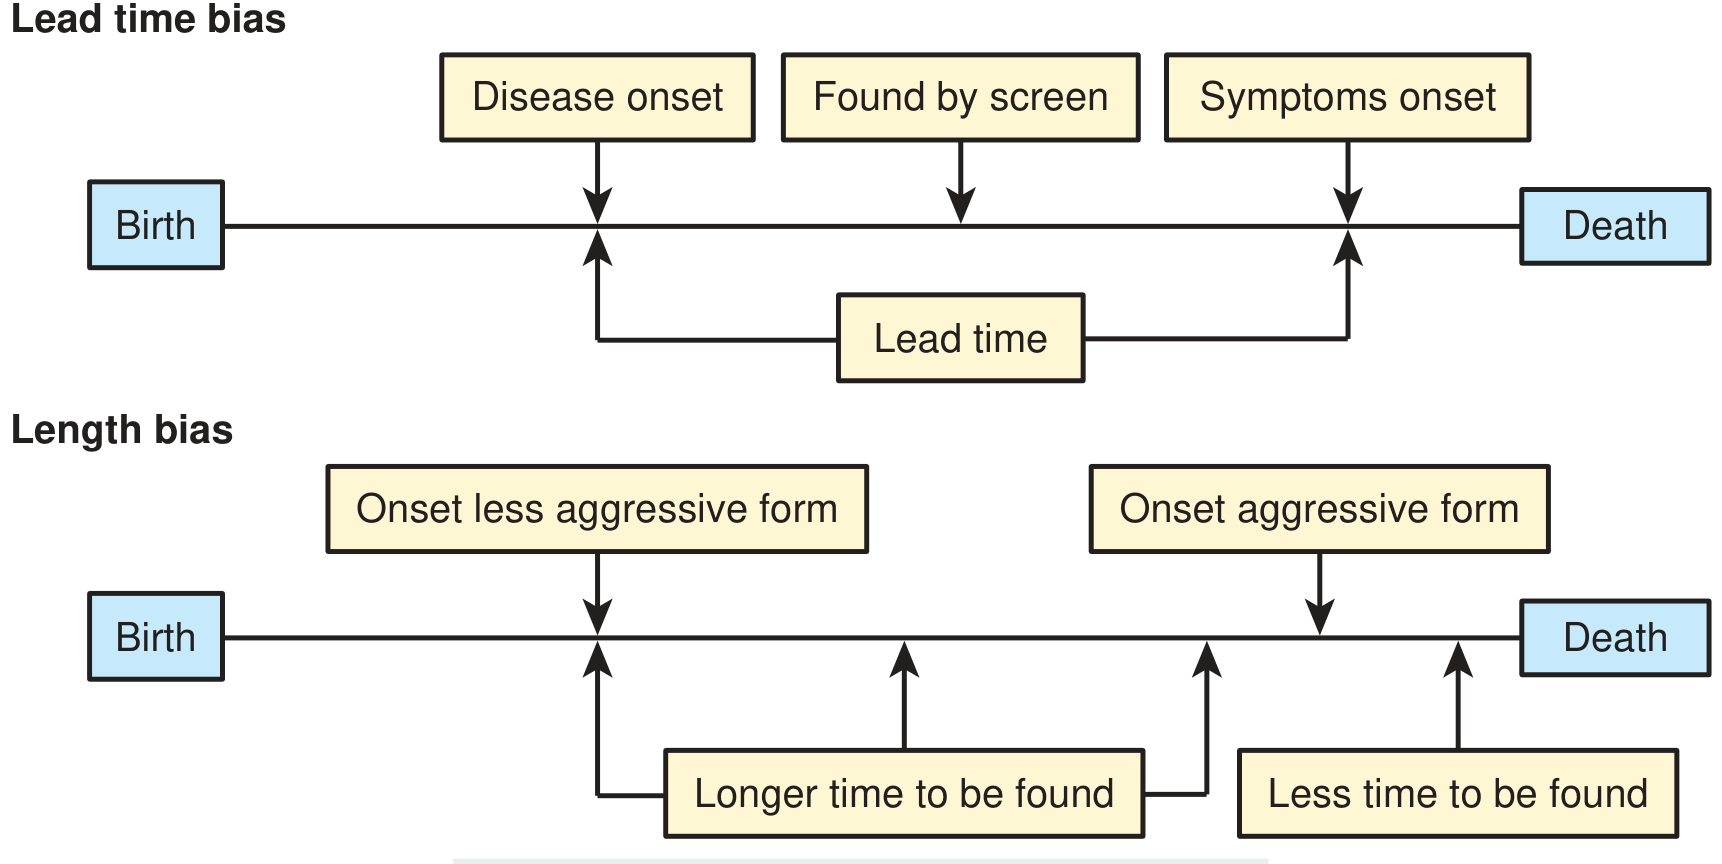
Figure 7-2: Lead-time bias and length bias - Textbook of Family Medicine, 9e
Diagram: Three Scenarios (The Key to Understanding)
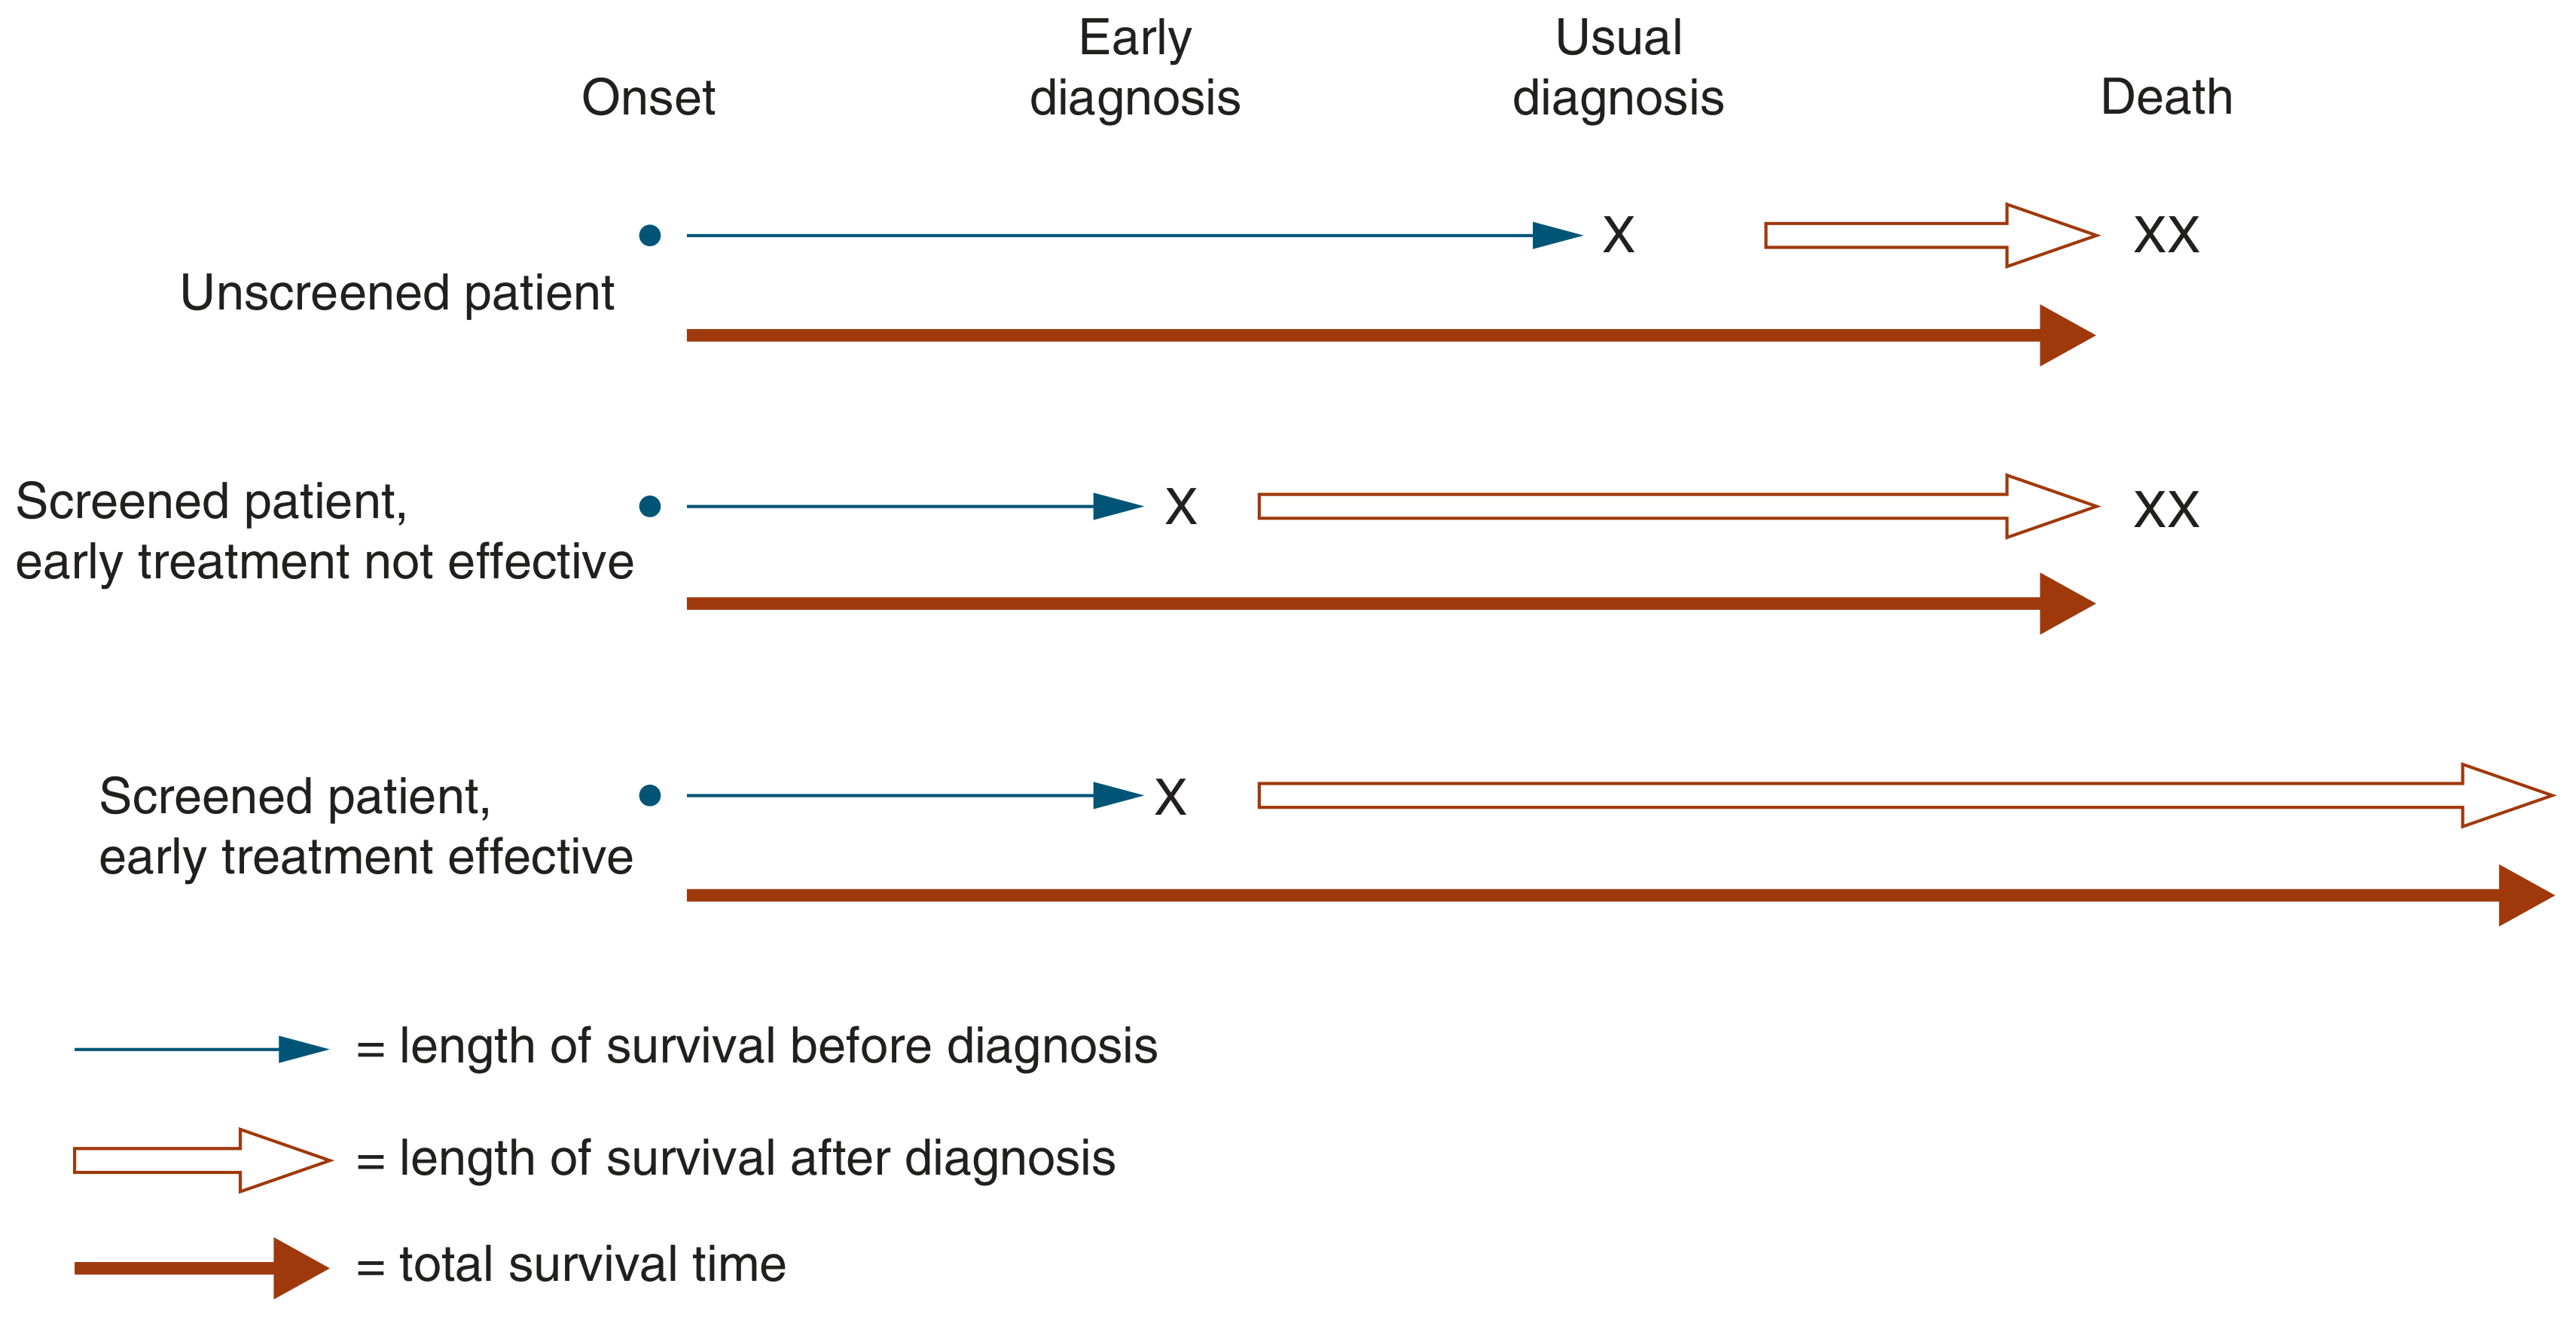
Figure 2-2: Lead time bias - Symptom to Diagnosis: An Evidence-Based Guide, 4e
The diagram illustrates three scenarios:
| Scenario | What happens |
|---|---|
| Unscreened patient | Diagnosed at symptoms, shorter post-diagnosis survival, same total survival |
| Screened, early treatment NOT effective | Diagnosed earlier, longer post-diagnosis survival, but same total survival - this is pure lead time bias |
| Screened, early treatment IS effective | Diagnosed earlier, total survival is genuinely lengthened - screening has real benefit |
How Lead Time Bias Distorts Outcomes
When a study compares 5-year survival rates between screened and unscreened groups without accounting for lead time, it will falsely show better survival in the screened group even if the screening does nothing to change the disease course. This is why:
- Survival time after diagnosis is a misleading endpoint for evaluating screening
- The correct endpoints to measure are all-cause mortality or disease-specific mortality
"Outcomes such as cancer stage distribution and length of survival after diagnosis can be misleading because of lead time and length time biases."
- Symptom to Diagnosis, 4e
Real-World Example: Kidney Cancer
A textbook example of lead time bias from Campbell-Walsh-Wein Urology:
- Over 30 years, increased use of abdominal CT scanning detected more asymptomatic renal masses
- The 5-year survival rate in kidney cancer rose from 50% to 75% - appearing to show great improvement
- However, the mortality rate from kidney cancer remained stable over the same period
- Conclusion: the apparent survival benefit was entirely due to lead time bias, not genuine improvement in outcomes
Similarly, improved survival claims from PSA testing in prostate cancer have been attributed to lead time bias by many researchers.
Lead Time vs. Length Time Bias (Comparison)
Both biases affect screening studies and often coexist:
| Feature | Lead Time Bias | Length Time Bias |
|---|---|---|
| Definition | Earlier diagnosis makes survival appear longer | Screening preferentially detects slower-growing (less aggressive) tumors |
| Mechanism | Clock starts earlier, endpoint unchanged | Milder disease is more likely to be caught between screening intervals |
| Effect | Inflates post-diagnosis survival time | Selects a group with inherently better prognosis |
| Example | PSA screening, kidney cancer incidentalomas | Breast cancer screening catching indolent tumors |
"Cancers that progress rapidly from onset to symptoms are less likely to be detected by screening than slow-growing cancers, so that screening tends to identify a group with a better prognosis."
- Symptom to Diagnosis, 4e
Special Application: Mammography Lead Time
In breast cancer screening, lead time has an additional practical role beyond bias - it determines the screening interval:
"The interval at which a screening mammogram needs to be repeated is determined by lead time, which is age related. The lead time of screening is that time between mammographic detection of breast cancer and clinical presentation."
- Grainger & Allison's Diagnostic Radiology
Younger women have faster-growing tumors and therefore shorter lead times, which means shorter mammography intervals are needed. Older women have longer lead times, allowing for less frequent screening.
Summary
| Key point | |
|---|---|
| Lead time | The head start that screening gives over symptom-based diagnosis |
| Lead time bias | The false appearance of improved survival when only the diagnosis date is moved earlier |
| How to avoid the bias | Use mortality rates (not survival times) as the primary outcome in screening trials |
| When screening truly works | When early treatment is genuinely more effective than later treatment - then lead time translates into real mortality benefit |
- Textbook of Family Medicine, 9e, p. 122
- Symptom to Diagnosis: An Evidence-Based Guide, 4e, p. 23
- Campbell-Walsh-Wein Urology, Overall Mortality section
This is a shared conversation. Sign in to Orris to start your own chat.