
Explain the patho physiology of MASLD
Reading File
Now let me search the medical library and PubMed in parallel for MASLD pathophysiology.
Finding Sources
Finding Sources
Searching PubMed
MASLD "metabolic associated steatotic liver disease" pathophysiology
Excellent. I found rich content in Harrison's 22E and Robbins. Let me now read the key pathophysiology sections from Harrison's and Robbins, plus search for the specific pathophysiology section heading.
Finding Sources
Reading File
I need to find the exact MASLD section in Harrison's. Let me look at the block more precisely and also check Robbins for pathology content.
Reading File
Finding Sources
I have excellent content from Harrison's. The pathophysiology section is in there. Let me continue reading further into this block to get the pathophysiology section:
Reading File
Finding Sources
I have found the key pathogenesis section in Harrison's. The read_file output was truncated mid-way. Let me read the rest of the MOLECULAR AND CELLULAR PATHOGENESIS section and also get the histopathology image from Robbins.
Reading File
Finding Sources
Excellent - I have a very rich, detailed content from Harrison's 22E. Let me also fetch the histopathology image from Harrison's and read a bit more to get the fibrosis/genetics content, plus get Robbins pathology content.
Loading Image
Reading File
I now have comprehensive content from Harrison's 22E on MASLD pathophysiology. I have everything I need to write a detailed, well-structured answer. Let me now compose the response.
Pathophysiology of MASLD (Metabolic Dysfunction-Associated Steatotic Liver Disease)
MASLD is the updated nomenclature (replacing NAFLD) that sits under the umbrella of steatotic liver disease (SLD). It is defined by hepatic steatosis plus one or more cardiometabolic risk factors, with minimal alcohol use (<20 g/d women; <30 g/d men). Its inflammatory subtype is MASH (replacing NASH), and the spectrum progresses from simple steatosis (MASL) through MASH to fibrosis and cirrhosis.
1. Core Concept: Energy Imbalance as the Upstream Driver
The foundational mechanism is an imbalance between energy intake and expenditure. Excessive caloric intake combined with reduced physical activity overwhelms the capacity of peripheral adipose tissue to store surplus energy. This leads to:
- Visceral adiposity
- Insulin resistance
- Systemic metabolic dysfunction
Harrison's Principles of Internal Medicine 22E, p. 2744
2. Hepatic Steatosis - The First Step
Triglyceride accumulates in hepatocytes (steatosis) through four main mechanisms:
| Mechanism | Details |
|---|---|
| Increased dietary FA delivery | High-fat, high-sugar diets increase free fatty acid (FFA) flux to the liver |
| Increased adipose lipolysis | Insulin resistance in adipocytes releases FFA into the portal circulation |
| De novo lipogenesis (DNL) | Dietary fructose and hyperinsulinemia upregulate DNL in hepatocytes |
| Impaired FA export/oxidation | Reduced VLDL secretion and impaired mitochondrial beta-oxidation trap fatty acids |
Triglyceride accumulation per se is a relatively safe storage form - steatosis alone does not damage the liver. However, it is a biomarker of underlying metabolic dysfunction that can progress further.
Genetic modifiers play a significant role:
- PNPLA3 I148M polymorphism - impairs lipolysis of lipid droplets; greatest known genetic risk factor
- TM6SF2 - influences cholesterol metabolism
- MBOAT7 - influences phospholipid metabolism
- HSD17B13 loss-of-function variants - protective against MASH, fibrosis progression, and liver cancer
Harrison's Principles of Internal Medicine 22E, p. 2744-2745
3. Transition to MASH (Steatohepatitis) - Lipotoxicity
The critical step distinguishing MASH from simple steatosis is lipotoxicity - lipid-associated cell injury.
How lipotoxicity develops:
- Dysregulated fatty acid processing produces toxic lipid intermediates (ceramides, diacylglycerols, lysophosphatidylcholine, reactive oxygen species)
- These intermediates activate endoplasmic reticulum (ER) stress, oxidative stress, and mitochondrial dysfunction
- Hepatocyte "resilience" (adaptive metabolic capacity) determines whether this resolves or progresses
Key mediators and pathways:
| Mediator | Role |
|---|---|
| Oxidative stress / ROS | Mitochondrial dysfunction generates free radicals that damage hepatocyte DNA, membranes, and proteins |
| ER stress (UPR activation) | Overwhelmed protein folding triggers inflammatory cascades (NF-κB, JNK activation) |
| Inflammatory cytokines | TNF-α, IL-6, IL-1β from activated Kupffer cells and adipose tissue promote hepatocyte injury |
| Hepatokines | Injured hepatocytes secrete altered signals (FGF21, fetuin-A) that alter systemic metabolism |
| Adipokines | Adiponectin (protective - decreased in obesity), leptin (pro-inflammatory - increased), resistin promote inflammation |
| Uric acid | Promotes oxidative stress and inflammasome (NLRP3) activation |
4. Role of Insulin Resistance
Insulin resistance is the central metabolic driver and operates at multiple levels:
- Adipocytes: Unrestrained lipolysis floods the portal circulation with FFAs
- Hepatocytes: Paradoxical insulin resistance - glucose homeostasis is impaired while insulin continues to drive DNL (selective insulin resistance - the lipogenic arm remains active)
- Pancreatic beta cells: Compensatory hyperinsulinemia further promotes fat synthesis and storage
Harrison's Principles of Internal Medicine 22E, p. 2745
5. Gut-Liver Axis
Obesity-associated changes in the gut microbiome contribute through two mechanisms:
- Enhanced energy harvest - altered microbiota extract more calories from dietary fiber
- Increased intestinal permeability - dysbiosis disrupts tight junctions, allowing bacterial products (LPS/endotoxin) to enter the portal circulation via the gut-liver axis
Hepatic toll-like receptors (TLR4) recognize LPS, triggering Kupffer cell activation and pro-inflammatory cytokine release (TNF-α, IL-1β), amplifying hepatic inflammation and steatohepatitis.
Harrison's Principles of Internal Medicine 22E, p. 2744; Benedé-Ubieto et al., Gut Microbes 2024
6. Fibrosis - The Determinant of Prognosis
Once lipotoxic stress is sustained, futile repair replaces healthy regeneration:
- Dying hepatocytes release DAMPs (danger-associated molecular patterns) that activate hepatic stellate cells (HSCs)
- Activated HSCs transdifferentiate into myofibroblasts and deposit collagen (fibrosis)
- Progressive fibrosis: pericellular "chicken-wire" fibrosis around zone 3 hepatocytes → bridging fibrosis (F3) → cirrhosis (F4)
- Fibrosis stage is the primary predictor of liver-related morbidity and mortality in MASLD
Fibrosis progression rates:
- Simple steatosis: ~1 stage per 14 years
- MASH: ~1 stage per 7 years
- Patients with MASH + fibrosis ≥F2 = "at-risk MASH" requiring intensive monitoring
7. Risk Factors That Amplify the Pathophysiology
| Risk Factor | Mechanism |
|---|---|
| Type 2 Diabetes | Strongest risk factor for MASLD acquisition, fibrosis progression, and HCC. Bidirectional - MASLD also increases T2DM risk 2-5x |
| Visceral/Android obesity | Increased visceral fat releases pro-inflammatory adipokines and FFAs |
| Dyslipidemia | Plasma lipid subfractions more atherogenic in MASLD (2x prevalence vs. non-MASLD) |
| Hypertension | Component of metabolic syndrome, amplifies vascular injury |
| High fructose/saturated fat diet | Upregulates DNL, promotes steatosis |
| Sedentary lifestyle | Reduces beta-oxidation in muscle and liver |
| Lean MASLD | Common in Asians - driven by increased visceral adiposity and insulin resistance despite normal BMI |
8. Histopathologic Spectrum

FIGURE 354-1 (Harrison's 22E): A. Healthy liver. B. Simple steatosis (fatty hepatocyte, arrow). C. MASH with ballooned hepatocyte (arrow) and pericellular fibrosis (arrowheads). D. Cirrhosis with bridging fibrosis.
Key histologic features of MASH:
- Macrovesicular steatosis (>5% hepatocytes)
- Hepatocyte ballooning (marker of lipotoxic injury; loss of keratin 8/18)
- Lobular inflammation (neutrophilic infiltrates)
- Pericellular fibrosis around zone 3 (centrilobular) hepatocytes - the "chicken-wire" pattern
- Note: Pediatric MASLD differs - shows more diffuse steatosis and portal (rather than central) fibrosis
9. Progression to HCC
Hepatocellular carcinoma (HCC) can occur both in the setting of cirrhosis (most common) and in non-cirrhotic MASLD. The mechanisms include:
- Sustained oxidative DNA damage
- Malignant transformation of regenerating hepatocytes under lipotoxic stress
- MASH-driven fibrosis creates a permissive oncogenic microenvironment
- Annual HCC incidence in MASLD-cirrhosis: 1-2% per year
Harrison's Principles of Internal Medicine 22E, Ch. 354
Summary Diagram of Pathogenesis
Energy excess + Sedentary lifestyle
         ↓
Visceral adiposity + Insulin Resistance
         ↓
↑ FFA flux → Hepatocyte + ↑ DNL + ↓ FA oxidation
         ↓
Triglyceride accumulation = STEATOSIS (MASL)
         ↓
Dysregulated FA processing → Toxic lipid intermediates
         ↓
LIPOTOXICITY
         ↓
Oxidative stress + ER stress + Inflammation + Gut dysbiosis (LPS/TLR4)
         ↓
Hepatocyte ballooning + Lobular inflammation = MASH
         ↓
Kupffer cell activation → Stellate cell activation → FIBROSIS
         ↓
Bridging fibrosis → CIRRHOSIS → HCC
Sources: Harrison's Principles of Internal Medicine 22E (2025), Chapter 354 (Manal F. Abdelmalek, Anna Mae Diehl) | Benedé-Ubieto et al., Gut Microbes 2024, PMID 38512763
Explain the patho physiology of MASLD
Reading File
Quick answer: MASLD (Metabolic Dysfunction-Associated Steatotic Liver Disease) is driven by an energy surplus that causes hepatic fat accumulation (steatosis), followed by lipotoxicity that triggers inflammation (MASH), and ultimately hepatic stellate cell activation causing fibrosis and cirrhosis. Insulin resistance, adipose dysfunction, de novo lipogenesis, gut dysbiosis, and genetic polymorphisms (notably PNPLA3) all converge to drive this process.
Searching sources...
Finding Sources
Searching PubMed
MASLD pathophysiology mechanisms
Now let me read the core pathogenesis section from Harrison's 22E (the most up-to-date source) and get the histopathology image simultaneously.
Reading File
Finding Sources
The read returned lots of content but was truncated. The key MOLECULAR AND CELLULAR PATHOGENESIS section starts around line 882. Let me read that directly.
Reading File
Excellent - the content is rich. Now let me get the continuation (fibrosis/disease modifiers section) and the histopathology image in parallel.
Reading File
Loading Image
I now have all the key content needed. Let me compose the full, detailed response.
Pathophysiology of MASLD
MASLD (Metabolic Dysfunction-Associated Steatotic Liver Disease) replaced the older term NAFLD in 2023. It sits under the umbrella of steatotic liver disease (SLD) and is defined by hepatic steatosis + at least one cardiometabolic risk factor + minimal alcohol use (≤20 g/d women; ≤30 g/d men). Its inflammatory subtype is MASH (formerly NASH). The disease spans a spectrum from simple steatosis through steatohepatitis, fibrosis, cirrhosis, and HCC.
1. Upstream Driver: Energy Imbalance
The entire cascade is initiated by a mismatch between energy intake and expenditure. Excessive caloric intake + reduced physical activity overwhelms the capacity of peripheral adipose depots to store surplus energy, resulting in:
- Visceral adiposity
- Insulin resistance
- Systemic metabolic dysfunction
These three form the engine that drives everything downstream.
Harrison's Principles of Internal Medicine 22E (2025), Ch. 354
2. Hepatic Steatosis (MASL) - Step 1
Triglycerides accumulate inside hepatocytes through four converging mechanisms:
| Mechanism | Detail |
|---|---|
| ↑ Dietary fatty acid delivery | High-fat, high-sugar diets flood the portal circulation with free fatty acids (FFAs) |
| ↑ Adipose lipolysis | Insulin resistance in adipocytes removes the inhibitory brake on lipolysis, releasing FFAs into circulation |
| ↑ De novo lipogenesis (DNL) | Dietary fructose and hyperinsulinemia upregulate DNL within hepatocytes themselves |
| ↓ FA export / oxidation | Impaired VLDL secretion and reduced mitochondrial beta-oxidation trap fatty acids inside hepatocytes |
Triglyceride accumulation per se is a relatively safe storage form - it does not directly injure the liver. However, steatosis is a biomarker of underlying metabolic dysfunction that, left unchecked, sets the stage for lipotoxicity.
3. Transition to MASH (Steatohepatitis) - The Key Step: Lipotoxicity
Lipotoxicity (lipid-associated cell injury) is what distinguishes MASH from simple steatosis. It arises from dysregulated processing of fatty acids and lipid intermediates stored within lipid droplets, generating toxic by-products.
How lipotoxic stress develops:
Excess FFA → Dysregulated FA processing
           → Toxic lipid intermediates (ceramides, diacylglycerol,
             lysophosphatidylcholine, reactive oxygen species)
           → ER stress, mitochondrial dysfunction, oxidative stress
           → Hepatocyte injury (ballooning, apoptosis, necroptosis)
Key mediators of lipotoxicity and inflammation:
| Mediator | Source | Effect |
|---|---|---|
| Reactive oxygen species (ROS) | Mitochondrial dysfunction | Oxidative damage to DNA, membranes, proteins |
| ER stress / Unfolded Protein Response | Overwhelmed hepatocyte proteostasis | Activates NF-κB and JNK → inflammation |
| TNF-α, IL-6, IL-1β | Activated Kupffer cells, visceral adipose | Pro-inflammatory hepatocyte injury |
| Adipokines | Adipose tissue | ↓ Adiponectin (anti-inflammatory, protective); ↑ Leptin, resistin (pro-inflammatory) |
| Hepatokines | Injured hepatocytes | Altered FGF21, fetuin-A secretion disrupts systemic metabolic crosstalk |
| Uric acid | Hepatocyte purine metabolism | Activates NLRP3 inflammasome; drives oxidative stress |
Hepatocyte resilience - the capacity to adapt metabolism to prevent/withstand/repair lipotoxic damage - is the key determinant of whether an individual develops MASH or recovers. Multiple genetic, epigenetic, and environmental factors modulate this resilience.
4. The Central Role of Insulin Resistance
Insulin resistance operates at multiple levels simultaneously, creating a self-amplifying loop:
- Adipocytes: Insulin fails to suppress lipolysis → unrestrained FFA release into portal blood
- Hepatocytes (selective/paradoxical IR): Glucose production is not suppressed (IR), but DNL remains insulin-responsive and is upregulated by compensatory hyperinsulinemia - this "selective IR" drives fat synthesis while glucose homeostasis fails
- Pancreatic beta cells: Compensatory hyperinsulinemia further promotes hepatic fat uptake, triglyceride synthesis, and fat storage
The MASLD-T2DM relationship is bidirectional: MASLD worsens insulin sensitivity and increases T2DM risk 2-5x, while T2DM is the single strongest risk factor for fibrosis progression and HCC in MASLD.
5. The Gut-Liver Axis
Obesity-associated gut dysbiosis contributes through two mechanisms:
- Enhanced energy harvest - altered microbiota ferment dietary fiber more efficiently, extracting additional calories
- Increased intestinal permeability - dysbiosis disrupts epithelial tight junctions, allowing bacterial lipopolysaccharide (LPS/endotoxin) to translocate into the portal circulation
LPS activates hepatic Toll-like receptor 4 (TLR4) on Kupffer cells, triggering NF-κB-mediated release of TNF-α and IL-1β, amplifying hepatic inflammation and steatohepatitis.
6. Genetics - Risk Modifiers
Several genetic polymorphisms substantially alter individual susceptibility:
| Gene | Variant | Effect |
|---|---|---|
| PNPLA3 | I148M (rs738409) | Impairs lipolysis of hepatic lipid droplets; the strongest known genetic risk factor for MASLD/MASH/HCC |
| TM6SF2 | E167K | Reduces VLDL secretion; promotes hepatic fat retention and fibrosis |
| MBOAT7 | rs641738 | Alters phospholipid remodeling; increases MASH and fibrosis risk |
| HSD17B13 | Loss-of-function | Protective against MASH, fibrosis progression, and liver cancer |
7. Fibrosis - The Determinant of Prognosis
When lipotoxic injury is sustained, futile repair replaces normal hepatic regeneration:
- Dying hepatocytes release DAMPs (danger-associated molecular patterns)
- DAMPs activate hepatic stellate cells (HSCs), which transdifferentiate into myofibroblasts
- Activated HSCs deposit collagen in a characteristic pericellular "chicken-wire" pattern around zone 3 hepatocytes
- Progressive fibrosis stages: pericellular (F1) → bridging (F3) → cirrhosis (F4)
Fibrosis stage is the single strongest predictor of liver-related morbidity and mortality in MASLD.
Fibrosis progression rates (from paired biopsy meta-analyses):
- Simple steatosis alone: ~1 fibrosis stage per 14 years
- MASH: ~1 fibrosis stage per 7 years
- MASH + fibrosis ≥F2 = "at-risk MASH" - the threshold for intensified monitoring and treatment
8. Progression to HCC
HCC can arise in both cirrhotic and non-cirrhotic MASLD livers (unlike most other causes of cirrhosis). Key oncogenic drivers include:
- Chronic oxidative DNA damage from sustained lipotoxic stress
- NLRP3 inflammasome activation
- Malignant transformation during dysregulated hepatocyte regeneration
- Fibrosis creating a permissive pro-oncogenic microenvironment
- Annual HCC incidence in established MASLD cirrhosis: 1-2% per year
9. Histopathologic Spectrum
The four panels below illustrate the full histopathologic progression:
A. Normal liver | B. Simple steatosis (arrow = fatty hepatocyte) | C. MASH - ballooned hepatocyte (arrow) with blue pericellular fibrosis (arrowheads) | D. Cirrhosis with bridging blue-stained fibrosis encircling regenerative nodules
Key histologic features of MASH:
- Macrovesicular steatosis (>5% of hepatocytes)
- Hepatocyte ballooning - swollen, pale cells with loss of keratin 8/18 (marker of lipotoxic injury)
- Lobular inflammation - neutrophilic and mixed infiltrates
- Pericellular fibrosis in zone 3 (centrilobular) - the hallmark "chicken-wire" pattern
Note: Pediatric MASLD differs - shows more diffuse steatosis, portal rather than centrilobular fibrosis, and ballooned hepatocytes may be absent
Summary: Pathogenesis at a Glance
Energy excess + Physical inactivity
        ↓
Visceral adiposity + Insulin Resistance
        ↓
↑ FFA flux to liver + ↑ DNL + ↓ beta-oxidation + ↓ VLDL export
        ↓
Hepatocyte triglyceride accumulation → STEATOSIS (MASL)
        ↓
Dysregulated FA metabolism → toxic lipid intermediates
(+ Gut dysbiosis → LPS/TLR4 → Kupffer cell activation)
(+ Genetic risk: PNPLA3, TM6SF2)
        ↓
LIPOTOXICITY → ER stress + ROS + Inflammation
        ↓
Hepatocyte ballooning + Lobular inflammation = MASH
        ↓
DAMP release → Hepatic stellate cell activation
        ↓
Collagen deposition → FIBROSIS
        ↓
Bridging fibrosis → CIRRHOSIS → HCC / Decompensation
Sources: Harrison's Principles of Internal Medicine 22E (2025), Chapter 354 (Abdelmalek & Diehl) | Steinberg et al., J Hepatol 2025 - integrative metabolism in MASLD/MASH | Miller et al., Endocrinol Diabetes Metab 2025 - mechanisms and therapeutics
Explain in detail about the patho physiology of why the ST segment elevates and depresses during an MI
Reading File
Quick answer: ST elevation in MI results from ischemia-induced changes in the resting membrane potential and action potential of myocytes. Injured epicardial cells develop a more positive diastolic potential ("diastolic current of injury"), creating a voltage gradient that displaces the baseline and makes the ST segment appear elevated in overlying leads. ST depression reflects subendocardial ischemia - the same current flows in the opposite direction relative to the recording electrode. The underlying mechanism involves failure of the Na+/K+ ATPase and sarcolemmal ion channel dysfunction from ATP depletion.
Searching sources...
Finding Sources
Finding Sources
Excellent - found the key section in Harrison's 22E and Braunwald's Heart Disease. Let me read both simultaneously.
Reading File
Finding Sources
Finding Sources
Excellent content found. Now let me get the ECG images and look for deeper cellular/ionic mechanism content from Braunwald's and other sources.
Loading Image
Loading Image
Finding Sources
Finding Sources
I have excellent content. Let me now read two more specific sections - the detailed cellular ionic mechanism from Fuster & Hurst, and the ECG evolution from Rosen's Emergency Medicine, and also get the hyperacute T-wave image.
Reading File
Reading File
Reading File
I now have all the information needed for a comprehensive, deeply detailed answer. Let me also fetch the hyperacute T-wave ECG image from Rosen's.
Loading Image
Reading File
I now have comprehensive, authoritative content from multiple textbooks. I have all the information needed. Let me compose the full detailed answer.
Pathophysiology of ST Elevation and Depression in Myocardial Infarction
Understanding why the ST segment moves requires starting with normal cardiac electrophysiology, then tracing what ischemia does to it step by step.
1. Normal ST Segment Physiology
The ST segment on the ECG represents the period between the end of ventricular depolarization (end of QRS) and the beginning of repolarization (start of T wave). In the normal heart:
- During the plateau phase (Phase 2) of the cardiac action potential, all ventricular myocytes maintain an approximately equal membrane potential (~0 mV)
- Because there is no voltage difference between adjacent cells during this phase, no net current flows between them
- The result: the ST segment sits on the isoelectric baseline
The ECG is essentially a recording of voltage differences. When all cells are at the same voltage during Phase 2, the ECG records a flat line - the isoelectric ST segment.
2. How Ischemia Disrupts This: The Ionic Mechanism
When coronary blood flow is interrupted, the affected myocytes are rapidly deprived of oxygen and glucose. ATP depletion within minutes triggers a cascade of ionic disruptions:
Step-by-step ionic changes in ischemic myocytes:
| Event | Mechanism | Consequence |
|---|---|---|
| ATP depletion | Anaerobic glycolysis fails to maintain ATP levels | Na+/K+-ATPase fails |
| Na+/K+-ATPase failure | Cannot pump Na+ out / K+ in | Intracellular Na+ rises, K+ leaks out |
| Extracellular K+ accumulation | K+ efflux exceeds clearance | Partially depolarizes resting membrane potential |
| Intracellular Ca2+ overload | Na+/Ca2+ exchanger reverses direction as intracellular Na+ rises | Contractile dysfunction, cell injury |
| Acidosis | Lactate and CO2 accumulate | Further membrane dysfunction |
| ATP-sensitive K+ channels (IKATP) open | These channels are inhibited by normal intracellular ATP; open when ATP falls | Augmented outward K+ current shortens action potential duration |
Net result: The ischemic myocyte has a more positive (depolarized) resting membrane potential and a shorter action potential duration compared to adjacent normal cells.
Harrison's Principles of Internal Medicine 22E (2025), Ch. 247; Fuster & Hurst's The Heart, 15th Ed.; Goldman-Cecil Medicine
3. The "Current of Injury" - The Key Concept
The voltage difference created between normal and ischemic zones drives current to flow between them. This is the current of injury, and it is what manifests on the ECG as ST deviation.
There are two phases to consider:
During Diastole (TQ segment / baseline)
- Ischemic cells are partially depolarized (resting membrane potential less negative, e.g., -60 mV instead of normal -90 mV)
- Normal cells are fully polarized at -90 mV
- Current flows from the ischemic zone (positive) to the normal zone during electrical diastole
- This depresses the true baseline (TQ segment)
During Systole (ST segment)
- Normal cells undergo full action potential plateau (Phase 2, ~0 mV)
- Ischemic cells have shortened action potentials - they repolarize earlier than normal cells
- So during the time the normal cells are at full plateau (~0 mV), ischemic cells have already partially repolarized (more negative)
- Current now flows from normal cells (positive) toward ischemic cells (negative)
The ECG cannot distinguish which phase is responsible - it records the net effect. The apparent result on the ECG is what we call ST elevation or depression depending on the electrode position relative to the ischemia.
4. ST Elevation - Transmural (Epicardial) Ischemia
Mechanism:
When ischemia is transmural - involving the full thickness of the ventricular wall including the epicardium - the injury current vector is directed outward toward the epicardial surface.
- The ischemic, partially depolarized epicardial cells are electrically more positive during diastole
- Current flows outward from the ischemic epicardium
- Surface electrodes overlying the ischemic zone record this outward vector as ST elevation
Conceptually: the electrode sits "on top of" the injured muscle and sees positive charge directed toward it.
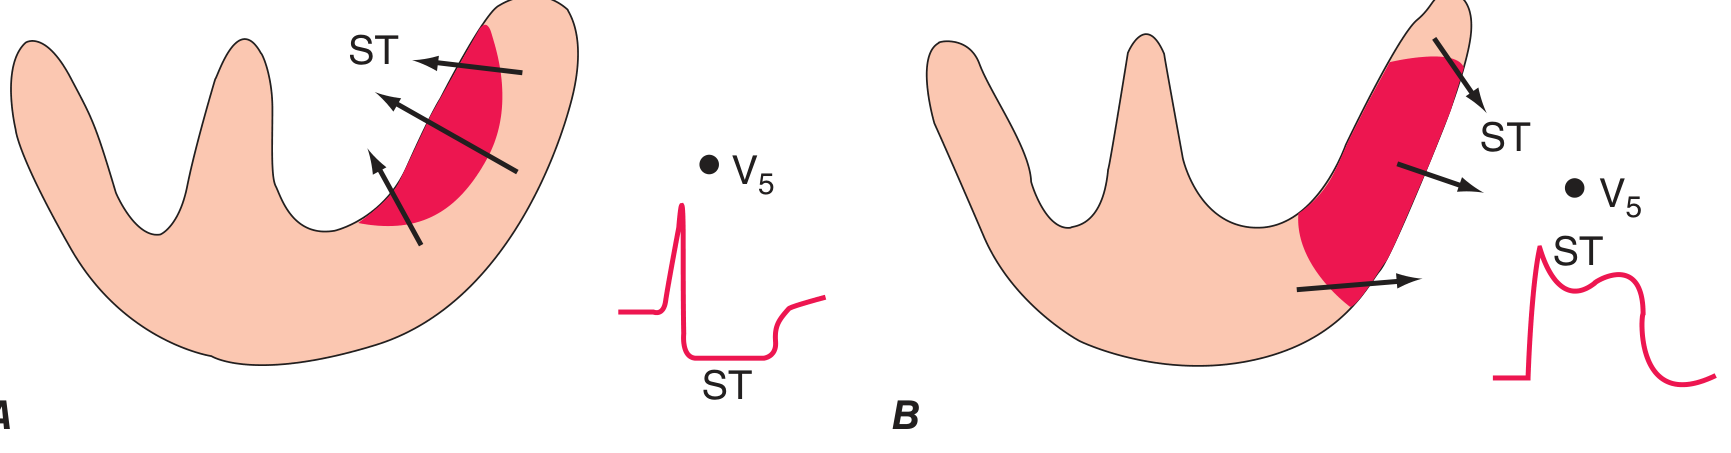
Figure 247-11 (Harrison's 22E): Panel A = subendocardial ischemia produces ST vector directed inward → ST depression in overlying leads. Panel B = transmural/epicardial ischemia produces ST vector directed outward → ST elevation in overlying leads.
ST elevation develops because:
- Full occlusion of a coronary artery (total blockage)
- All layers of myocardium are ischemic, but the epicardium is most affected
- The ST vector points outward (toward the surface electrode)
- Leads directly over the infarcting zone show ST elevation (STEMI)
5. ST Depression - Subendocardial Ischemia
Mechanism:
The subendocardium is the most metabolically demanding and least well-perfused layer of the heart (it receives blood last, at the end of diastole, and faces the highest wall stress). In partial coronary occlusion, demand ischemia (tachycardia, hypertension), or when collaterals are present, ischemia is predominantly subendocardial.
- The ischemic, partially depolarized cells are now at the inner (endocardial) layer
- The injury current vector is directed inward toward the ventricular cavity and subendocardium
- Surface electrodes overlying the ventricle (anterior precordial leads) look away from this inward vector
- They record ST depression
Simultaneously, lead aVR (which "looks at" the cavity from the right) records ST elevation - a useful confirmatory sign of global subendocardial ischemia or left main / proximal LAD occlusion.
Harrison's Principles of Internal Medicine 22E (2025), Ch. 247
6. The ECG Temporal Evolution in STEMI
The ECG changes in STEMI follow a predictable sequence as the infarct evolves:
Phase 1: Minutes (Hyperacute T Waves)
- The earliest ECG change in STEMI
- Appears within minutes of coronary occlusion
- Broad-based, tall, peaked T waves in the affected territory
- Mechanism: Acute ischemia initially shortens action potential duration, which briefly increases the T-wave gradient
- Often transient and easily missed before progressing
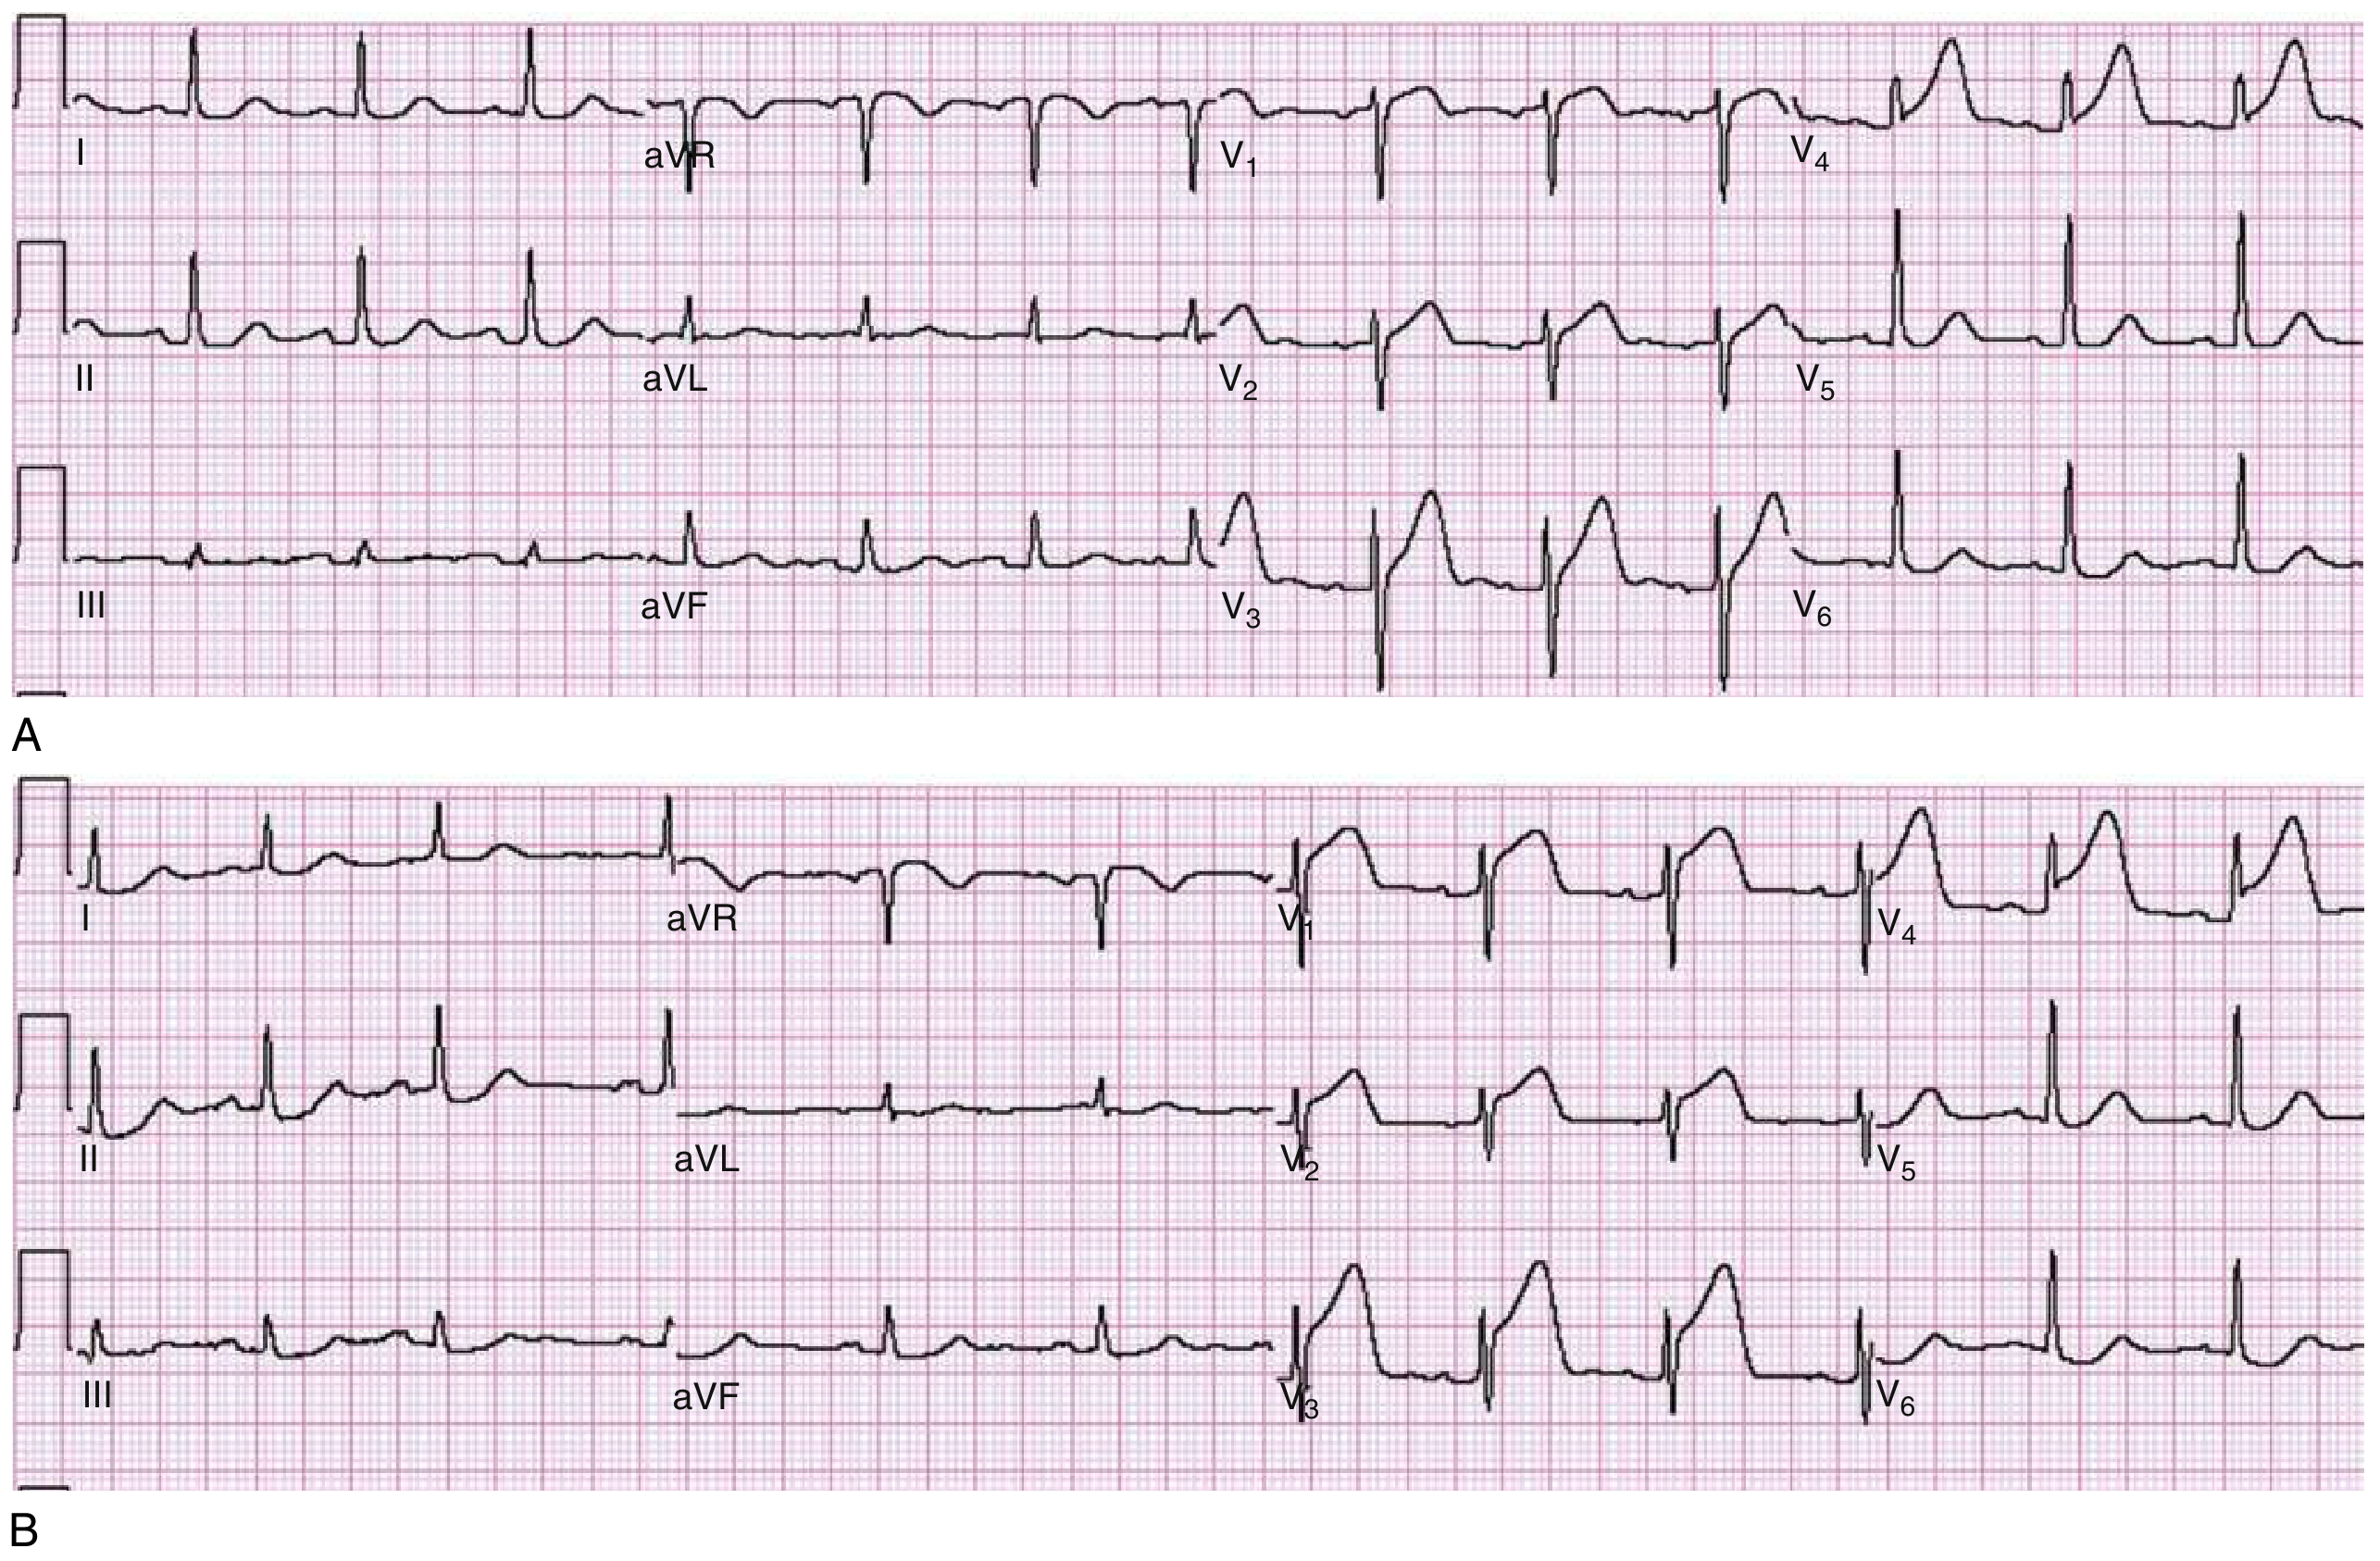
Rosen's Emergency Medicine, Fig. 64.1: Panel A shows hyperacute T waves in V3-V4. Panel B (same patient ~30 min later) shows frank ST elevation in V1-V4.
Phase 2: Minutes to Hours (ST Elevation)
- Current of injury fully established
- ST elevation in leads overlying the infarcted zone
- Morphology progresses: concave → flat → convex/domed → "tombstone" shape (more convex = more severe/extensive injury)
- Reciprocal ST depression appears in anatomically opposite leads (current of injury seen from the "back" side)
Phase 3: Hours (T Wave Inversion)
- As injured cells begin to die, the action potential duration difference normalizes
- Current of injury decreases, ST begins to return toward baseline
- T waves invert in infarcted leads - the repolarization sequence has been permanently reversed in the damaged zone
- Reflects post-ischemic repolarization abnormality
Phase 4: Hours to Days (Pathological Q Waves)
- Dead myocardium is electrically silent - it generates no depolarization signal
- The overlying electrode now "looks through" the scar and sees the electrical forces of the opposite wall moving away from it
- Result: a Q wave (initial negative deflection) in the leads overlying the infarct
- Pathological Q wave: ≥0.04 sec (1 mm wide) and ≥25% of the R wave height
7. Reciprocal ST Depression in STEMI
This is a separate, important phenomenon. When ST elevation occurs in one territory (e.g., inferior leads II, III, aVF in inferior MI), reciprocal ST depression appears in anatomically opposite leads (e.g., I, aVL). This has two explanations:
- Mirror image of the injury vector - the same ST current of injury, viewed from the opposite electrode perspective, produces a negative deflection
- True ischemia in the opposite territory - especially relevant in left main or proximal LAD occlusion
8. Summary: Why STEMI vs NSTEMI/UA?
| Feature | STEMI | NSTEMI / UA |
|---|---|---|
| Occlusion type | Total/complete | Partial/subtotal |
| Ischemia depth | Transmural | Subendocardial |
| ST vector direction | Outward (toward epicardium) | Inward (toward cavity) |
| Overlying leads | ST elevation | ST depression |
| aVR | ST depression (reciprocal) | ST elevation |
| Treatment implication | Emergency reperfusion mandatory | Risk-stratified management |
The division into STEMI and non-STEMI is clinically vital because emergency reperfusion therapy (PCI or thrombolysis) is proven to be consistently effective only in STEMI, where a completely occluded artery creates transmural injury demanding immediate restoration of flow.
Harrison's Principles of Internal Medicine 22E (2025), Ch. 247 (Goldberger, Bhatt, Goldberger); Rosen's Emergency Medicine, Ch. 64; Fuster & Hurst's The Heart 15th Ed., Ch. 37; Goldman-Cecil Medicine
This is a shared conversation. Sign in to Orris to start your own chat.