
Management of status epilepsy give flow chart
status epilepticus management flowchart algorithm
Summary : This figure presents a flowchart algorithm for the management of undiagnosed dyspepsia, guiding clinical decision-making based on H. pylori status and treatment response. flowchart: # Nodes : • Functional dyspepsia patient (rectangle) • H. pylori positive (branch label) • H. pylori negative (branch label) • H. pylori eradication (diamond) • PPI (diamond) • TCA (diamond) • Prokinetic (diamond) • Consider psychotherapy (diamond) • Success (ellipse) • Response (branch label) • No response / No Response (branch label) # Connectors : • From "Functional dyspepsia patient" splits into two branches: "H. pylori positive" leads to "H. pylori eradication"; "H. pylori negative" leads to "PPI". • "H. pylori eradication" has two branches: "Response" leads to "Success"; "No response" leads to "PPI". • "PPI" has two branches: "Response" leads to "Success"; "No response" leads to "TCA". • "TCA" has two branches: "Response" leads to "Success"; "No Response" leads to "Prokinetic". • "Prokinetic" has two branches: "Response" leads to "Success"; "No Response" leads to "Consider psychotherapy". • "Consider psychotherapy" does not branch further. # Layout : • The flowchart is arranged in a top-down manner, starting with the patient node at the top, splitting into two main branches based on H. pylori status, and proceeding through sequential treatment options with decision diamonds and response/no response branches. • All successful responses converge to the "Success" ellipse. # Analysis : • The algorithm prioritises H. pylori eradication for positive patients, and PPI therapy for negative patients. • If initial treatments fail, the flowchart guides escalation to TCA, then prokinetic agents, and finally psychotherapy. • The structure ensures that each treatment step is followed by an assessment of response, with successful outcomes leading to the "Success" node. • The flowchart is linear with no loops, and all pathways eventually terminate at "Success" or "Consider psychotherapy" for non-responders.
![Summary : This flowchart presents the management algorithm for nodal peripheral T-cell lymphoma (PTCL), including PTCL-NOS, TFHL, and ALCL subtypes, stratified by disease stage, ALK status, and risk features. It details systemic and non-systemic anticancer therapies, radiotherapy, and autologous stem-cell transplantation (ASCT) recommendations.
flowchart:
# Nodes :
• Nodal PTCL (start, top-level box)
• PTCL-NOS, TFHL (decision node)
• Stage I-II (decision node)
• 3-4 cycles CHO(E)P [IV, B] (treatment node)
• Consolidative ISRT [IV, B] (treatment node)
• CR (complete remission, outcome node)
• No further treatment (end node)
• Stage III-IV (decision node)
• 6 cycles CHO(E)P [II, B] (treatment node)
• CR (outcome node)
• ASCT [III, C] (treatment node)
• Stage I-II ALCL (decision node)
• ALK positive, non-bulky, IPI 0-1 / ALK negative, non-bulky, IPI 0-1 (decision node)
• 3-4 cycles BV-CHP [III, B] or CHOEP [III, B] (treatment node)
• Consolidative ISRT [IV, B] (treatment node)
• CR (outcome node)
• No further treatment (end node)
• ALK negative, bulky or IPI >1 / High-risk ALK positive (decision node)
• 6 cycles BV-CHP [II, A] or CHO(E)P [III, B] (treatment node)
• Consolidative ISRT [IV, B] (treatment node)
• CR (outcome node)
• ASCTa [II, B] (treatment node)
• Stage III-IV ALCL (decision node)
• ALK positive (decision node)
• 6 cycles BV-CHP [I, A] or CHO(E)P [III, B] (treatment node)
• CR (outcome node)
• No further treatment (end node)
• ALK negative / High-risk ALK positive (decision node)
• 6 cycles BV-CHP [I, A] or CHO(E)P [III, B] (treatment node)
• CR (outcome node)
• ASCT [II, B] (treatment node)
# Connectors :
• Top-down arrows connect each decision node to its respective treatment and outcome nodes.
• Branching occurs at each disease stage and ALK status, splitting into different treatment pathways.
• Some branches merge at common nodes (e.g., CR, ASCT, No further treatment).
• Footnotes (a, b) clarify alternative or additional recommendations for specific high-risk groups.
# Layout :
• The flowchart is organized horizontally by disease subtype and stage (PTCL-NOS/TFHL, Stage I-II ALCL, Stage III-IV ALCL).
• Each subtype/stage column flows vertically from initial diagnosis through treatment, remission, and post-remission management.
• Colour coding: purple for algorithm title, dark green for radiotherapy, blue for systemic therapy, white for non-treatment aspects.
# Analysis :
• The flowchart provides a clear, stepwise approach to managing nodal PTCL, emphasizing risk-adapted therapy.
• Early-stage disease often receives fewer cycles of chemotherapy and consolidative radiotherapy, with no further treatment if remission is achieved.
• Advanced-stage or high-risk disease typically receives more intensive therapy, with ASCT considered for consolidation.
• ALK status and IPI score are critical in determining the treatment pathway for ALCL.
• The algorithm highlights the importance of individualized therapy based on disease characteristics and response.](https://cdn.orris.care/cdss_images/GLGCA_4779772_1766687372936_663455a5-5e63-498d-91ab-79df6a901c83_25f47d00-8fbc-4616-843c-dcce91c28b25.png)
Summary : This flowchart presents the management algorithm for nodal peripheral T-cell lymphoma (PTCL), including PTCL-NOS, TFHL, and ALCL subtypes, stratified by disease stage, ALK status, and risk features. It details systemic and non-systemic anticancer therapies, radiotherapy, and autologous stem-cell transplantation (ASCT) recommendations. flowchart: # Nodes : • Nodal PTCL (start, top-level box) • PTCL-NOS, TFHL (decision node) • Stage I-II (decision node) • 3-4 cycles CHO(E)P [IV, B] (treatment node) • Consolidative ISRT [IV, B] (treatment node) • CR (complete remission, outcome node) • No further treatment (end node) • Stage III-IV (decision node) • 6 cycles CHO(E)P [II, B] (treatment node) • CR (outcome node) • ASCT [III, C] (treatment node) • Stage I-II ALCL (decision node) • ALK positive, non-bulky, IPI 0-1 / ALK negative, non-bulky, IPI 0-1 (decision node) • 3-4 cycles BV-CHP [III, B] or CHOEP [III, B] (treatment node) • Consolidative ISRT [IV, B] (treatment node) • CR (outcome node) • No further treatment (end node) • ALK negative, bulky or IPI >1 / High-risk ALK positive (decision node) • 6 cycles BV-CHP [II, A] or CHO(E)P [III, B] (treatment node) • Consolidative ISRT [IV, B] (treatment node) • CR (outcome node) • ASCTa [II, B] (treatment node) • Stage III-IV ALCL (decision node) • ALK positive (decision node) • 6 cycles BV-CHP [I, A] or CHO(E)P [III, B] (treatment node) • CR (outcome node) • No further treatment (end node) • ALK negative / High-risk ALK positive (decision node) • 6 cycles BV-CHP [I, A] or CHO(E)P [III, B] (treatment node) • CR (outcome node) • ASCT [II, B] (treatment node) # Connectors : • Top-down arrows connect each decision node to its respective treatment and outcome nodes. • Branching occurs at each disease stage and ALK status, splitting into different treatment pathways. • Some branches merge at common nodes (e.g., CR, ASCT, No further treatment). • Footnotes (a, b) clarify alternative or additional recommendations for specific high-risk groups. # Layout : • The flowchart is organized horizontally by disease subtype and stage (PTCL-NOS/TFHL, Stage I-II ALCL, Stage III-IV ALCL). • Each subtype/stage column flows vertically from initial diagnosis through treatment, remission, and post-remission management. • Colour coding: purple for algorithm title, dark green for radiotherapy, blue for systemic therapy, white for non-treatment aspects. # Analysis : • The flowchart provides a clear, stepwise approach to managing nodal PTCL, emphasizing risk-adapted therapy. • Early-stage disease often receives fewer cycles of chemotherapy and consolidative radiotherapy, with no further treatment if remission is achieved. • Advanced-stage or high-risk disease typically receives more intensive therapy, with ASCT considered for consolidation. • ALK status and IPI score are critical in determining the treatment pathway for ALCL. • The algorithm highlights the importance of individualized therapy based on disease characteristics and response.
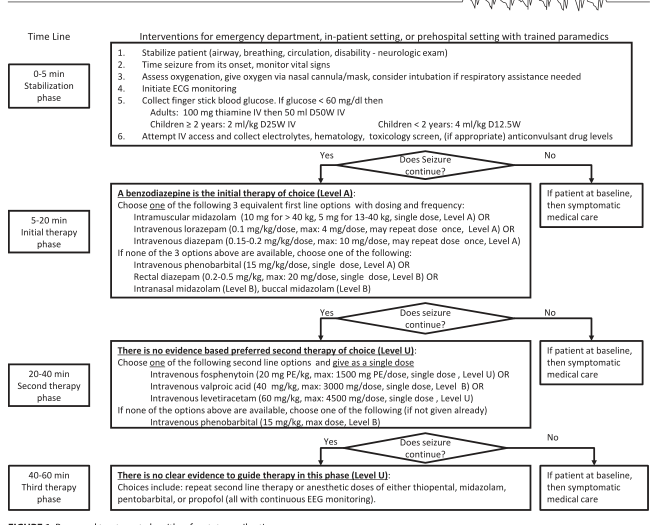
Summary : This flowchart outlines the stepwise interventions for managing status epilepticus in emergency, in-patient, or prehospital settings with trained paramedics, structured by time phases and decision points regarding seizure continuation. flowchart: # Time Phases : • 0-5 min Stabilization phase • 5-20 min Initial therapy phase • 20-40 min Second therapy phase • 40-60 min Third therapy phase # Nodes : • "Interventions for emergency department, in-patient setting, or prehospital setting with trained paramedics" (rectangle) – Steps: Stabilize patient, time seizure, assess oxygenation, initiate ECG, check glucose, attempt IV access, collect labs. • "Does Seizure continue?" (diamond) • "A benzodiazepine is the initial therapy of choice (Level A)" (rectangle) – Options: IM midazolam, IV lorazepam, IV diazepam, IV phenobarbital, rectal diazepam, intranasal/buccal midazolam. • "Does Seizure continue?" (diamond) • "There is no evidence based preferred second therapy of choice (Level U)" (rectangle) – Options: IV fosphenytoin, IV valproic acid, IV levetiracetam, IV phenobarbital. • "Does Seizure continue?" (diamond) • "There is no clear evidence to guide therapy in this phase (Level U)" (rectangle) – Options: repeat second line therapy or anesthetic doses of thiopental, midazolam, pentobarbital, or propofol. • "If patient at baseline, then symptomatic medical care" (rectangle) # Connectors : • Arrows connect each phase sequentially, with decision diamonds ("Does Seizure continue?") branching to either continue therapy (Yes) or provide symptomatic care (No). • Each therapy node lists medication options and dosing, with alternatives if first-line agents unavailable. • The flow is strictly linear with decision branches at each therapy phase. # Layout : • Vertically oriented timeline, with time phases as horizontal bands. • Each phase contains a rectangular node for interventions/therapy, followed by a diamond decision node. • "No" branches from decision nodes lead to "symptomatic medical care" nodes. • "Yes" branches continue to the next therapy phase. # Analysis : • The flowchart provides a clear, time-based escalation protocol for status epilepticus, emphasizing rapid stabilization, benzodiazepine first-line therapy, and sequential escalation to second and third-line agents if seizures persist. • Decision points ensure that therapy is only escalated if seizures continue, with fallback to symptomatic care if seizures resolve. • Medication options are listed with specific dosing and alternatives, reflecting evidence levels (A, B, U). • The structure supports rapid, protocol-driven decision-making in emergency settings.
![Summary : This flowchart provides a detailed management algorithm for metastatic unknown primary (UKP), genitourinary (GU) or head and neck (HN) neuroendocrine neoplasms (NENs), based on tumor grade, somatostatin receptor (SSTR) status, and other molecular features. It outlines systemic and non-systemic anticancer therapies, as well as clinical trial considerations.
flowchart:
# Nodes :
• Start (rectangle): "Metastatic UKP, GU/Gy or HN-NENa"
• Decision (rectangle): "Grade A: grading, SRI, TMB; Grade B: MGMT expression or promoter methylation"
• Branch 1 (rectangle): "NET G1-2 (Ki-67 <10%)b"
– SSTR positive (rectangle)
• "Watch and wait [IV, B]"
• "SSA [IV, B]"
• "Everolimus or antiangiogenic MKI [IV, B]"
• "PRRT [IV, B]"
– SSTR negative (rectangle)
• "Everolimus or antiangiogenic MKI [IV, B]"
• "PRRT [IV, B]"
• "Alkylating agent-basedb or oxaliplatin-based ChTb [IV, B]"
• Branch 2 (rectangle): "NET G2 (Ki-67 >10%) and G3b"
– "Everolimus or antiangiogenic MKI [IV, B]"
– "Alkylating agent-basedb or oxaliplatin-based ChTb [IV, B]"
– "PRRT if SSTR positive [IV, B]"
• Branch 3 (rectangle): "NEC"
– "Platinum-etoposide [IV, A] ± RT [IV, B]"
– "FOLFIRI or FOLFOX [IV, B]; Topotecan (for HN-NECs only) [IV, B]"
– "Anti-PD-1 or anti-PD-L1 immunotherapy if TMB high [III, B]"
– "Clinical trial: agnostic based on molecular profile or NEC specific [IV, B]"
# Connectors :
• Top-down flow from initial diagnosis to grade-based branches.
• Lateral branches for SSTR status (positive/negative) in NET G1-2.
• Sequential options within each branch, with arrows indicating possible progression or alternatives.
• NEC branch splits into multiple parallel therapy options.
# Layout :
• Three main vertical branches from the central decision node (NET G1-2, NET G2/G3, NEC).
• Each branch subdivides horizontally based on SSTR status or therapy options.
• Colour coding: purple for algorithm title, dark green for RT, blue for systemic therapies, turquoise for non-systemic or combination therapies, white for non-treatment aspects.
# Analysis :
• The flowchart provides a stepwise, grade- and receptor-based approach to managing metastatic NENs of unknown, GU, or HN origin.
• SSTR status is a key determinant for therapy selection in NET G1-2.
• Higher grade (G2/G3) and NECs prompt more aggressive systemic therapies, including platinum-based chemotherapy and immunotherapy.
• Clinical trial participation is recommended for NECs, especially with high TMB or specific molecular profiles.
• The algorithm emphasizes individualized therapy based on tumor biology and available molecular data.](https://cdn.orris.care/cdss_images/GLGCA_4543429_1766517377110_06738b17-9a04-430b-8140-1222bb7f2ff2_7becf6c8-f54a-4c1a-ae40-65faea5ed72e.png)
Summary : This flowchart provides a detailed management algorithm for metastatic unknown primary (UKP), genitourinary (GU) or head and neck (HN) neuroendocrine neoplasms (NENs), based on tumor grade, somatostatin receptor (SSTR) status, and other molecular features. It outlines systemic and non-systemic anticancer therapies, as well as clinical trial considerations. flowchart: # Nodes : • Start (rectangle): "Metastatic UKP, GU/Gy or HN-NENa" • Decision (rectangle): "Grade A: grading, SRI, TMB; Grade B: MGMT expression or promoter methylation" • Branch 1 (rectangle): "NET G1-2 (Ki-67 <10%)b" – SSTR positive (rectangle) • "Watch and wait [IV, B]" • "SSA [IV, B]" • "Everolimus or antiangiogenic MKI [IV, B]" • "PRRT [IV, B]" – SSTR negative (rectangle) • "Everolimus or antiangiogenic MKI [IV, B]" • "PRRT [IV, B]" • "Alkylating agent-basedb or oxaliplatin-based ChTb [IV, B]" • Branch 2 (rectangle): "NET G2 (Ki-67 >10%) and G3b" – "Everolimus or antiangiogenic MKI [IV, B]" – "Alkylating agent-basedb or oxaliplatin-based ChTb [IV, B]" – "PRRT if SSTR positive [IV, B]" • Branch 3 (rectangle): "NEC" – "Platinum-etoposide [IV, A] ± RT [IV, B]" – "FOLFIRI or FOLFOX [IV, B]; Topotecan (for HN-NECs only) [IV, B]" – "Anti-PD-1 or anti-PD-L1 immunotherapy if TMB high [III, B]" – "Clinical trial: agnostic based on molecular profile or NEC specific [IV, B]" # Connectors : • Top-down flow from initial diagnosis to grade-based branches. • Lateral branches for SSTR status (positive/negative) in NET G1-2. • Sequential options within each branch, with arrows indicating possible progression or alternatives. • NEC branch splits into multiple parallel therapy options. # Layout : • Three main vertical branches from the central decision node (NET G1-2, NET G2/G3, NEC). • Each branch subdivides horizontally based on SSTR status or therapy options. • Colour coding: purple for algorithm title, dark green for RT, blue for systemic therapies, turquoise for non-systemic or combination therapies, white for non-treatment aspects. # Analysis : • The flowchart provides a stepwise, grade- and receptor-based approach to managing metastatic NENs of unknown, GU, or HN origin. • SSTR status is a key determinant for therapy selection in NET G1-2. • Higher grade (G2/G3) and NECs prompt more aggressive systemic therapies, including platinum-based chemotherapy and immunotherapy. • Clinical trial participation is recommended for NECs, especially with high TMB or specific molecular profiles. • The algorithm emphasizes individualized therapy based on tumor biology and available molecular data.
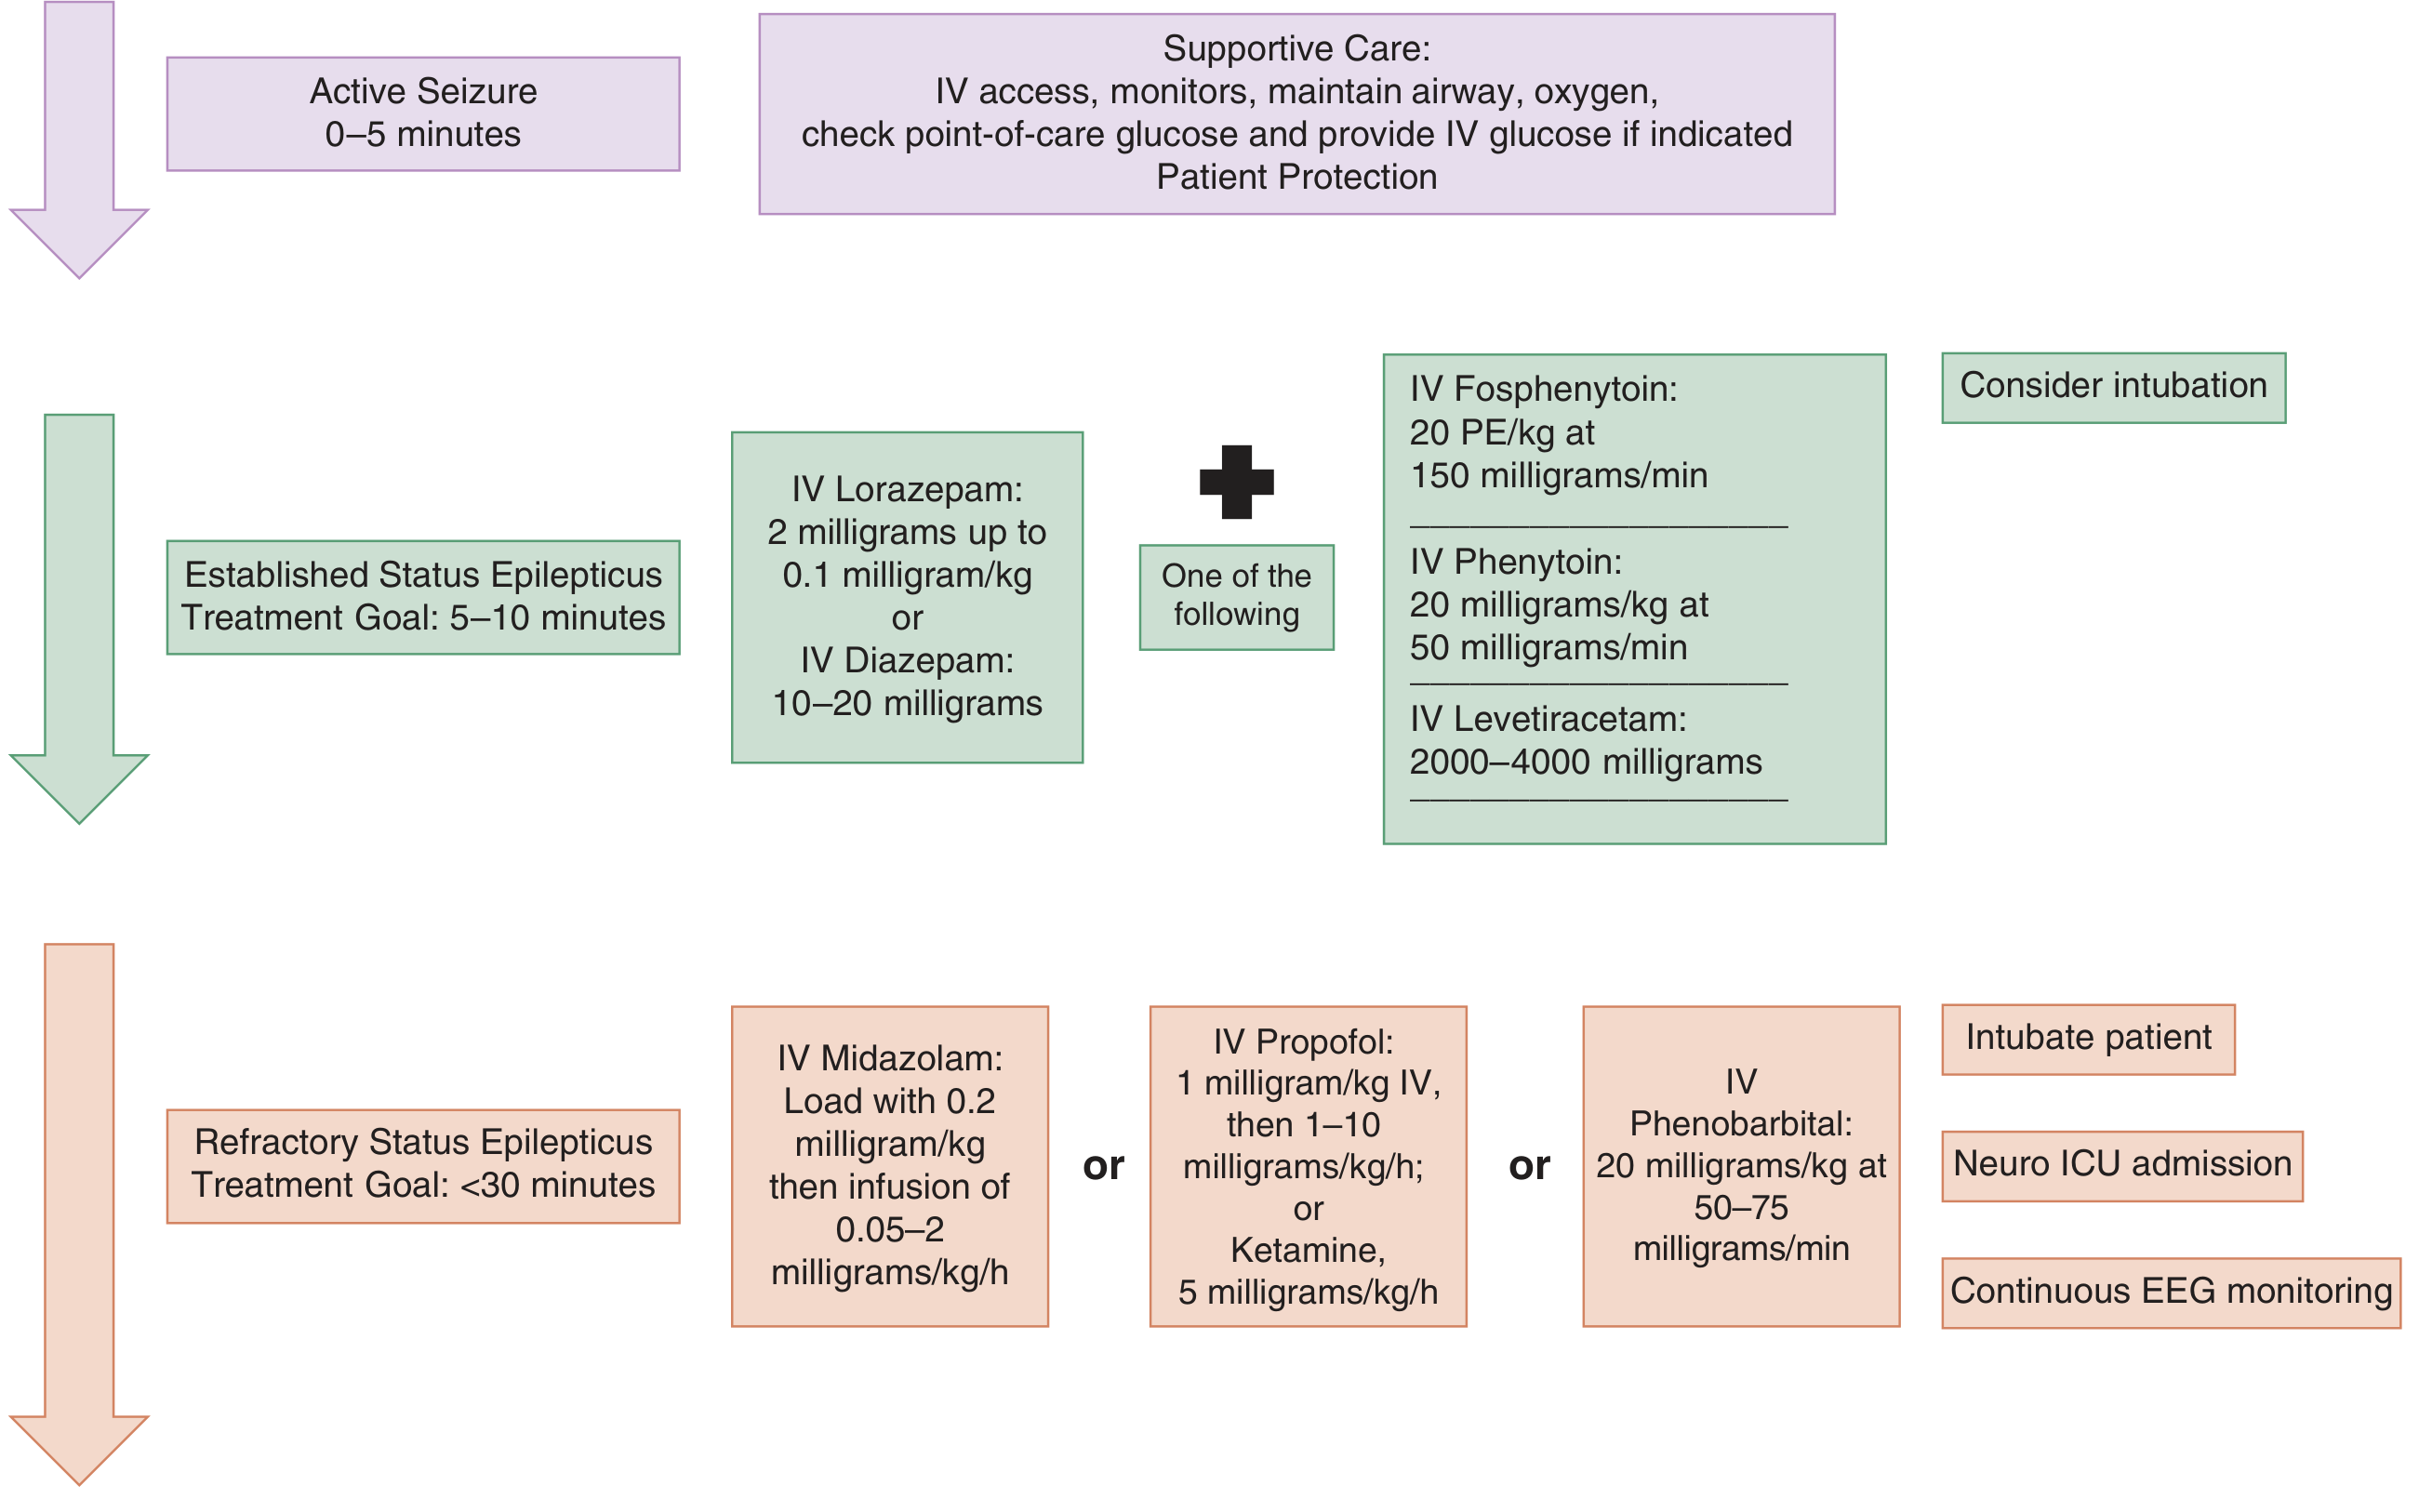
Management of Status Epilepticus
Flowchart 1 - Rosen's Emergency Medicine (Simple Overview)
Flowchart 2 - Tintinalli's Emergency Medicine (Detailed Time-Based Protocol)
Phase-by-Phase Breakdown
🕐 Phase 1: Stabilization (0-5 min)
- ABCs: Airway, breathing, circulation, neurologic exam
- Time the seizure from onset; monitor vital signs
- Oxygen via nasal cannula/mask; consider intubation if respiratory support needed
- Initiate ECG monitoring and continuous pulse oximetry
- Finger-stick blood glucose - if <60 mg/dL:
- Adults: Thiamine 100 mg IV, then 50 mL D50W IV
- Children ≥2 yrs: 2 mL/kg D25W | Children <2 yrs: 4 mL/kg D12.5W
- Establish IV/IO access; send labs (electrolytes, glucose, Ca, Mg, CBC, LFTs, AED levels, urine tox)
🕐 Phase 2: Initial Therapy (5-20 min) - Level A Evidence
| Route | Drug | Dose |
|---|---|---|
| IM | Midazolam | 10 mg (>40 kg); 5 mg (13-40 kg) - single dose |
| IV | Lorazepam | 0.1 mg/kg/dose, max 4 mg; may repeat once |
| IV | Diazepam | 0.15-0.2 mg/kg/dose, max 10 mg; may repeat once |
- Rectal diazepam: 0.2-0.5 mg/kg, max 20 mg
- Intranasal/buccal midazolam (Level B)
- IV Phenobarbital: 15 mg/kg, max dose (alternative)
🕐 Phase 3: Second Therapy (20-40 min) - Level U (no preferred agent)
| Drug | Dose | Notes |
|---|---|---|
| Fosphenytoin | 20 PE/kg IV, max 1500 PE; or phenytoin 20 mg/kg at 50 mg/min | Preferred over phenytoin (less cardiotoxic, can give IM) |
| Valproic acid | 40 mg/kg IV, max 3000 mg | Avoid in liver disease, thrombocytopenia, possible metabolic disease |
| Levetiracetam | 60 mg/kg IV, max 4500 mg | Fewest drug interactions; generally well tolerated |
| Phenobarbital | 15 mg/kg IV | If none of the above given |
🕐 Phase 4: Refractory Status Epilepticus (40-60+ min) - Level U
| Drug | Loading Dose | Infusion |
|---|---|---|
| Midazolam | 0.2 mg/kg IV | 0.05-2 mg/kg/h |
| Propofol | 1 mg/kg IV | 1-10 mg/kg/h |
| Ketamine | - | 5 mg/kg/h |
| Phenobarbital | 20 mg/kg at 50-75 mg/min | - |
| Thiopental | Anesthetic doses | All with continuous EEG |
Key Monitoring Points
- EEG: Order as soon as possible, mandatory after paralytics and in Refractory SE
- Labs to repeat: Glucose, electrolytes, ABG, AED levels
- Identify the cause: Subtherapeutic AED levels, stroke, CNS infection, metabolic derangement, alcohol withdrawal, anoxia - treat the underlying cause simultaneously
Common Causes to Treat Simultaneously
- Subtherapeutic antiepileptic drug levels
- Acute stroke or CNS infection (meningitis/encephalitis)
- Metabolic abnormalities (hypoglycemia, hyponatremia)
- Alcohol/drug withdrawal or intoxication
- Anoxia/hypoxia
- Trauma
Sources: Tintinalli's Emergency Medicine, p. 1199 | Rosen's Emergency Medicine, Ch. 169