
Difference between hypothyroidism and hyperthyroidism and normal ranges
hypothyroidism hyperthyroidism comparison thyroid
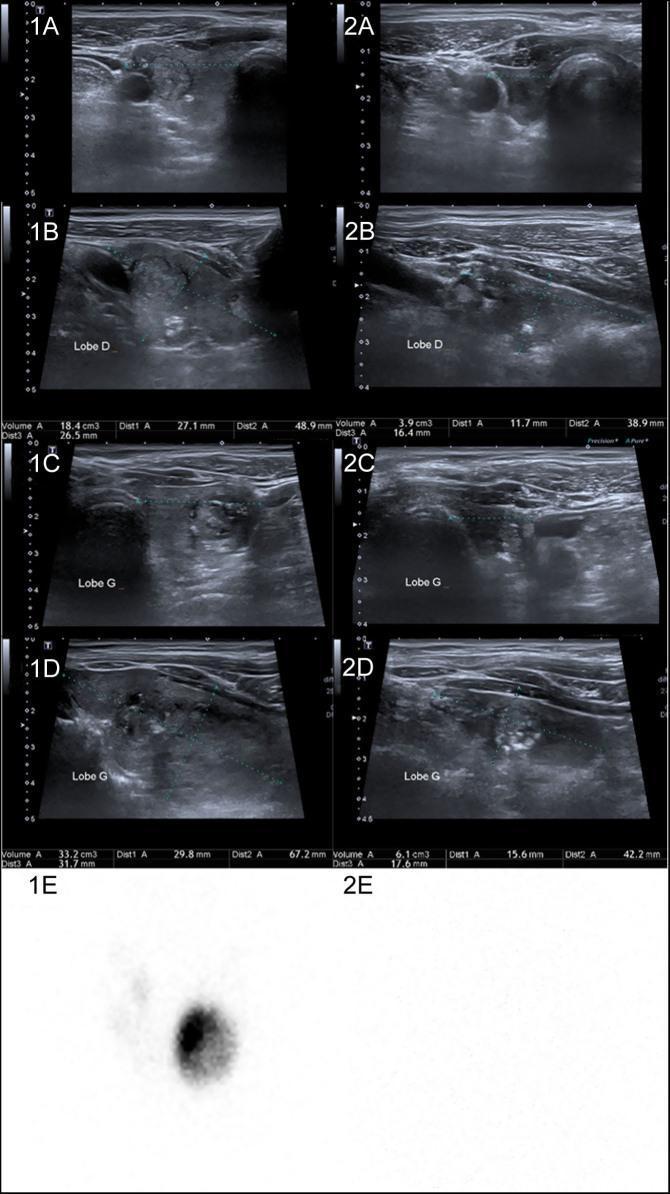
A comparison of thyroid ultrasound (US) and Iodine-123 (123I) scintigraphy before and after immune checkpoint inhibitor (ICI) therapy for melanoma. The pre-therapy images (1a–1d) show a multinodular goiter (MNG) with a right lobe volume of 18.4 mL containing three nodules and a left lobe volume of 33.2 mL with two nodules. Scintigraphy (1e) indicates a hyperfunctioning 'hot' nodule in the left lobe with suppressed uptake in the surrounding parenchyma. Post-therapy images (2a–2d), taken 7 months after ICI initiation, demonstrate significant thyroid atrophy: the right lobe volume decreased to 3.9 mL (nodules disappeared, leaving a macrocalcification) and the left lobe to 6.1 mL (one remaining reduced-size nodule). Follow-up scintigraphy (2e) shows a complete absence of 123I uptake. This visual progression illustrates ICI-induced destructive thyroiditis leading to marked parenchymal atrophy, regression of pre-existing nodules, and evolution from hyperthyroidism to hypothyroidism.
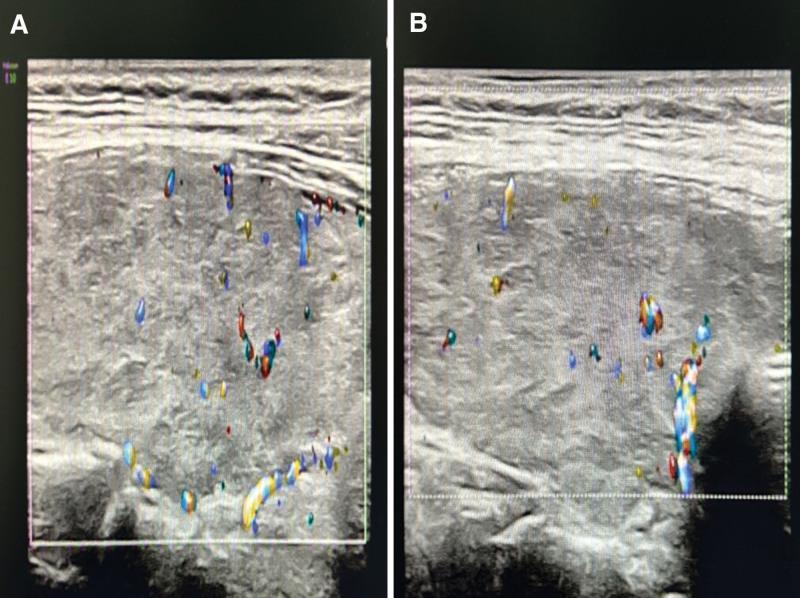
This diagnostic comparison contains two color Doppler ultrasound images (A and B) of the thyroid gland, illustrating the progression of thyroiditis or hyperthyroidism. Image A displays the thyroid parenchyma during the initial presentation, characterized by heterogeneous, coarse echogenicity with a mixture of hyperechoic and hypoechoic textures. A significant increase in vascularity is evident through numerous red and blue Doppler signals distributed throughout the gland, representing hyperdynamic blood flow. Image B shows the same anatomical region at a one-month follow-up. While the parenchyma remains somewhat heterogeneous, there is a marked interval reduction in the density and intensity of the color Doppler signals, indicating decreased thyroid vascularity and clinical improvement. This visual comparison serves to demonstrate the sonographic hallmarks of hyperthyroid states, such as Graves' disease or the thyrotoxic phase of thyroiditis, and the subsequent resolution of hypervascularity following treatment.
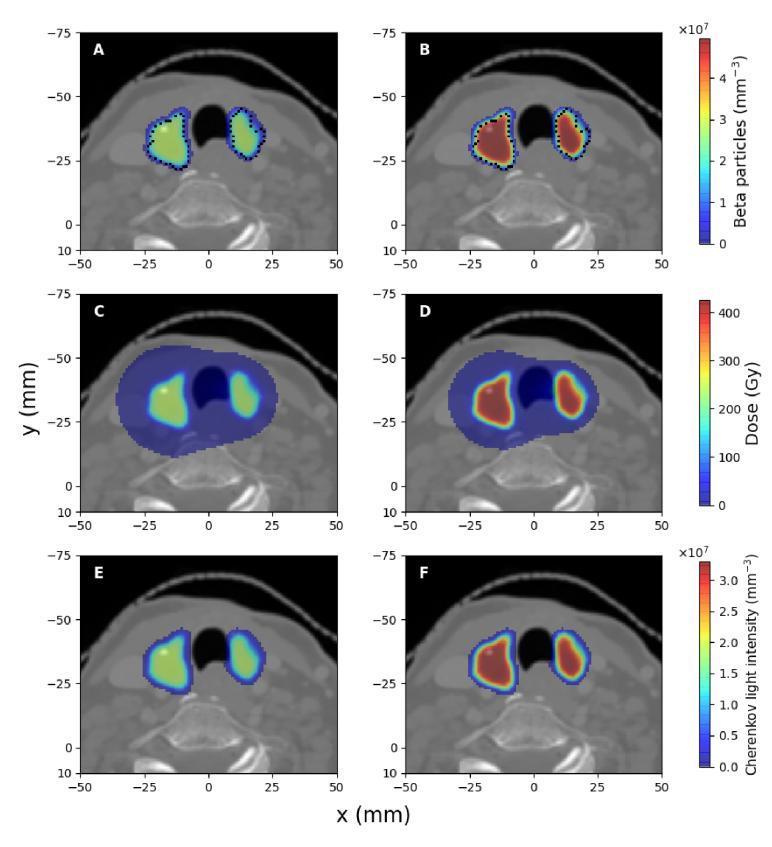
A comparison chart of clinical diagnostic images illustrating the spatial distribution of I-131 radioactive decay products in hyperthyroidism treatment. The images are displayed in a trans-axial plane (z=-50.6 mm) and organized into two columns representing administered activities of 400 MBq (left) and 700 MBq (right). Row 1 (A, B) shows beta particle concentration ($mm^{-3}$), with high intensity localized strictly within the bilateral thyroid lobes, demarcated by dotted contours. Row 2 (C, D) depicts the absorbed dose (Gy), demonstrating a broader spatial distribution that extends slightly beyond the thyroid lobes due to bremsstrahlung and gamma radiation. Row 3 (E, F) displays spectrally-integrated emitted Cherenkov light intensity ($mm^{-3}$), showing a localization pattern highly similar to beta particles but with distinct intensity scales. The 700 MBq group shows proportionally higher signal intensities across all parameters compared to the 400 MBq group. These simulations highlight the relationship between Cherenkov light emission and absorbed dose for molecular radiotherapy dosimetry.
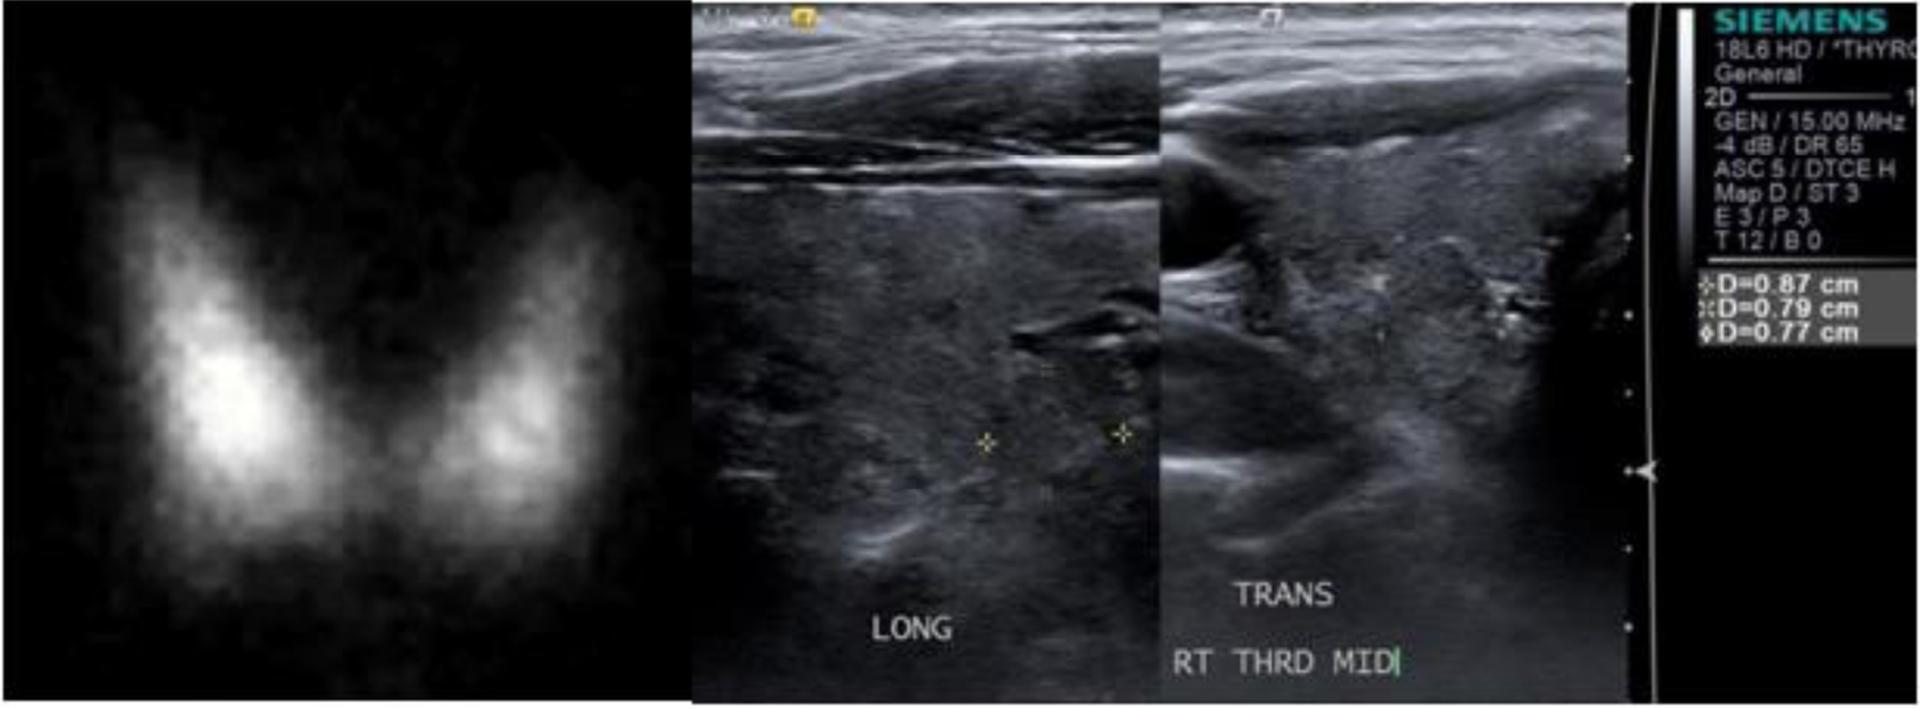
The image presents a dual-modality clinical comparison of the thyroid gland, featuring a nuclear medicine I-123 uptake scan and a grayscale ultrasound. On the left, the I-123 thyroid scan demonstrates diffusely increased radioactive tracer uptake across both the right and left lobes, with a prominent 'hot' nodule located in the right lower lobe showing focal hyper-accumulation. On the right, longitudinal (sagittal) and trans-axial (transverse) ultrasound views of the same patient correspond to the scintigraphic findings. The ultrasound images identify a heterogeneously solid nodule in the right lobe, demarcated by calipers with recorded dimensions of 0.87 cm x 0.79 cm x 0.77 cm. This composite illustrates a diagnostic workup for hyperthyroidism, comparing functional metabolic activity (scintigraphy) with anatomical structural morphology (ultrasound). The visual evidence is consistent with Marine-Lenhard syndrome or autonomous functioning thyroid nodules in the setting of iodine-induced thyrotoxicosis.
Hypothyroidism vs. Hyperthyroidism
The Core Concept
Normal Reference Ranges
| Test | Normal Range | Notes |
|---|---|---|
| TSH | 0.5 - 4.5 mIU/L | Lower in pregnancy (0.1-4.0 mIU/L); may rise slightly with age |
| Total T4 | 55 - 150 nmol/L | Includes bound + free fractions |
| Total T3 | 1.5 - 3.5 nmol/L | Often reflects peripheral metabolism |
| Free T4 | 12 - 28 pmol/L | The bioactive fraction; preferred over total T4 |
| Free T3 | 3 - 9 pmol/L | Useful to confirm early hyperthyroidism |
Side-by-Side Comparison
| Feature | Hypothyroidism | Hyperthyroidism |
|---|---|---|
| Basic defect | Too little thyroid hormone | Too much thyroid hormone |
| TSH | HIGH (pituitary compensates) | LOW (pituitary is suppressed) |
| T3 / T4 | Low (overt); normal (subclinical) | High (overt); normal (subclinical) |
Hypothyroidism
Common Causes
- Hashimoto's thyroiditis (autoimmune) - most common adult cause (~80% have anti-TPO antibodies)
- Treatment for hyperthyroidism (radioiodine, thyroidectomy)
- Iodine deficiency
- Drugs (amiodarone, lithium)
- Pituitary/hypothalamic dysfunction (<5% of cases)
Symptoms
Signs
- Bradycardia, hypothermia
- Dry, coarse skin; sparse hair; periorbital swelling
- Thickening of tongue, deepening/coarsening of voice
- Prolonged relaxation phase of deep tendon reflexes (characteristic)
- Myxedema (non-pitting swelling from glycosaminoglycan deposition)
Psychiatric features
Hyperthyroidism
Common Causes
- Graves' disease (TSH-receptor stimulating antibodies) - most common
- Toxic multinodular goiter
- Single toxic adenoma
- Thyroiditis (destructive release of stored hormones)
- Exogenous thyroid hormone excess
Symptoms
Signs
- Tachycardia, systolic hypertension, atrial fibrillation (especially in elderly)
- Fine resting tremor
- Exophthalmos/lid lag (Graves' disease specifically)
- Goiter (often with audible bruit in Graves')
- Warm, moist skin
- Hyperactive deep tendon reflexes
- Frightened stare (due to lid retraction)
In Graves' disease
Interpreting Thyroid Tests: Decision Framework
TSH HIGH + Low Free T4  → Overt Hypothyroidism
TSH HIGH + Normal Free T4 → Subclinical Hypothyroidism

TSH LOW + High T3/T4    → Overt Hyperthyroidism
TSH LOW + Normal T3/T4  → Subclinical Hyperthyroidism
Important: TSH alone cannot diagnose dysfunction if pituitary disease is suspected - you must also check free T4.
Key Memory Trick
| Hypothyroidism | Hyperthyroidism | |
|---|---|---|
| Metabolism | Slowed down | Speeded up |
| Weight | Gain | Loss |
| Heart rate | Slow (bradycardia) | Fast (tachycardia) |
| Temperature tolerance | Cold intolerance | Heat intolerance |
| Bowels | Constipation | Diarrhea |
| DTRs | Slow (prolonged relaxation) | Brisk/hyperactive |
| Mood | Depressed, sluggish | Anxious, irritable |
| Skin | Dry, cold, coarse | Warm, moist |
Treatment Overview
- Hypothyroidism: Levothyroxine (T4 replacement) - most common; desiccated thyroid extract or combined T4+T3 are alternatives
- Hyperthyroidism: Antithyroid drugs (methimazole, propylthiouracil), radioiodine (I-131), or thyroidectomy; beta-blockers for symptom control