
Skeleton system in human body explanation
human skeleton diagram labeled axial appendicular bones
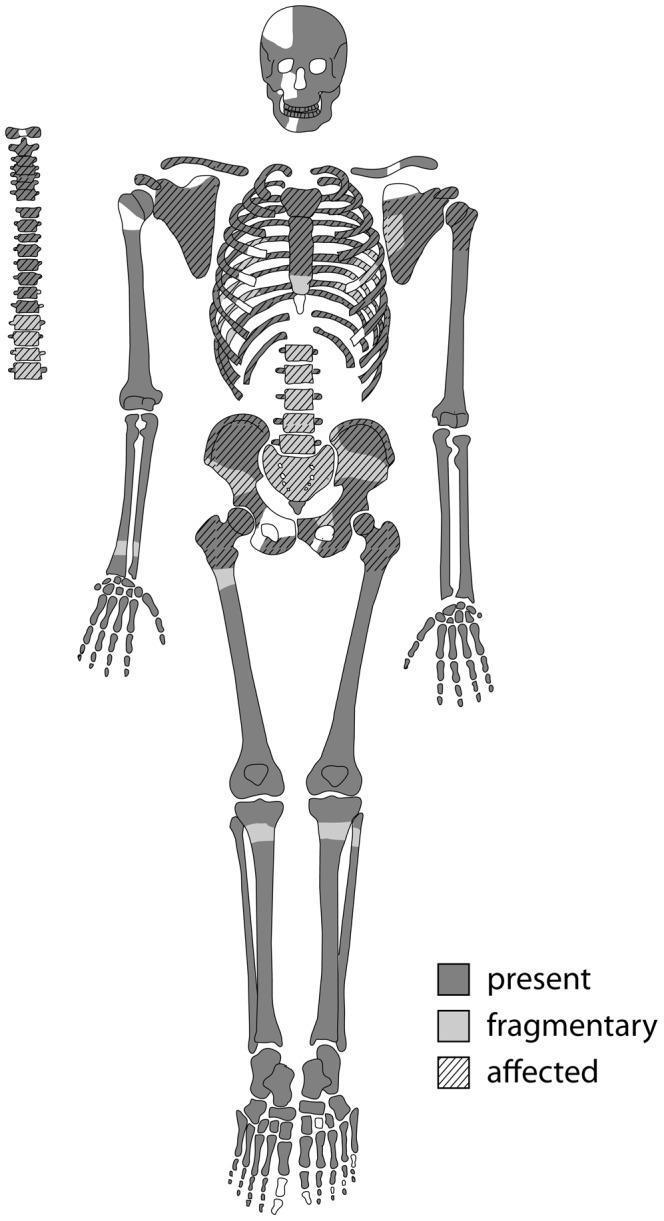
This anatomical diagram is a skeletal inventory and pathology map used in bioarchaeology and paleopathology to document the preservation and disease state of human remains (Skeleton Sk244-8). The graphic uses a standardized human skeletal template with a three-part coding system: dark gray indicates 'present' (full preservation), light gray indicates 'fragmentary' areas, and diagonal hatching denotes bones 'affected' by pathological changes. The map reveals that the axial skeleton—including the sternum, ribs, and most of the vertebral column—is heavily affected by lytic lesions. Both scapulae and the pelvic girdle (innominate bones and sacrum) also show significant involvement with hatching. The appendicular skeleton, specifically the long bones like the humeri, femora, and tibiae, is largely preserved but exhibits localized pathological involvement at the proximal joints. The skull shows a mix of full and fragmentary preservation. This visual summary is essential for illustrating the distribution of systemic skeletal diseases, such as metastatic carcinoma or multiple myeloma, in ancient populations.
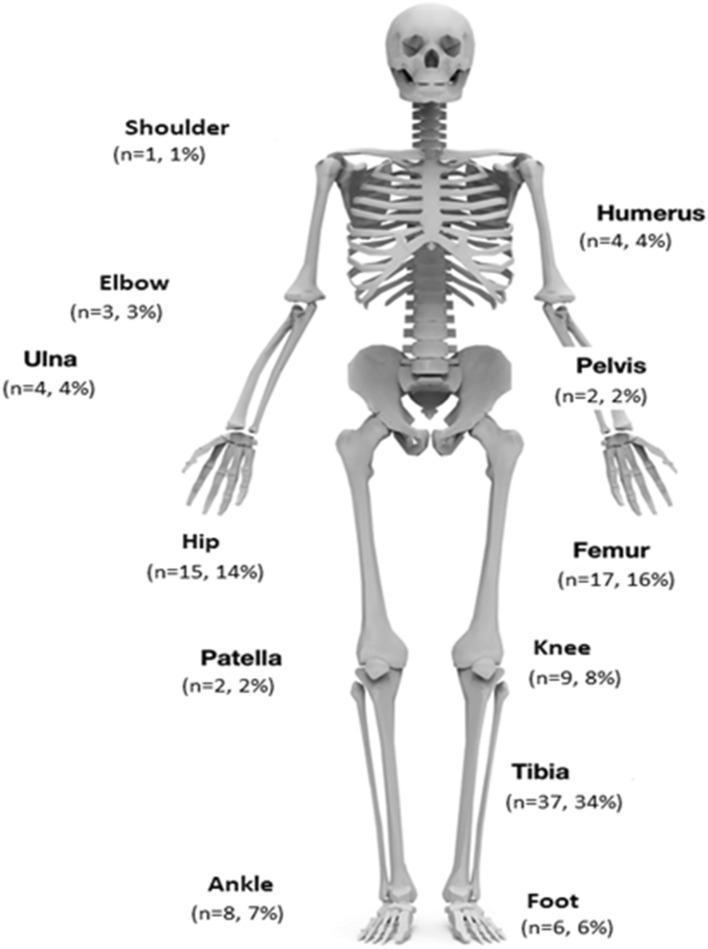
This infographic presents an anatomical diagram of the human skeleton used as a data visualization tool to map the distribution of orthopedic infections across various skeletal sites. The diagram provides quantitative data for 107 cases, labeling specific bones and joints with the number of patients (n) and the corresponding percentage of the total study population. Labeled anatomical regions include the upper extremity (shoulder, humerus, elbow, and ulna), the axial/pelvic region (pelvis), and the lower extremity (hip, femur, knee, patella, tibia, ankle, and foot). The visualization highlights the tibia as the most frequent site of infection (n=37, 34%), followed by the femur (n=17, 16%) and hip (n=15, 14%). This clinical illustration is designed for orthopedic and infectious disease education, effectively demonstrating the anatomical prevalence of conditions such as fracture-related infection (FRI), chronic osteomyelitis (COM), and prosthetic joint infection (PJI) within a clinical cohort.
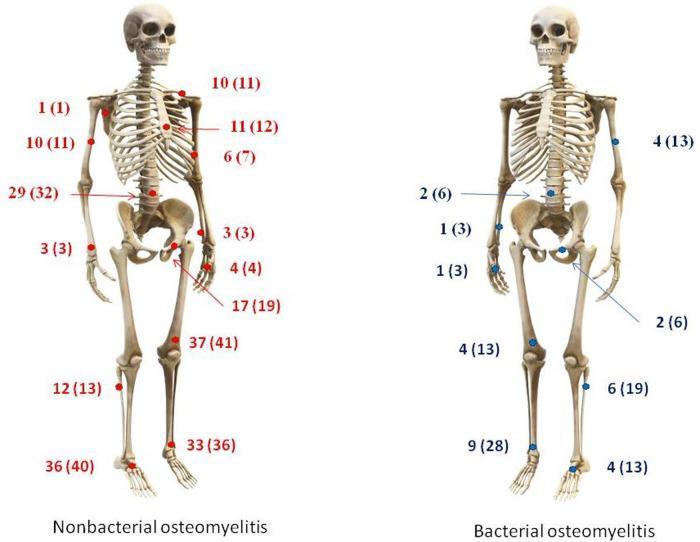
This Comparison Chart consists of two side-by-side anatomical diagrams of the human skeleton, illustrating the distribution and frequency of skeletal foci in nonbacterial osteomyelitis (NBO, left) and bacterial osteomyelitis (BO, right). Each diagram uses colored markers and numerical labels (n values and percentages) to indicate affected anatomical regions. The NBO diagram (red markers) demonstrates a multifocal, widespread distribution across both the axial and appendicular skeleton, with significant involvement of the clavicle, sternum, ribs, spine, femur, tibia, and foot bones. In contrast, the BO diagram (blue markers) displays a more localized or paucifocal pattern, primarily involving the spine, femur, tibia, and fibula, with notable absence of involvement in the clavicle and sternum. This visual comparison highlights key diagnostic differences between the two conditions, emphasizing that multifocality and involvement of the axial skeleton (beyond the spine) are highly suggestive of a nonbacterial etiology. The educational focus is on the clinical differentiation of pediatric bone infections and inflammatory disorders through skeletal mapping.
human skeleton anatomy anterior posterior view labeled
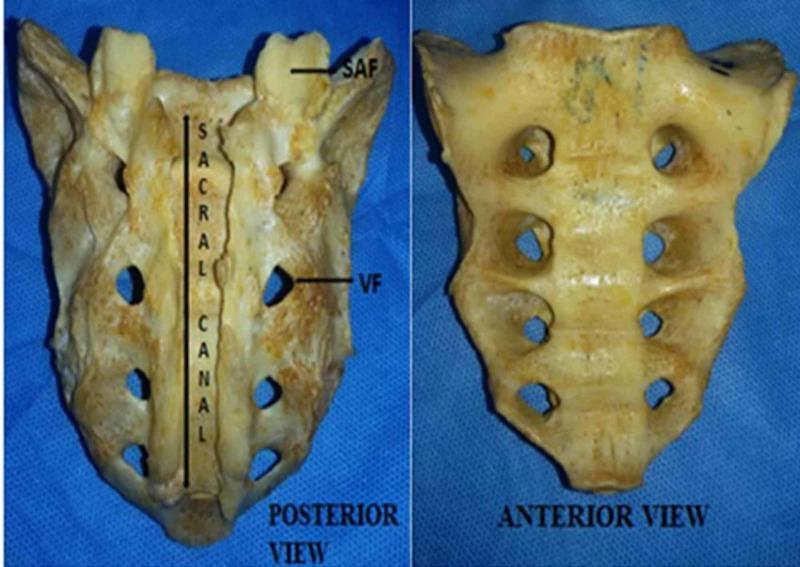
Clinical photograph of a dry human sacrum bone specimen, displaying both the posterior (dorsal) and anterior (ventral/pelvic) views side-by-side. The image highlights a significant anatomical variation: complete agenesis of the dorsal wall of the sacral canal, also known as spina bifida occulta or a total sacral hiatus. In the posterior view, the sacral canal is entirely exposed along its length due to the failure of the laminae to fuse in the midline. Key labeled structures include the Superior Articular Facets (SAF) at the cranial end and the Vertebral Foramina (VF) positioned laterally to the midline canal. The anterior view demonstrates normal anatomy with a smooth, concave pelvic surface and four pairs of symmetric anterior sacral foramina. This specimen serves as an educational example of developmental vertebral anomalies and anatomical variation in the axial skeleton, relevant to anatomy, radiology, and neurosurgery.
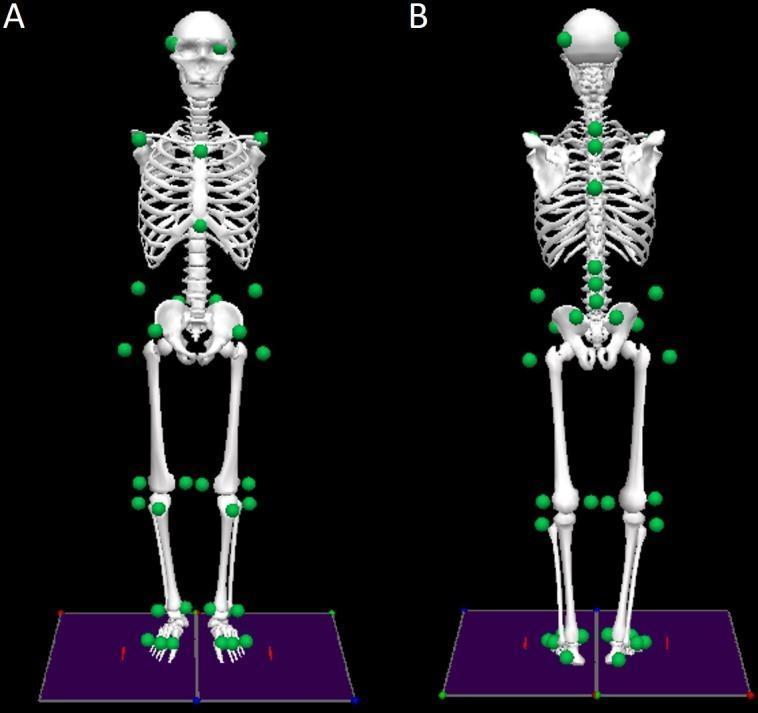
This medical illustration presents a 3D biomechanical model of the human skeleton, demonstrating a standardized 42-marker set for motion capture and gait analysis. The image is split into an anterior (front) view, labeled 'A', and a posterior (rear) view, labeled 'B'. In both views, the green dots represent reflective markers strategically placed on anatomical landmarks to track body segment kinematics. Key marker placements include the skull (temple and occipital regions), acromion processes of the shoulders, sternum, and several points along the spinal column in the posterior view. In the lower body, markers are positioned on the iliac crests, anterior and posterior superior iliac spines (ASIS and PSIS), lateral epicondyles of the femur (knees), and various points on the shins and feet (calcaneus and metatarsals). The skeleton is positioned on dual force platforms, indicated by the purple rectangular base, used for measuring center of pressure (COP) and balance. This model serves as an educational tool for understanding musculoskeletal alignment, kinesiology, and the digital representation of human movement in clinical and rehabilitative research.
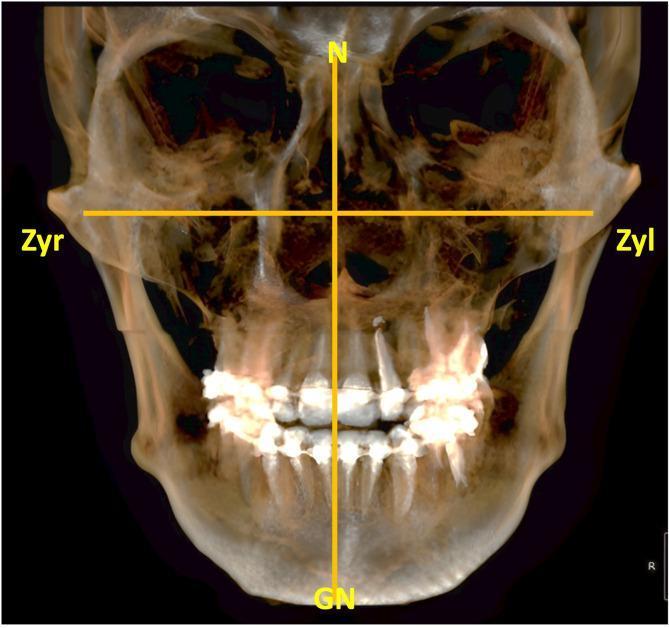
This diagnostic image is a 3D-reconstructed panfacial Cone Beam Computed Tomography (CBCT) scan showcasing the human facial skeleton in an anterior-posterior view. The semi-transparent volumetric rendering allows for the visualization of deep skeletal structures, including the maxilla, mandible, nasal cavity, and orbits. Superimposed on the anatomy are anthropometric measurements used to calculate the facial index. A vertical reference line is marked from the nasion (labeled 'N') to the gnathion (labeled 'GN'), representing morphological facial height. A horizontal reference line spans between the right zygion (labeled 'Zyr') and left zygion (labeled 'Zyl'), representing the bizygomatic breadth. The dentition is visible within the alveolar processes of the jaws, with some high-density areas suggesting dental restorations or artifacts. This image serves as an educational tool for dental and maxillofacial radiology, specifically demonstrating the application of craniofacial landmarks in anthropometric analysis and cephalometric classification (e.g., leptoprosopic or euryprosopic facial types).
bone structure cortical cancellous spongy compact cross section
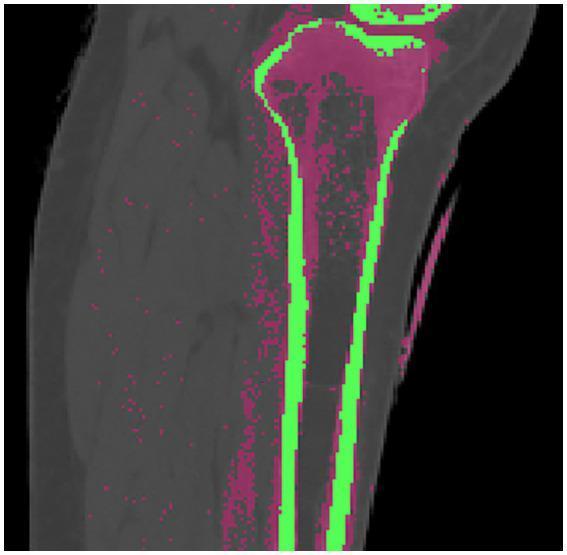
This diagnostic image is a color-coded 2D cross-section of a human leg, derived from CT imaging of the proximal tibia and fibula. The visualization uses threshold-based segmentation to distinguish between different bone compositions for orthopedic modeling. The cortical bone (compact bone) is highlighted in bright green, forming a thick, dense outer shell along the diaphysis and maintaining structural integrity. The cancellous bone (trabecular or spongy bone) is represented in rose pink, primarily concentrated within the proximal epiphysis and metaphysis. This distribution highlights the anatomical transition from the high-density load-bearing cortical shaft to the internal network of cancellous bone at the joints, which facilitates force distribution. This image serves as a foundational step for biomechanical finite element analysis, such as simulating tibial plateau fractures or assessing the impacts of osteoporosis on bone density and surgical fixation stability.
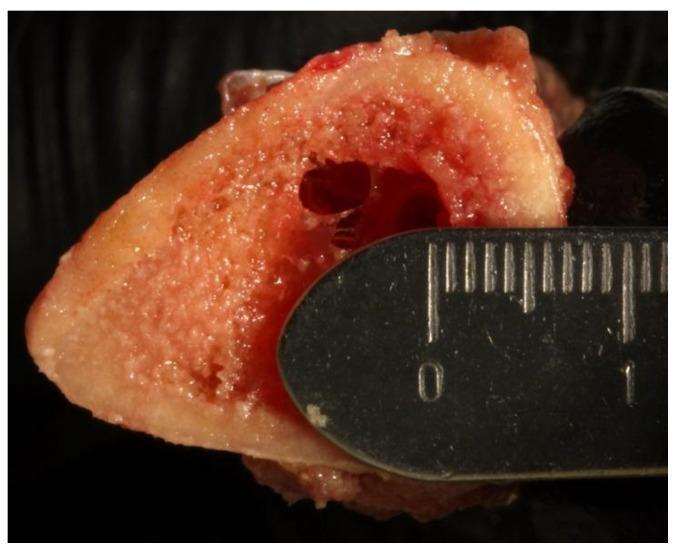
This clinical specimen photograph displays a cross-sectional view of a human tibial section, highlighting the distinctive architecture of long bones. The image demonstrates a clear differentiation between the peripheral cortical bone and the central cancellous (trabecular) bone. The outer cortical layer is dense, compact, and exhibits a smooth, yellowish-white appearance. In contrast, the internal cancellous region shows a porous, spongy texture with a characteristic reddish-pink hue, indicating the presence of marrow space and a complex trabecular network. A surgical osteotomy or prepared drill hole is visible within the medullary region. A metallic surgical ruler is positioned against the sectioned surface for scale, confirming a total thickness of approximately 6 mm, consisting of roughly 3 mm of cortical bone and 3 mm of cancellous bone. This visual is intended for orthopedic education and biomechanical research, specifically regarding the preparation of implant osteotomies and the evaluation of bone density and structural integrity in surgical sites.
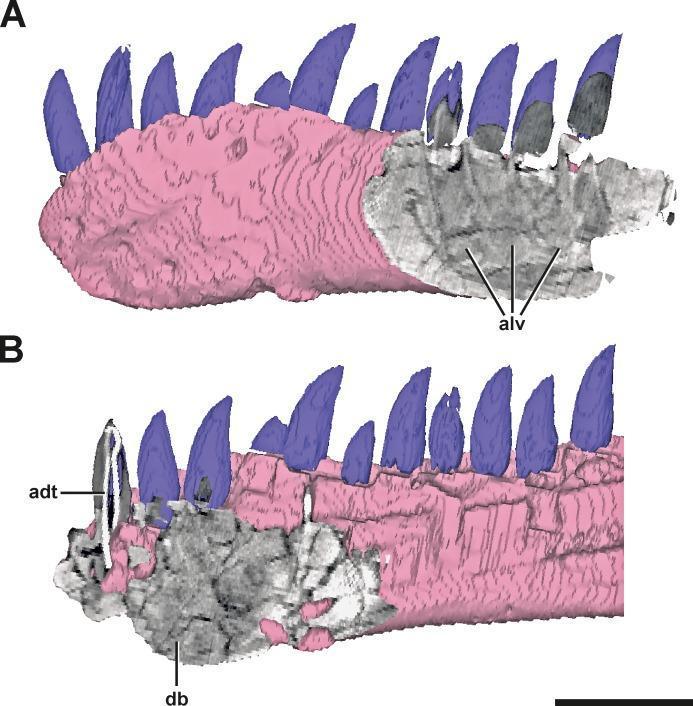
This diagnostic comparison uses a 3D surface model and CT cross-sections to analyze the dental anatomy and bone density of a mandibular structure (left dentary). Section A displays a lateral view of the posterior region, where the CT overlay reveals a cancellous, spongy bone architecture with distinct, repetitive indentations labeled as alveoli (alv). These deep pockets confirm the physiological sites for tooth implantation. Section B displays a mirrored medial view of the anterior region, demonstrating a marked contrast in bone morphology. In this area, the CT data shows a significantly denser, compact bone matrix (db) that lacks visible alveoli or structural indentations, indicating a non-tooth-bearing segment in this specific pathology or anatomical variant. An artificial dentary tooth (adt) with an internal wire is noted for reference. The image highlights the use of comparative imaging to differentiate between functional dental alveolar bone and dense, non-alveolar cortical bone, facilitating the study of mandibular structural integrity and potential dental abnormalities.
haversian system osteon compact bone microstructure osteocyte
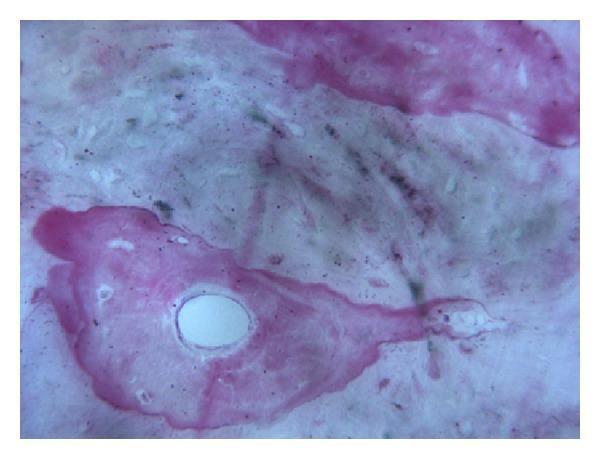
This histological diagnostic image, captured at 200x magnification, demonstrates the integration of grafted bone and newly formed bone tissue in a human mandibular model. The section is stained with acid fuchsin-toluidine blue, which highlights the structural components of the bone matrix. A prominent feature is an osteon, visible as a roughly circular, organized structure in the lower-left quadrant. This osteon exhibits a central, unstained Haversian canal surrounded by concentric lamellae and a more intensely pink-stained periphery (cement line). The surrounding regions show a mixture of intensely stained pink and purple areas representing high-affinity newly formed bone, contrasting with lighter, whitish or light-blue areas indicating mature or grafted bone matrix. The image illustrates the process of bone remodeling and osseointegration following a bone augmentation procedure, demonstrating the close contact between the graft material and the regenerated bone without interposing fibrous tissue. Small, dark dots represent osteocyte lacunae distributed throughout the matrix.
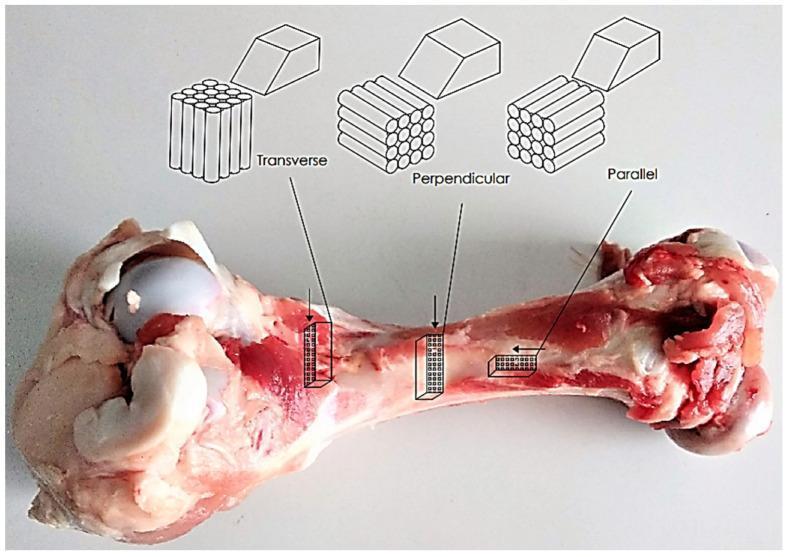
This composite educational material includes a clinical photograph of a long bone (femur) specimen integrated with three anatomical diagrams illustrating osteon orientation for biomechanical testing. The clinical photograph shows a gross specimen of cortical bone with three specific sampling sites indicated on the diaphysis. These sites correspond to three distinct cutting planes: Transverse, Perpendicular, and Parallel. Above the photograph, schematic diagrams represent the internal microstructure of cortical bone tissue, characterized by cylindrical osteons (Haversian systems). In the 'Transverse' orientation, the cutting plane is perpendicular to the longitudinal axis of the osteons, revealing circular cross-sections. In the 'Perpendicular' orientation, the osteons are shown at an angle relative to the cutting tool. In the 'Parallel' orientation, the cut is made along the longitudinal axis, exposing the elongated, cylindrical length of the osteons. This visual illustrates the anisotropic nature of bone tissue, highlighting how mechanical properties and surface topography differ based on the orientation of its primary structural units relative to external forces or processing tools.
The Human Skeletal System
Overview
- Axial skeleton - 80 bones (skull, vertebral column, ribs, sternum, and hyoid bone)
- Appendicular skeleton - 126 bones (bones of the upper and lower limbs, shoulder girdle, and pelvic girdle)
1. Axial Skeleton (80 Bones)
| Region | Bones |
|---|---|
| Skull / Cranium | 8 cranial + 14 facial bones |
| Vertebral Column | 7 cervical, 12 thoracic, 5 lumbar, 1 sacrum (5 fused), 1 coccyx (4 fused) = 26 |
| Thoracic Cage | 12 pairs of ribs + 1 sternum = 25 |
| Hyoid | 1 bone (U-shaped, in the neck) |
2. Appendicular Skeleton (126 Bones)
- Shoulder girdle: clavicle + scapula (2 each side)
- Arm: humerus
- Forearm: radius + ulna
- Wrist: 8 carpal bones
- Hand: 5 metacarpals + 14 phalanges
- Pelvic girdle: 2 hip bones (ilium, ischium, pubis fused = os coxa)
- Thigh: femur
- Leg: tibia + fibula + patella
- Ankle: 7 tarsal bones
- Foot: 5 metatarsals + 14 phalanges
3. Bone Tissue - Structure
Two Types of Bone Tissue
| Type | Description | Location |
|---|---|---|
| Compact (Cortical) | Dense outer shell; accounts for ~80% of skeletal mass | Diaphysis (shaft) of long bones |
| Spongy (Trabecular/Cancellous) | Honeycomb meshwork of trabeculae; highly vascular | Epiphyses, vertebrae, pelvis |
4. Bone Cells
| Cell | Origin | Function |
|---|---|---|
| Osteoblasts | Mesenchymal stem cells | Build bone - synthesize and secrete collagen and osteoid (unmineralized matrix); respond to PTH, vitamin D |
| Osteocytes | Derived from osteoblasts | Maintenance - become encased in lacunae; connected via canaliculi; sense mechanical load; regulate calcium homeostasis; secrete sclerostin |
| Osteoclasts | Hematopoietic stem cells (macrophage lineage) | Resorb bone - lie in Howship's lacunae; activated by RANKL, PTH, vitamin D; secrete acid hydrolases and neutral proteases |
5. Classification of Bones by Shape
-
Long bones - tubular; e.g., humerus, femur, metacarpals
-
Short bones - cuboidal; e.g., carpals (wrist), tarsals (ankle)
-
Flat bones - two compact layers with spongy bone between; e.g., skull, scapula
-
Irregular bones - varied shapes; e.g., vertebrae, facial bones, hyoid
-
Sesamoid bones - round/oval bones embedded in tendons; e.g., patella (largest sesamoid)
-
Gray's Anatomy for Students, p. 29
6. Joints (Articulations)
| Type | Tissue | Movement | Examples |
|---|---|---|---|
| Fibrous (Synarthroses) | Dense connective tissue | Minimal/none | Skull sutures, tooth sockets (gomphoses), distal tibiofibular joint |
| Cartilaginous (Amphiarthroses) | Hyaline cartilage or fibrocartilage | Limited | Costochondral joints, pubic symphysis, intervertebral discs, growth plates |
| Synovial (Diarthroses) | Synovial fluid + articular cartilage | Free movement | Hip, knee, shoulder, elbow, wrist |
7. Functions of the Skeletal System
- Support - Provides structural framework for the body and maintains posture
- Protection - Skull protects the brain; vertebral column protects the spinal cord; rib cage protects heart and lungs
- Movement - Bones act as levers on which muscles pull to produce locomotion
- Hematopoiesis - Red bone marrow in cancellous bone produces blood cells (RBCs, WBCs, platelets)
- Mineral reservoir - Contains 99% of total body calcium and stores phosphate; releases minerals for serum homeostasis and acid-base balance
- Growth factor reservoir - Bone matrix stores growth factors and cytokines that regulate local and systemic processes
- Energy storage - Yellow bone marrow (in medullary cavity of long bones) stores fat/lipids
- Imaging Anatomy, Vol. 3; Gray's Anatomy for Students
8. Cartilage
| Type | Composition | Location |
|---|---|---|
| Hyaline | Moderate collagen; most common | Articular surfaces, costal cartilages, trachea |
| Elastic | Collagen + abundant elastic fibers | External ear (pinna), epiglottis |
| Fibrocartilage | Dense collagen; few cells | Intervertebral discs, pubic symphysis, menisci |
9. Bone Remodeling
- Repairs microdamage and fractures
- Adapts bone architecture to changing mechanical demands
- Maintains serum calcium and phosphate homeostasis
10. Ossification (Bone Formation)
- Intramembranous ossification - Direct deposition of bone in a fibrous membrane without a cartilage precursor (e.g., flat bones of the skull, clavicle)
- Endochondral ossification - Bone replaces a cartilage model; used for most bones. Begins at primary ossification centers in the diaphysis (most present at birth), then secondary ossification centers appear at the epiphyses (important for longitudinal growth)
| Feature | Detail |
|---|---|
| Total bones (adult) | 206 |
| Axial skeleton | 80 bones |
| Appendicular skeleton | 126 bones |
| Largest bone | Femur |
| Smallest bone | Stapes (middle ear) |
| Bone composition | 80% cortical, 20% cancellous |
| Calcium storage | 99% of total body calcium |
| Hematopoietic site | Red bone marrow (cancellous bone) |