I now have enough material from Park's to write comprehensive answers for all questions. Let me compile everything.---
Community Medicine - Complete Exam Answers
Source: Park's Textbook of Preventive and Social Medicine (unless otherwise noted)
GROUP A - LAQ (15 Marks)
Q1. Define Census. List its uses in public health. Explain the significance of population pyramids. (3+8+4)
DEFINITION OF CENSUS (3 marks)
The United Nations defines a census as "the total process of collecting, compiling and publishing demographic, economic and social data pertaining at a specified time or times, to all persons in a country or delimited territory."
A census is a massive undertaking to contact every member of the population in a given time and collect a variety of information. It is taken in most countries at regular intervals, usually of 10 years. In India, the first regular census was taken in 1881, with subsequent ones at 10-year intervals. The legal basis of the census in India is provided by the Census Act of 1948. The supreme officer who directs and operates the census is the Census Commissioner for India. The last census was held in March 2011.
Key characteristics:
- Complete enumeration (not a sample - covers all persons)
- Simultaneously conducted across the entire territory
- Periodicity - usually decennial (every 10 years)
- Universality - covers every individual within the defined territory
USES OF CENSUS IN PUBLIC HEALTH (8 marks)
1. Denominators for Health Rates
The most fundamental use: census data provides denominators for computing vital statistical rates - birth rates, death rates, infant mortality rate, maternal mortality rate, disease-specific rates, and other health indicators. Without census data, it is not possible to obtain quantified health, demographic, and socio-economic indicators.
2. Age and Sex Distribution
Census provides the age-sex structure of the population - essential for:
- Planning age-specific health services (immunization, antenatal care, geriatric services)
- Computing age-specific mortality and fertility rates
- Projecting future health needs
3. Estimation of Disease Burden
By knowing the total population and its subgroups, health planners can estimate absolute numbers of disease cases, maternal deaths, vaccine-preventable illnesses, etc.
4. Health Manpower Planning
Data on population size, geographic distribution, and economic status guides decisions on:
- Number of doctors, nurses, paramedics required
- Location of PHCs, CHCs, sub-centers
- Bed-population ratios
5. Planning Preventive and Promotive Services
Census data on literacy, occupation, housing, drinking water, sanitation, and fuel type helps identify vulnerable groups and plan targeted interventions (e.g., malnutrition in illiterate rural households).
6. Maternal and Child Health Planning
Census provides the number of women in reproductive age group, and children under 5, enabling MCH services to be adequately resourced.
7. National Health Programme Implementation
Data on population subgroups (scheduled tribes, urban slums, migrant workers) drives program targeting for RNTCP, NVBDCP, NRHM/NHM, etc.
8. Baseline and Benchmark Data
Census data serves as a frame of reference and baseline for planning, action, and research - not only in medicine but in the entire governmental system. Progress against health goals (SDGs, National Health Policy targets) is measured against census baselines.
Additional uses:
- Urban-rural distribution for resource allocation
- Economic characteristics (Below Poverty Line population) for identifying health inequality
- Data on disability for rehabilitation planning
- Input for constructing life tables (projecting survival)
SIGNIFICANCE OF POPULATION PYRAMIDS (4 marks)
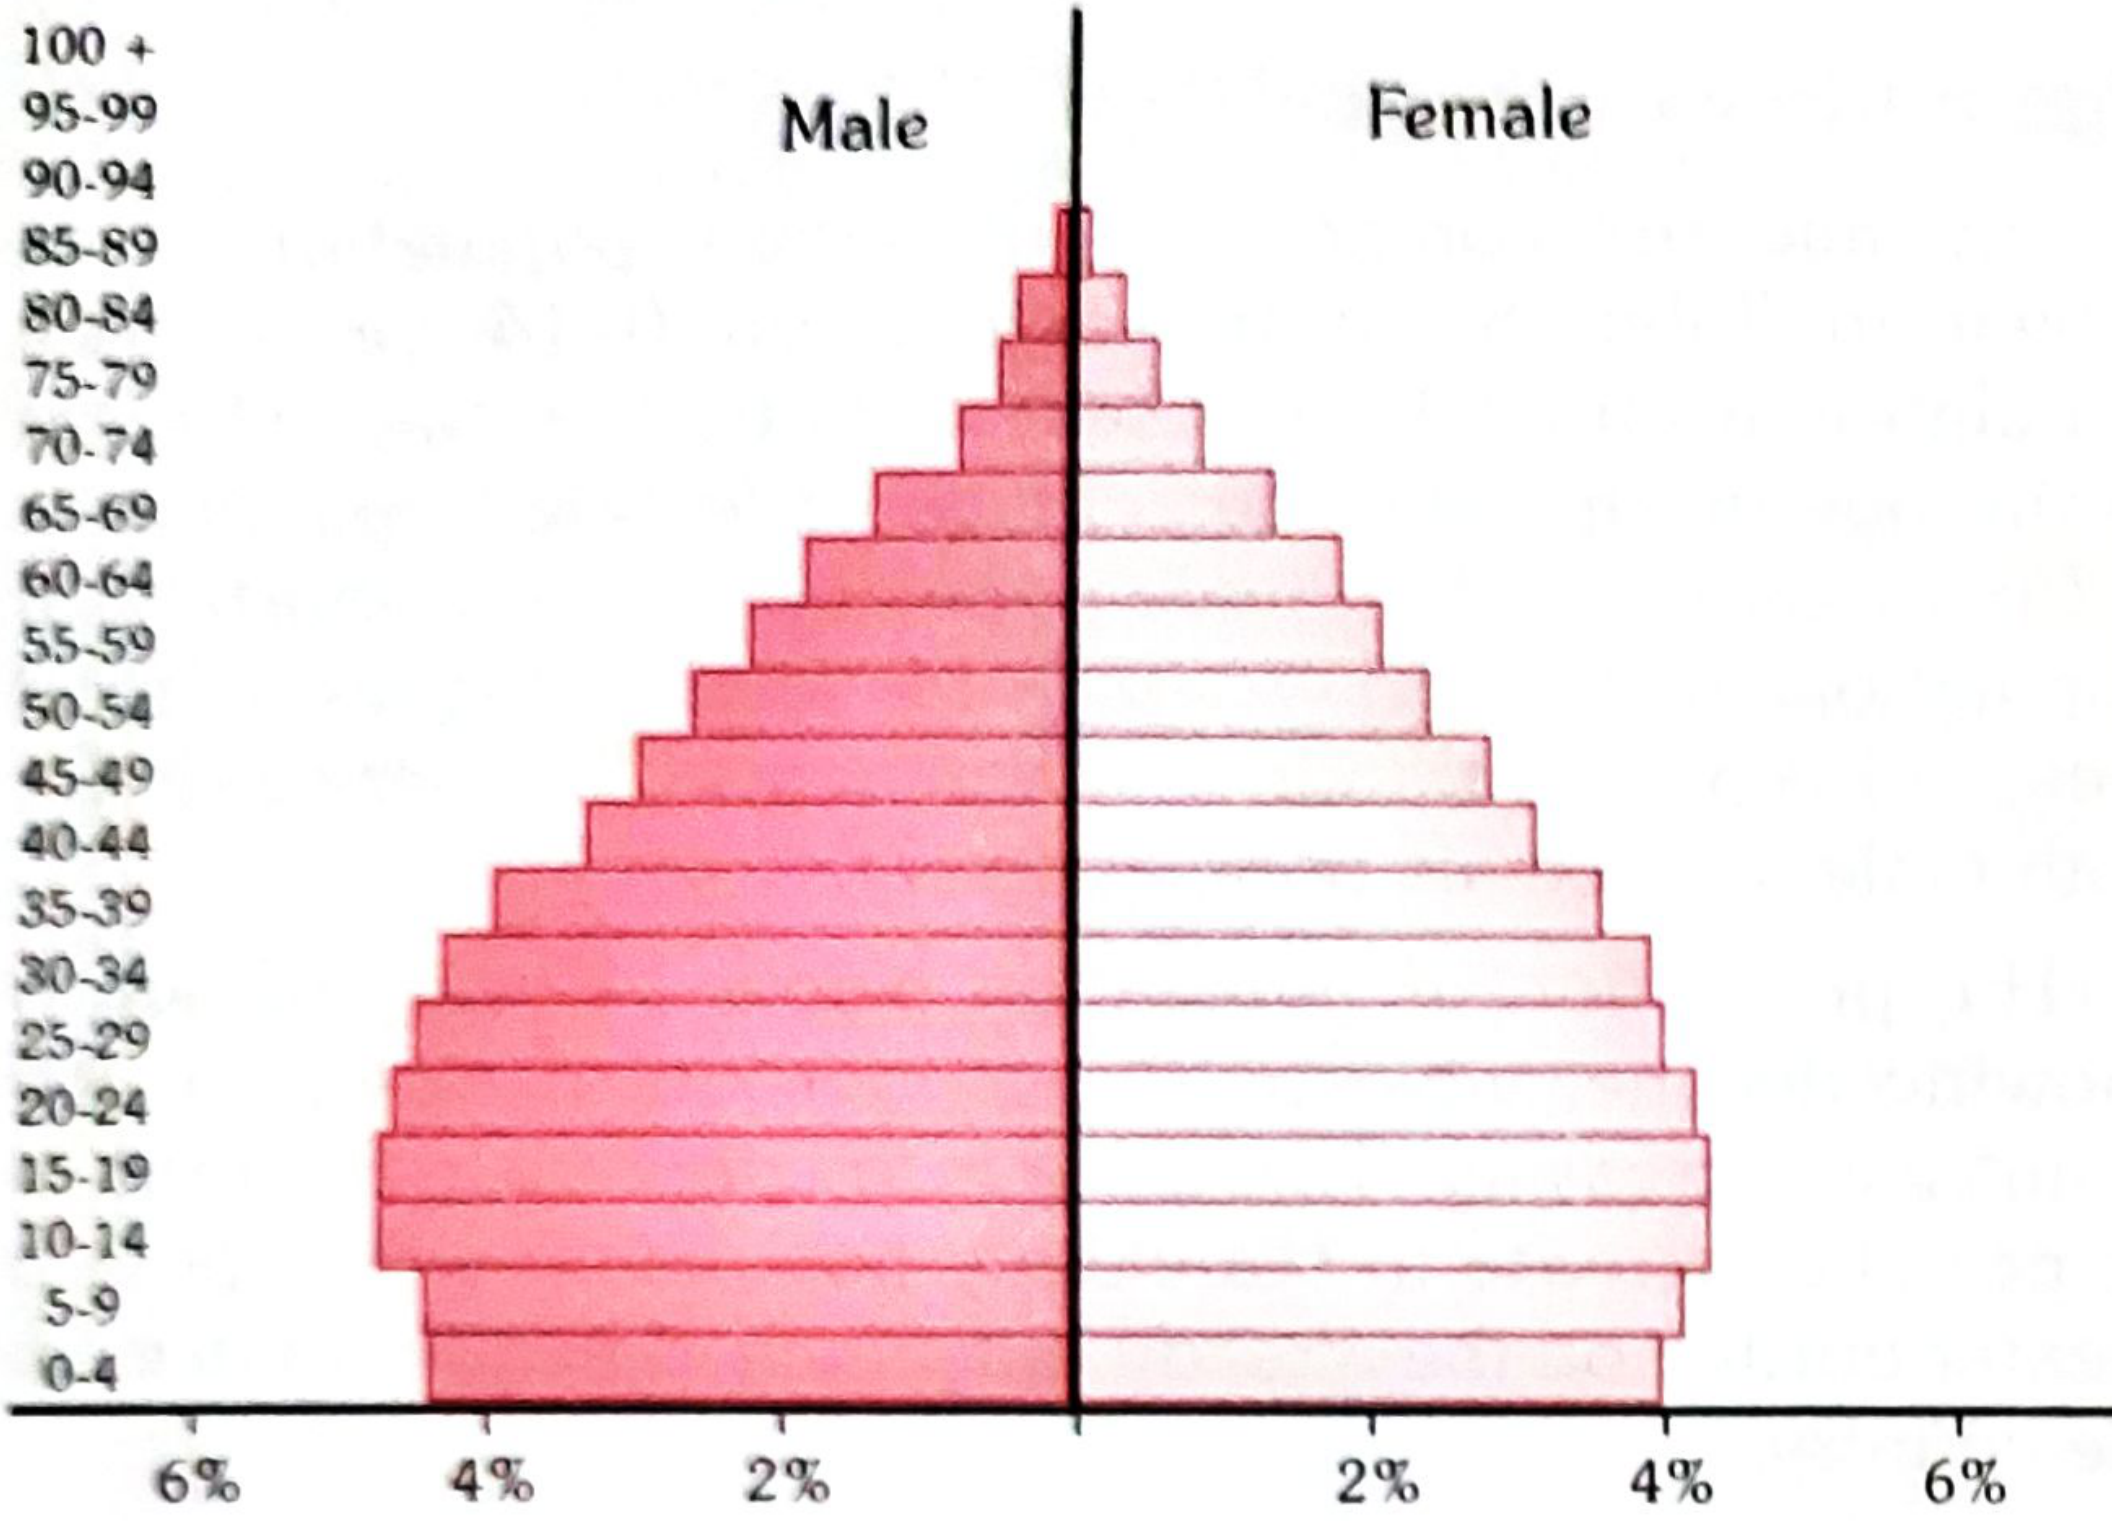
Definition: A population pyramid (also called Age-Sex pyramid) is a graphical representation of the age and sex distribution of a population. It shows distribution of ages across a population, divided at the center between male (left) and female (right) members. The youngest are at the bottom, oldest at the top. It is called a pyramid because growing populations form a triangular shape.
Types of population pyramids:
| Type | Shape | Features | Example |
|---|
| Expansive (Young/Growing) | Broad base, narrow top | High birth rate, high death rate, short life expectancy | India (developing countries) |
| Constrictive (Stationary) | Roughly rectangular | Low birth rate, low death rate, aging population | Switzerland, Western Europe |
| Stationary | Uniform width | Very low birth and death rates | Stable population |
Significance:
-
Demographic interpretation: A broad-based pyramid (India) indicates a high proportion of young dependents, suggesting high birth rate and rapid population growth. A narrow-based pyramid (Switzerland) suggests aging, low fertility, and demographic transition.
-
Dependency ratio: The pyramid visually depicts the number of economically dependent individuals (children + elderly) relative to the working-age population, which has direct implications for healthcare expenditure and social security planning.
-
Health service planning: A broad base means higher demand for pediatric, MCH, and immunization services. An aging pyramid means greater need for geriatric care, chronic disease management, and palliative services.
-
Prediction of future health trends: Population projections using pyramid data allow forecasting of future disease burden, workforce availability, and demographic transitions.
-
Comparison between populations: Comparing pyramids of two populations (e.g., India vs Switzerland) instantly reveals differences in fertility, mortality, and stage of demographic transition.
-
Detection of demographic anomalies: Missing cohorts (caused by wars, famines, migration, or female infanticide) are visible as indentations in the pyramid.
-
Sex ratio imbalance: The pyramid highlights gender disparity in specific age groups (e.g., missing girls in young age groups in India due to sex-selective practices - "Female deficit syndrome").
Fig: India's population pyramid - broad base typical of developing countries (Park's Textbook of PSM)
GROUP B - SAQ (10 Marks each)
B1. Estimating prevalence of hypertension - study type, sample size, probability sampling (2+2+6)
TYPE AND DESIGN OF STUDY (2 marks)
- Type of study: Observational, descriptive epidemiological study
- Design: Cross-sectional study (prevalence study)
Justification: Since the aim is to estimate prevalence (the proportion of people with hypertension at a given point in time), a cross-sectional study is the most appropriate design. It surveys a sample of the population at a single point in time (or short period), measures blood pressure, and calculates the proportion meeting the diagnostic criteria for hypertension. It is economical, quick, and suitable for common conditions.
SAMPLE SIZE ESTIMATION (2 marks)
For estimating prevalence, the standard formula is:
n = Z² × P × Q / d²
Where:
- n = required sample size
- Z = standard normal deviate corresponding to desired confidence level (1.96 for 95% CI)
- P = expected prevalence of hypertension (from pilot study or prior literature; e.g., 0.25 or 25%)
- Q = 1 - P = 0.75
- d = allowable error / absolute precision (e.g., 5% = 0.05)
Example calculation:
n = (1.96)² × 0.25 × 0.75 / (0.05)²
n = 3.8416 × 0.1875 / 0.0025
n = 288 (approximately 300, adding 10-15% for non-response)
Key considerations:
- If expected prevalence is unknown, use P = 0.5 (gives maximum sample size)
- For cluster sampling, multiply by a design effect (DEFF) of 1.5-2.0
- Add 10-15% for expected non-response
PROBABILITY SAMPLING TECHNIQUES (6 marks)
Probability sampling ensures every member of the population has a known, non-zero chance of selection, thereby eliminating selection bias. Types:
1. Simple Random Sampling (SRS)
- Every unit in the sampling frame is assigned a number
- Selection is done using a table of random numbers or lottery method
- Each unit has an equal probability of selection
- Best for homogeneous populations
- Application: List all households in the urban field practice area, number them, and randomly select required number
- Advantage: No bias; Disadvantage: Requires complete list; impractical for large populations
2. Systematic Random Sampling
- Every k-th unit (sampling interval) is selected after a random start
- Sampling interval (k) = Total population / Required sample size
- E.g., to select 300 from 3000 households, k = 10; select a random start (say 7), then select 7, 17, 27, 37...
- Advantage: Simple, quick; Disadvantage: Risk of periodicity bias if list has a recurring pattern
3. Stratified Random Sampling
- Population is first divided into strata (mutually exclusive subgroups based on relevant characteristics such as age group, sex, income, ward)
- Simple random or systematic sampling is then applied within each stratum
- Two variants: Proportionate (each stratum contributes proportionally) and Disproportionate (smaller strata oversampled to ensure adequate representation)
- Advantage: Improves precision; ensures representation of subgroups; Disadvantage: Requires prior knowledge of strata
4. Cluster Sampling
- Population is divided into natural clusters (e.g., households in a ward, lanes, villages)
- A random sample of clusters is selected, and all individuals (or a sample) within selected clusters are studied
- Two-stage if a further sample is taken within clusters
- Application: Select 20 wards randomly from urban area; survey all eligible individuals in those wards
- Advantage: Economical when population is spread over large area; Disadvantage: Less precise than SRS; requires design effect correction
5. Multistage Sampling
- Sampling is done in multiple stages (e.g., first select wards, then streets, then households)
- Each stage uses random sampling
- Most practical for large-scale community surveys
- Application for hypertension study: Stage 1 - randomly select 5 wards; Stage 2 - randomly select 10 streets per ward; Stage 3 - randomly select 6 households per street
For the hypertension prevalence study: Multistage cluster sampling or stratified random sampling would be most appropriate, since the urban field practice area has natural administrative subdivisions (wards, streets) and the population is heterogeneous.
B2. E-waste recycling industry and CKD - study design, sampling (5+4+1)
STUDY DESIGN (5 marks)
Background: Workers at an electronic waste recycling facility have been noted to have increased rates of chronic kidney disease (CKD). E-waste contains heavy metals (lead, cadmium, mercury, chromium, arsenic) and organic pollutants that are nephrotoxic. A systematic investigation is needed to establish an association between occupational exposure and CKD risk.
Recommended study design: Analytical Observational Study - Cross-sectional with analytical component (or prospective cohort if resources allow)
Most feasible option: Analytical Cross-Sectional Study (initial phase)
Alternatively, an Occupational Cohort Study or Case-Control Study may be designed:
Option A: Analytical Cross-Sectional Study
| Feature | Detail |
|---|
| Study population | All workers at the e-waste facility + comparison group (non-exposed workers in the same area) |
| Exposure definition | Duration and type of e-waste handling; measured via questionnaire + biological markers (blood lead, urine cadmium, urinary beta-2 microglobulin) |
| Outcome definition | CKD diagnosed by eGFR < 60 mL/min/1.73m² on two occasions, or proteinuria |
| Design | Survey both exposed and unexposed groups simultaneously; compare CKD prevalence |
Option B: Case-Control Study (preferred for rare outcome)
| Component | Detail |
|---|
| Cases | Workers with confirmed CKD from PHC/hospital records |
| Controls | Workers without CKD matched for age, sex |
| Exposure ascertainment | Occupational history, job title, duration of e-waste handling, use of PPE; supported by urinary heavy metal levels |
| Analysis | Odds ratio (OR) with 95% CI; conditional logistic regression to control confounders (age, smoking, diabetes, pre-existing renal disease) |
| Advantages | Quick, economical, suitable for rare/long-latency conditions like CKD |
Essential components of the study:
- Case definition: Standardized criteria for CKD (KDIGO guidelines: eGFR + urinary markers)
- Exposure assessment: Job-exposure matrix, biological monitoring (urinary cadmium, blood lead), work environment air sampling
- Confounders: Age, sex, pre-existing diabetes/hypertension, NSAID use, alcohol consumption, traditional herbal medicine use
- Ethical approval and written informed consent
- Control group: Workers from non-e-waste industries in same geographic area
SAMPLING TECHNIQUES FOR THIS STUDY (4 marks)
Available sampling methods:
-
Census/Total enumeration - Study all e-waste workers (feasible if small industry; preferred to avoid sampling bias)
-
Simple Random Sampling - Assign numbers to all workers, select required sample by random numbers table
-
Systematic Random Sampling - Select every k-th worker from the worker register
-
Stratified Random Sampling - Stratify workers by job type (dismantling, smelting, sorting, administration) and sample from each stratum proportionately - important since exposure levels differ by job type
-
Purposive Sampling (non-probability) - Select workers based on highest exposure (useful for case-finding pilot)
MOST SUITABLE TECHNIQUE (1 mark)
Stratified Random Sampling is most suitable. Workers differ significantly in exposure levels by job category (dismantling has highest heavy metal exposure; administrative workers are unexposed). Stratification ensures all exposure sub-groups are adequately represented for a valid exposure-response analysis.
B3. Census vs Sample Registration System (SRS) - comparison + Denominator problem (3+7)
COMPARISON: CENSUS vs SRS (3 marks)
| Feature | Census | Sample Registration System (SRS) |
|---|
| Frequency | Decennial (every 10 years) | Continuous (ongoing); survey every 6 months |
| Coverage | Total enumeration - all persons in the country | Sample-based - covers a representative sample of villages/urban blocks |
| Methodology | House-to-house complete enumeration; self-enumeration or assisted | Dual-record system: (1) Continuous enumeration of vital events by a resident enumerator + (2) Independent retrospective half-yearly survey by a supervisor-investigator |
| Primary outputs | Total population count; age-sex distribution; literacy; housing; economic characteristics | Reliable estimates of birth rate, death rate, infant mortality rate, age-specific fertility and mortality rates, under-5 mortality |
| Timeliness | Data available only after several years of analysis; results delayed | Near real-time data; more current estimates available annually |
| Purpose | Demographic baseline, denominator for all rates | Fills gap of civil registration; provides reliable vital statistics at national and state level |
| Legal basis | Census Act 1948 | Set up by Registrar General of India; started mid-1960s as a dual record system |
| Initiated in India | 1881 | Mid-1960s |
Key synergy: The census provides the denominator (total population by age, sex, area), while SRS provides numerator data (births, deaths). Together, they allow computation of vital rates. The SRS half-yearly survey specifically "produces the denominator required for computing rates" at sub-national levels between censuses.
THE "DENOMINATOR PROBLEM" IN HEALTH INFORMATION (7 marks)
Definition:
The denominator problem refers to the difficulty in accurately knowing the population "at risk" (the denominator) when calculating health rates, ratios, and proportions. Without a reliable denominator, it is impossible to compare disease burden meaningfully across populations or over time.
Why denominators matter:
All meaningful health rates (incidence, prevalence, mortality) require a denominator:
Rate = (Number of events / Population at risk) × constant
Manifestations of the denominator problem:
1. Outdated population data
Census data is collected only every 10 years. In the inter-censal period (e.g., between 2011 and 2021 census), the population denominator becomes outdated. Rapid growth, migration, and urbanization make the 10-year-old figure unreliable. Health rates computed using stale denominators are inaccurate.
2. Geographic mismatch
Health service catchment areas rarely match census administrative boundaries (district vs. sub-district, urban slums not captured in census wards). The population served by a PHC may differ from the officially assigned catchment population.
3. Floating/migrant populations
Mobile populations (migrant laborers, seasonal workers, urban slum dwellers) are often missed or miscounted in census. Their health events (deaths, disease) are recorded where they occur, but the denominator does not include them - inflating apparent rates in destination areas.
4. Numerator-denominator source mismatch
Numerator data (disease cases, deaths) comes from health facilities, registrations, or surveys conducted in a different population than the census denominator. For example, hospital deaths reported for a region may include patients from outside that region.
5. Sub-group denominators
Rates for specific groups (women of reproductive age, children under 5, elderly) require age-sex specific denominators which are not always available at the PHC or block level. This is especially problematic for computing MMR, IMR, and under-5 mortality rate at district level.
6. Civil registration deficiencies
In India, civil registration of births and deaths is incomplete (particularly in rural areas). Numerator data (deaths, births) is missing. SRS was set up specifically to address this - it provides a dual-record system that produces reliable numerators AND denominators for vital rate computation.
Consequences:
- False comparisons of disease rates between areas
- Misallocation of health resources
- Inability to monitor progress toward health targets (e.g., SDGs)
- Masking of true epidemic signals
Solutions to the denominator problem:
- Regular census + inter-censal population projections
- SRS - provides denominator for vital rate computation between censuses
- Local surveys and rapid assessments
- Geographic Information Systems (GIS) for real-time population mapping
- Aadhar-linked health data for dynamic population tracking
- Use of household registration by ANMs/ASHAs at village level
GROUP C - Short Notes (5 Marks each)
C1. Standard Error
Definition: Standard error (SE) is the standard deviation of the sampling distribution of a statistic (usually the mean). It measures how much the sample mean is expected to vary from the true population mean.
Formula:
SE of mean = S / √n
Where S = sample standard deviation, n = sample size
Key points:
- If we take repeated random samples of size n from a population, the means of these samples will follow a normal distribution centered around the true population mean (μ). The standard deviation of these sample means is called the Standard Error.
- SE decreases as sample size (n) increases - larger samples give more precise estimates
- SE is a measure of sampling precision (not biological variability)
- SE ≠ Standard Deviation: SD measures spread of individual observations; SE measures precision of the sample mean as an estimate of the population mean
Uses:
- Setting confidence intervals: 95% CI = x̄ ± 1.96 × SE
- Testing statistical significance (Z-test, t-test)
- Comparing sample means to population parameters
- Judging reliability of an estimate
Example: A sample of 25 males had a mean temperature of 98.14°F with SD = 0.6
SE = 0.6/√25 = 0.12
95% CI = 98.14 ± (2 × 0.12) = 97.90 to 98.38°F
This means there is 95% probability that the true population mean lies between 97.90 and 98.38°F.
Relationship to sample size: SE is inversely proportional to √n. To halve the SE, the sample size must be quadrupled.
C2. Standard Normal Curve
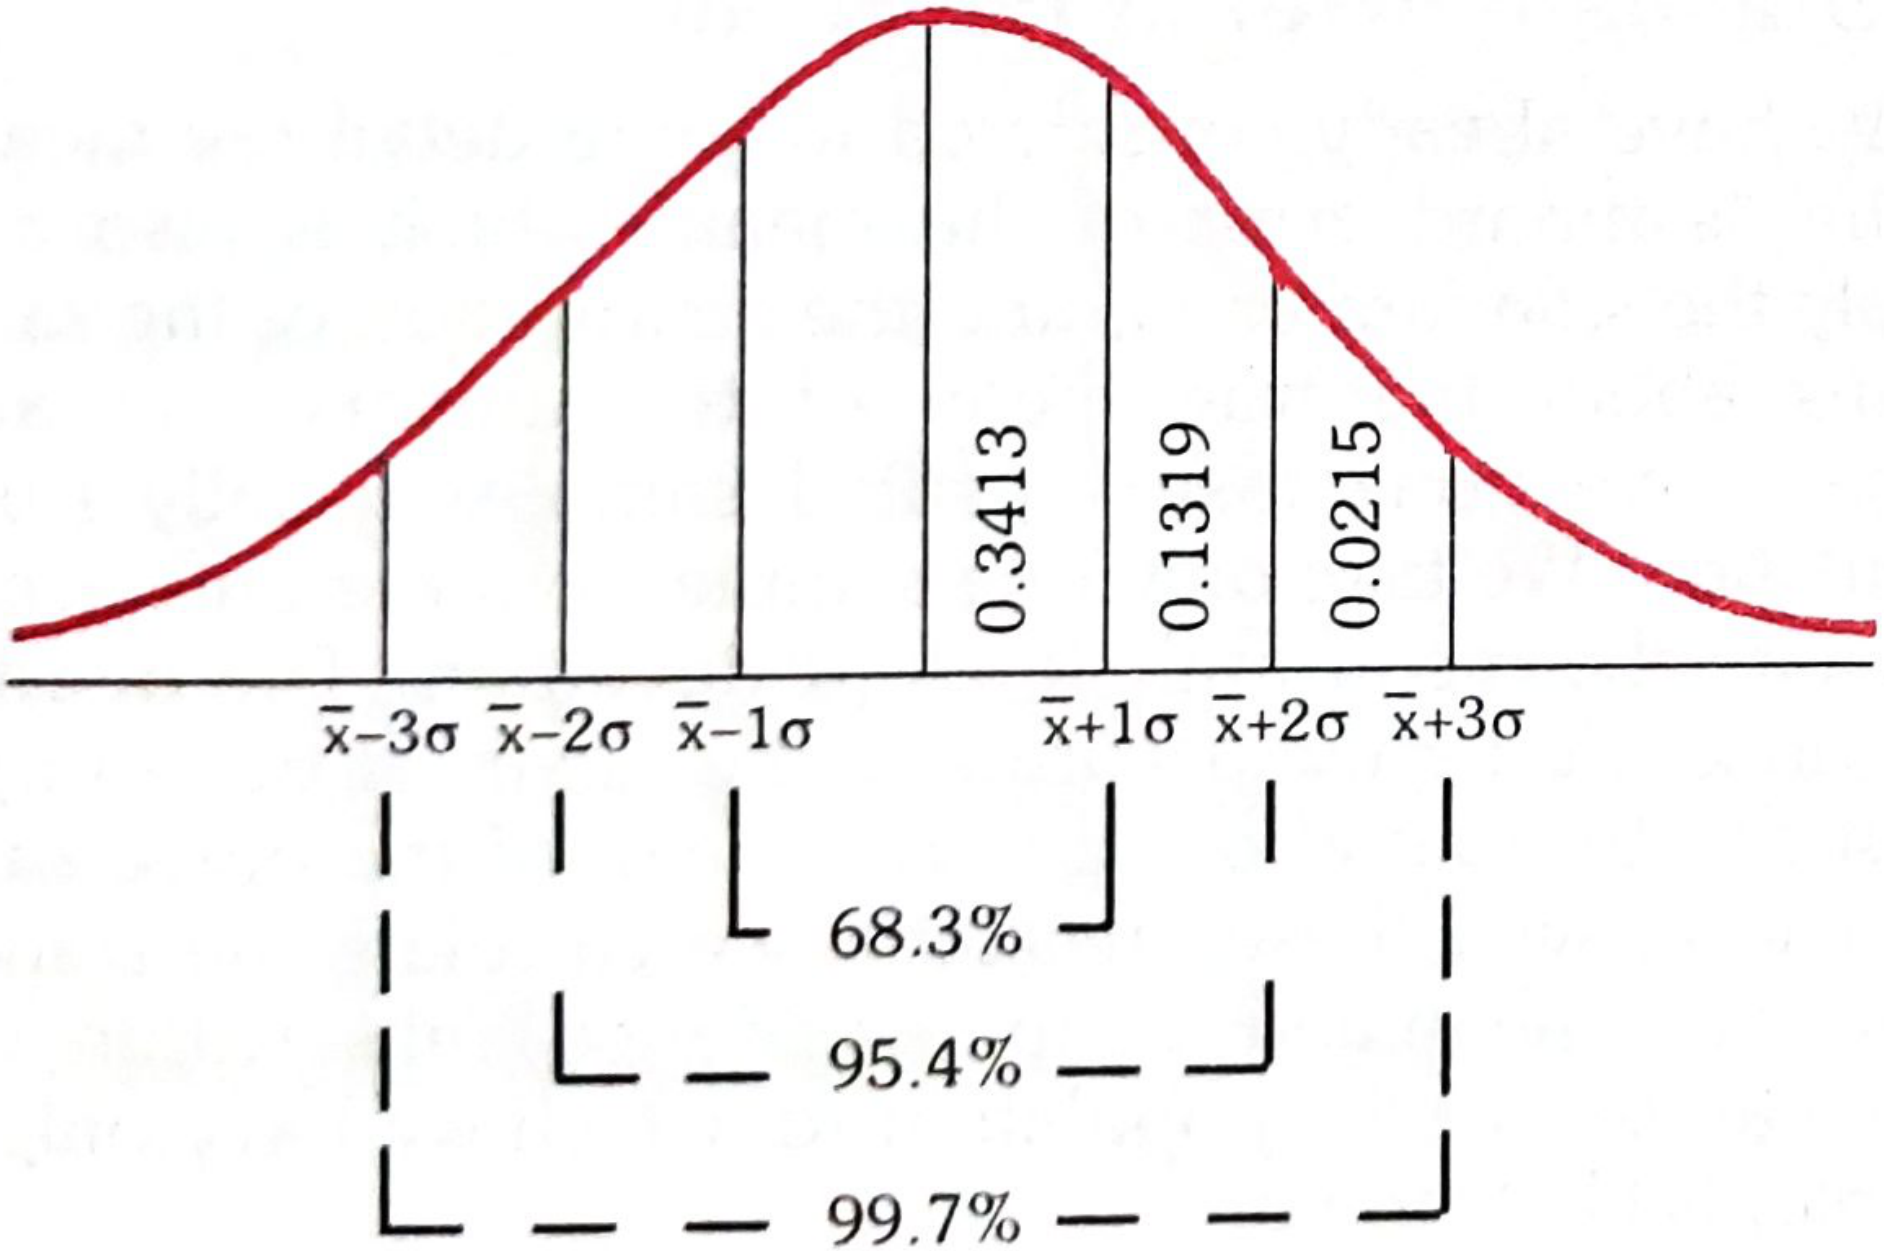
Definition: The Standard Normal Curve is a special form of the normal distribution with:
- Mean = 0
- Standard deviation = 1
- Total area under the curve = 1
Although there are infinite normal curves (each with different mean and SD), there is only one standardized normal curve, devised to facilitate area calculation between any two points.
Key features:
- Smooth, bell-shaped, perfectly symmetrical curve
- Based on an infinitely large number of observations
- Mean, median, and mode all coincide at zero
- Extends to ±∞ but 99.7% of values fall within ±3σ
Standard Normal Deviate (Z-score):
Any value x from a normal distribution is converted to the standard normal deviate:
Z = (x - x̄) / σ
This expresses distance from the mean in units of standard deviation.
Properties of areas under the curve:
| Range | % Area | Interpretation |
|---|
| μ ± 1σ | 68% | 68% of values fall within 1 SD of mean |
| μ ± 2σ | 95% | 95% CI; P=0.05 outside |
| μ ± 3σ | 99.7% | Nearly all values |
Uses in public health and statistics:
- Establishing reference (normal) ranges for biological measurements (e.g., Hb, BP)
- Computing probabilities of any measurement value
- Comparing different biological variables on a single scale
- Hypothesis testing (Z-test)
- Quality control in laboratory medicine
C3. PERT (Programme Evaluation and Review Technique)
Definition: PERT is a project management and planning tool used to schedule, organize, and coordinate tasks within a project. It was developed by the US Navy for the Polaris missile project (1958).
Key components:
1. Activities: Tasks that consume time and resources (represented as arrows in a network diagram)
2. Events/Nodes: Points in time representing start or completion of activities (represented as circles)
3. Network diagram: A flowchart showing the sequence and interrelationship of all activities
4. Time estimates (three-point estimation):
- Optimistic time (to): Minimum possible time if everything goes perfectly
- Pessimistic time (tp): Maximum time if everything goes wrong
- Most likely time (tm): Realistic estimate under normal conditions
- Expected time (te) = (to + 4tm + tp) / 6 (weighted average)
5. Critical Path: The longest path through the network; determines the minimum project duration. Activities on the critical path have zero float (delay = project delay).
6. Slack/Float: The amount of time an activity can be delayed without affecting the project completion date.
Uses in public health:
- Planning and monitoring large health programmes (e.g., polio eradication campaigns, hospital construction)
- Organizing multi-step community surveys
- Scheduling vaccination drives
- Managing health system strengthening projects
Advantages:
- Identifies critical bottlenecks
- Allows resource allocation to critical activities
- Enables realistic scheduling with uncertainty quantification
PERT vs Gantt chart: PERT shows interdependencies between tasks; Gantt chart shows timeline only.
C4. Normal Distribution Curve
(Answers covered in detail under C2 above; key additional points:)
Definition: A normal distribution is a symmetrical, bell-shaped frequency distribution of a continuous variable in which observations cluster around the mean, with progressively fewer observations as they deviate from it.
Mathematical characteristics:
- Perfectly symmetrical about the mean
- Mean = Median = Mode (all coincide)
- The tails extend to ±∞ (asymptotic to the x-axis)
- Completely described by just two parameters: mean (μ) and standard deviation (σ)
- Total area under curve = 1 (or 100%)
Conditions where data are normally distributed:
- Height, weight, blood pressure in large samples
- IQ scores in a population
- Laboratory values (haemoglobin, serum sodium) in healthy individuals
Skewness and departure from normality:
- Positively skewed: tail to the right; Mean > Median > Mode (e.g., income distribution, incubation periods)
- Negatively skewed: tail to the left; Mode > Median > Mean
Significance:
- Foundation of parametric statistical tests (t-test, ANOVA, Pearson correlation)
- Enables computation of reference ranges and confidence intervals
- Central Limit Theorem: sample means approach normal distribution as n increases, even if population is not normal
C5. Measures of Central Tendency
Definition: A measure of central tendency is a single value that represents or summarizes the entire distribution of observations, around which most values tend to cluster.
The three principal measures are:
1. Arithmetic Mean (Average)
- Sum of all values divided by the number of observations
- Formula: x̄ = Σx / n
- Example: Mean of 71, 75, 75, 77, 79, 81, 83, 84, 95 = 720/9 = 80
- Advantages: Uses all values; amenable to further mathematical operations; most sensitive
- Disadvantages: Severely affected by outliers/extreme values; cannot be used for open-ended distributions
2. Median
- The value of the middle observation when data are arranged in ascending or descending order
- For odd n: median = value of [(n+1)/2]th observation
- For even n: median = average of (n/2)th and (n/2+1)th observations
- Example: From the same 9 values above, median = 5th value = 79
- Advantages: Not affected by extreme values/outliers; can be used for open-ended distributions; suitable for skewed data
- Disadvantages: Does not use all values; cannot be used in further algebraic treatment
3. Mode
- The most frequently occurring value in a distribution
- Example: In the series 71, 75, 75, 77, 79, 81, 83, 84, 95 → Mode = 75 (appears twice)
- In a perfectly normal distribution, mode = median = mean
- Bimodal distribution has two modes
- Advantages: Easy to understand; not affected by extreme values
- Disadvantages: May not be unique; does not use all data; cannot be used algebraically
Choosing the appropriate measure:
| Situation | Best Measure |
|---|
| Symmetrical, normal distribution | Mean |
| Skewed distribution | Median |
| Outliers present | Median |
| Categorical/nominal data | Mode |
| Open-ended class intervals | Median |
| Further statistical calculations needed | Mean |
Relationship in a skewed distribution:
- Right (positive) skew: Mode < Median < Mean
- Left (negative) skew: Mean < Median < Mode
C6. Sources of Health Information
Definition: Health information refers to data that describes the health status of individuals or populations, including patterns of disease, risk factors, health services utilization, and demographic characteristics.
Major sources:
1. Census
Complete population enumeration every 10 years. Provides denominators, age-sex structure, literacy, housing, and economic data essential for computing health rates.
2. Registration of Vital Events (Civil Registration System)
Continuous registration of births, deaths, marriages, divorces under the Registration of Births and Deaths Act, 1969. Provides cause-specific mortality, birth rates, and fertility data. Limitations: underreporting, delay, and incomplete coverage in rural India.
3. Sample Registration System (SRS)
Dual-record system introduced in mid-1960s by the Registrar General of India. Provides reliable current estimates of birth rate, death rate, IMR, and maternal mortality at national and state level. Covers the entire country.
4. Notification of Diseases
Legal requirement for health care providers to report specified notifiable diseases (e.g., cholera, plague, malaria, TB). Provides morbidity data and enables epidemic detection and control. Limitations: underreporting, delayed reporting.
5. Health Surveys
Periodic surveys such as the National Family Health Survey (NFHS), District Level Household Survey (DLHS), Annual Health Survey (AHS) provide data on fertility, mortality, nutrition, anemia, immunization coverage, etc.
6. Hospital/Institutional Records
OPD registers, admission records, operation theater records, laboratory reports, discharge summaries. Provide data on disease patterns, treatment outcomes, resource utilization.
7. Disease Registers
Special registers for cancer (population-based cancer registries), tuberculosis (Nikshay), leprosy, etc. Track incidence, prevalence, and outcomes of specific diseases.
8. Health Management Information System (HMIS)/DHIS2
Routine reporting by PHCs, CHCs, district hospitals. Provides service delivery statistics - ANC visits, institutional deliveries, immunization, OPD attendance.
9. Epidemiological Surveys and Research Studies
Cross-sectional surveys, cohort studies, case-control studies, clinical trials that generate evidence for policy.
10. International Sources
WHO Global Health Observatory, UNICEF MICS, World Bank health data - provide comparative international health statistics.
GROUP D - Elaborate/Write (4 Marks each)
D1. Median is a suitable measure of central tendency if a data contains an outlier
Justification: TRUE. The median is indeed preferred when data contains outliers.
An outlier is an extreme value that is far from the rest of the data. The arithmetic mean is calculated using all observations (Σx/n), so a single extreme value disproportionately pulls the mean toward it, giving a misleading picture of the "typical" value.
Example:
Incomes (in ₹1000/month) of 5 workers: 8, 9, 10, 11, 62
- Mean = (8+9+10+11+62)/5 = 100/5 = 20 (misleadingly high; no actual worker earns near ₹20,000)
- Median = 10 (middle value; more representative of typical income)
The outlier (₹62,000) inflates the mean but does not affect the median. Hence, for skewed distributions and data with outliers (e.g., income, disease duration, hospital stay), the median is a more robust and representative measure of central tendency than the mean.
This is why reporting median survival time is standard in cancer studies (rather than mean), since a few long survivors would inflate the mean.
D2. The Census is an important tool of health information
(Also applicable to D4 and D2 SRIMS)
The census is one of the most fundamental tools of health information for the following reasons:
-
Population denominators: All health rates (birth rate, death rate, IMR, MMR, disease incidence/prevalence) require a denominator - the population at risk. The census provides the only comprehensive population count.
-
Age-sex breakdown: Essential for computing age-sex-specific rates and planning age-targeted services (immunization schedules, reproductive health services, geriatric care).
-
Socio-economic data: Literacy, occupation, income, housing, access to safe water and sanitation data from census identifies vulnerable groups for priority health action.
-
Urban-rural distribution: Guides differential allocation of health infrastructure (PHCs, sub-centers, hospitals).
-
Baseline for evaluation: Monitors progress against health policy targets (National Health Policy, SDGs) by providing a reference baseline.
-
Planning health manpower: Population size and distribution data informs medical college seats, MBBS output requirements, nursing staff needs, bed-population ratios.
-
Feed for SRS and NFHS: Census population frames are used as sampling frames for the SRS and National Family Health Survey.
Limitation: Decennial frequency means data quickly becomes outdated in rapidly changing populations. Full results take years to publish. Despite this, no other source matches its scope and comprehensiveness as a baseline health information tool.
D3 & D5. For small samples / skewed data, median is a better measure of central tendency than mean
TRUE. For statistically small samples or highly skewed data, the median is a superior measure.
Reasons:
1. Effect of outliers: In small samples, a single extreme value has a much larger proportional influence on the mean. With n=5, one outlier shifts the mean dramatically. With n=500, one outlier has minimal effect. So the problem is magnified in small samples.
2. Skewed distributions: In positively skewed distributions (e.g., serum bilirubin, liver enzyme levels, incubation periods), the mean is pulled toward the long tail and no longer represents the "typical" case. The median, being the middle rank value, stays close to where most observations actually cluster.
3. Non-parametric appropriateness: Small samples from non-normal distributions violate the assumptions required for the mean to be a meaningful summary statistic. Median-based statistics (Wilcoxon test, Mann-Whitney test) are more appropriate.
4. Open-ended distributions: When the highest or lowest class interval is open-ended (e.g., ">500 mg/dL"), the exact mean cannot be calculated but the median can be determined.
Conclusion: Mean is the measure of choice for large, normally distributed data. For small samples, skewed data, or data with outliers, the median is more robust, resistant to extreme values, and a more honest representation of the "centre" of the distribution.
D6. Health Information System is essential for effective implementation of national health programmes
TRUE - Health Information System (HIS) is the backbone of programme implementation.
A Health Information System (HIS) is defined as a system that collects, processes, analyzes, and disseminates health data to support decision-making and programme management.
Why HIS is essential:
-
Need identification: Data on disease burden (incidence, prevalence, geographic distribution) guides which programmes need prioritization and where.
-
Resource allocation: HIS data ensures equitable distribution of drugs, vaccines, manpower, and equipment based on actual need rather than assumption.
-
Programme monitoring: Real-time data from HMIS/DHIS2 allows managers to track immunization coverage, ANC attendance, TB cure rates, and institutional delivery rates - and intervene when targets are missed.
-
Surveillance and early warning: Disease surveillance systems (IDSP - Integrated Disease Surveillance Programme) detect epidemic signals early, enabling rapid response.
-
Evaluation and accountability: Programme outcomes (e.g., reduction in IMR, MMR, leprosy case load) can only be measured with reliable HIS data.
-
Evidence-based policy: National Health Policy, National Health Mission guidelines, and drug procurement decisions are all informed by HIS data.
Examples:
- Pulse Polio Programme success was tracked using acute flaccid paralysis (AFP) surveillance data
- RNTCP targets are monitored using Nikshay (TB case registry)
- COVID-19 vaccination drive used CoWIN platform as a real-time HIS
Without a functioning HIS, programmes become blind - implementing activities without knowing whether they are reaching the right people or achieving the desired outcomes.
D7. Random sampling reduces selection bias in research studies
TRUE.
Selection bias occurs when the subjects selected for a study are systematically different from those not selected, making the sample unrepresentative of the target population. This leads to results that cannot be validly generalized.
How random sampling prevents selection bias:
-
Equal probability of selection: In simple random sampling, every member of the population has an equal and known chance of being selected. No group is systematically favored or excluded.
-
Eliminates investigator judgment: The researcher cannot consciously or unconsciously select "convenient," "interesting," or "cooperative" subjects. The selection is governed purely by chance (random number table, computer-generated random numbers).
-
Distributes confounders evenly: Random allocation distributes known and unknown confounding variables approximately equally between sample and non-sample (or between study groups in an RCT). This cannot be achieved with non-random methods.
-
Enables valid inference: Statistical tests (t-test, chi-square, confidence intervals) assume random sampling. Only with random selection can probability statements be validly made about the population from which the sample came.
Contrast with convenience sampling:
Convenience sampling (e.g., selecting patients attending OPD) introduces systematic bias - those attending OPD may be sicker, from higher socioeconomic groups, or have better health awareness, making them unrepresentative of the community.
Types of random sampling that reduce bias: Simple random, systematic, stratified, cluster (all probability methods).
In summary, random sampling is the gold standard for representativeness because it is the only method that allows unbiased generalization of findings from sample to population.
D8. Registration of vital events is important for policy making
TRUE.
Vital events registration (births, deaths, marriages, divorces) is the foundation of vital statistics and is critically important for policy-making:
-
Monitoring population growth: Registered birth and death data reveals natural growth rate, fertility trends, and need for family planning policy.
-
Computing health indicators: Crude Birth Rate, Crude Death Rate, IMR, and MMR all require reliable registration data as numerators. These indicators are used by governments and international agencies to set and track health policy targets.
-
Cause of death analysis: Medical certification of cause of death (MCCD) from registered deaths provides national mortality patterns by cause - informing decisions on which diseases to prioritize (NCD policy, cancer control, road safety).
-
Legal and administrative uses: Registered events create legal identity (birth certificate), determine citizenship, inheritance rights, pension eligibility - all of which have health and social welfare policy implications.
-
Planning family welfare services: Birth registration data guides targets for immunization, MCH services, school enrolment, and child nutrition programmes.
-
Evaluation of health programmes: Trends in registered deaths from specific causes (e.g., diarrheal disease deaths before and after ORS introduction; malaria deaths before and after vector control) provide evidence on programme effectiveness.
The Births and Deaths Registration Act, 1969 made registration compulsory in India, with a 21-day window and penalties for non-compliance. More recently (2018), Aadhaar linkage to death registration has been mandated.
Deficiencies in registration (underreporting, delayed registration, inaccurate cause of death) directly compromise the quality of health policy evidence in India.
D9. SRS is essential for better health statistics
TRUE.
The Sample Registration System (SRS) was introduced in India in the mid-1960s because civil registration of vital events was (and remains) grossly deficient - suffering from inaccuracy, incompleteness, and lack of timeliness.
What makes SRS essential:
-
Dual-record system: Combines (a) continuous enumeration by a local resident enumerator, with (b) an independent retrospective half-yearly survey by a supervisor. The overlap between the two records allows adjustment for events missed by either - producing more accurate and reliable estimates than single-record systems.
-
National and state-level estimates: SRS now covers the entire country and provides reliable estimates of birth rate, death rate, infant mortality rate, under-5 mortality, age-specific fertility rates, and maternal mortality at national and state levels.
-
Fills the gap of civil registration: Civil registration in India remains incomplete, especially in rural areas. SRS provides what civil registration cannot.
-
Timely data: SRS produces annual reports, making current vital statistics available without waiting for the decennial census.
-
Denominator for vital rates: The half-yearly survey produces the denominator (population at risk) needed for computing rates - addressing the denominator problem.
Without SRS: India would lack current, reliable estimates of IMR and birth/death rates essential for monitoring SDG targets, NHM progress, and international health comparisons.
D10. Random sampling is preferred over convenience sampling in epidemiological study
(Answered in detail under D7 above - the core argument is elimination of selection bias and ability to make valid inferences about the population.)
Additional specific epidemiological points:
- In epidemiological studies, the goal is to measure disease frequency (incidence/prevalence) and associations (risk factors) in the source population. Convenience samples (e.g., hospital patients, volunteers) are often healthier, sicker, or more health-conscious than the general population - introducing Berkson's bias (hospital bias) or volunteer bias.
- Prevalence studies using convenience samples may over- or underestimate true disease burden.
- Case-control studies using hospital controls (convenience) may yield spurious ORs.
- Random sampling ensures external validity (generalizability) - findings apply beyond the study sample to the source population.
D11. Charts and diagrams are useful methods for presentation of statistical data
TRUE.
Visual presentation of data through charts and diagrams provides several advantages over tabular or numerical presentation:
Types of charts/diagrams and their uses:
| Chart | Best used for | Example |
|---|
| Bar chart | Comparing discrete categories | Disease-wise case counts |
| Histogram | Frequency distribution of continuous data | Age distribution of BP readings |
| Frequency polygon | Overlapping frequency distributions | BP trends across populations |
| Line diagram | Trends over time | Malaria cases 1971-1978 |
| Pie chart | Proportions of a whole | % cases by age group |
| Scatter diagram | Correlation between two variables | Height vs weight |
| Population pyramid | Age-sex distribution | India's demographic structure |
| Map (spot/shaded) | Geographic distribution of disease | Cholera outbreak mapping |
| Pictogram | Communicating to the general public | Population per doctor |
Why they are useful:
- Immediate visual impact: Patterns (trends, peaks, outliers) are instantly visible; hard to grasp from tables alone
- Comparability: Multiple groups or time periods can be overlaid for direct comparison
- Communication to non-statisticians: Policymakers, the public, and media understand graphs better than tables
- Memory retention: Visual information is retained better than numerical tables
- Detection of anomalies: Unusual peaks, bimodality, and outliers are immediately visible
Limitations: Charts may oversimplify; poorly drawn charts can be misleading (truncated Y-axis, cherry-picked time ranges); they lack the precision of tables for exact values.
D12. Standard Deviation is the best measure of dispersion
TRUE - Standard Deviation (SD) is the most widely used and best measure of dispersion.
Definition: SD is the square root of the arithmetic mean of the squared deviations from the mean:
σ = √[Σ(x - x̄)² / n] (population)
s = √[Σ(x - x̄)² / (n-1)] (sample)
Why SD is the best measure of dispersion:
-
Uses every observation: Unlike range (only uses two values) or interquartile range (uses only middle 50% of data), SD incorporates all observations in its calculation.
-
Mathematically tractable: SD can be used in further algebraic and statistical operations. It forms the basis of the normal curve, confidence intervals, t-tests, ANOVA, regression, and correlation.
-
Same units as original data: Unlike variance (units are squared), SD is expressed in the same units as the original measurement (e.g., mmHg for blood pressure), making it interpretable.
-
Defines the normal curve: Areas under the normal distribution are defined in terms of SD (μ ± 1SD = 68%, μ ± 2SD = 95%, μ ± 3SD = 99.7%). This is the basis for reference ranges in clinical medicine.
-
Standard Error depends on SD: SE = SD/√n; without SD, confidence intervals and significance tests cannot be computed.
-
Reflects true variability: SD gives a precise, objective measure of the spread of individual observations around the mean.
Comparison with other measures:
| Measure | Formula | Limitation |
|---|
| Range | Max - Min | Affected by only 2 values; ignores rest |
| Mean Deviation | Σ|x - x̄|/n | Not mathematically tractable |
| Variance | σ² | Units are squared; not directly interpretable |
| IQR | Q3 - Q1 | Ignores top and bottom 25%; can't be used further |
| SD | √variance | Best: uses all data, interpretable, algebraically useful |
Caveat: SD is most meaningful for normally distributed data. For highly skewed distributions, the interquartile range may be a more robust measure of spread (reported alongside the median).
All answers sourced primarily from: Park's Textbook of Preventive and Social Medicine (Park K, Park's Textbook of PSM, Banarsidas Bhanot Publishers), the standard reference for Community Medicine in India.