
All about Radiotracer in cns Brain imaging -- spect,pet ct imaging - in various diseases - along with it ligand molecules
radiotracers CNS brain imaging SPECT PET ligand molecules neurology 2024
PET SPECT brain imaging radiotracer neurology
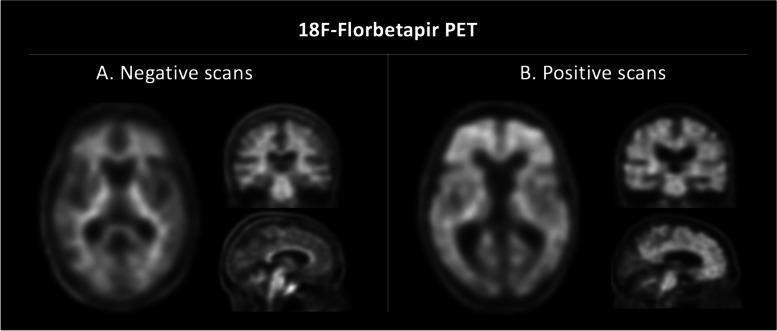
This diagnostic imaging figure displays 18F-Florbetapir Positron Emission Tomography (PET) scans of the brain, comparing amyloid-negative (A) and amyloid-positive (B) findings. Both panels include axial, coronal, and sagittal views. In Panel A (Negative scans), the radiotracer is primarily localized within the white matter, maintaining a clear visual contrast between the radiolabeled white matter and the darker, non-binding gray matter. This pattern represents the absence of significant beta-amyloid plaque deposition. In Panel B (Positive scans), there is a marked increase in tracer uptake within the cortical gray matter across the frontal, parietal, and temporal lobes, as well as the posterior cingulate cortex. This increased tracer intensity results in a loss of the normal gray-white matter contrast, as the cortical uptake matches or exceeds white matter levels. These findings are clinically significant for the pathological identification of amyloid deposition associated with Alzheimer's disease. The comparison highlights the shift from a white-matter-only distribution to a global cortical uptake pattern used in diagnostic neurology.
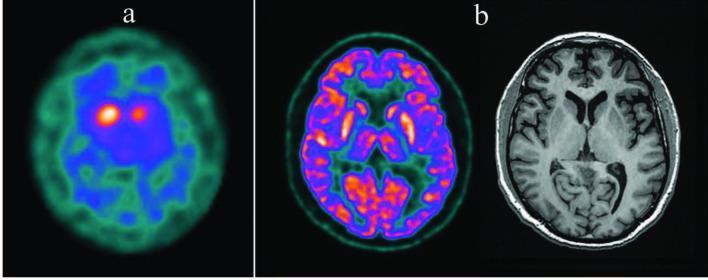
Multi-modal diagnostic imaging of the brain in the axial plane demonstrating findings consistent with neurodegenerative parkinsonism. Image (a) is a 123I-ioflupane DAT SPECT scan showing bilaterally decreased radiotracer uptake in the striatal structures of the basal ganglia, particularly affecting the putaminal regions, giving the remaining uptake an oval appearance. An asymmetric pattern is noted with a more pronounced deficit in the left basal ganglion. Image (b) presents a side-by-side comparison of an 18F-FDG PET scan and a T1-weighted MR image. The FDG-PET reveals relatively increased glucose metabolism in the bilateral putaminal regions, which serves as a metabolic marker for Parkinson's disease. The corresponding T1-weighted MRI shows normal anatomical structures without specific pathological changes or volume loss in the cerebral cortex. This comparison illustrates the clinical significance of functional imaging (SPECT and PET) over structural imaging (MRI) in the early diagnosis of dopamine transporter deficiency and metabolic shifts associated with Parkinsonian syndromes.
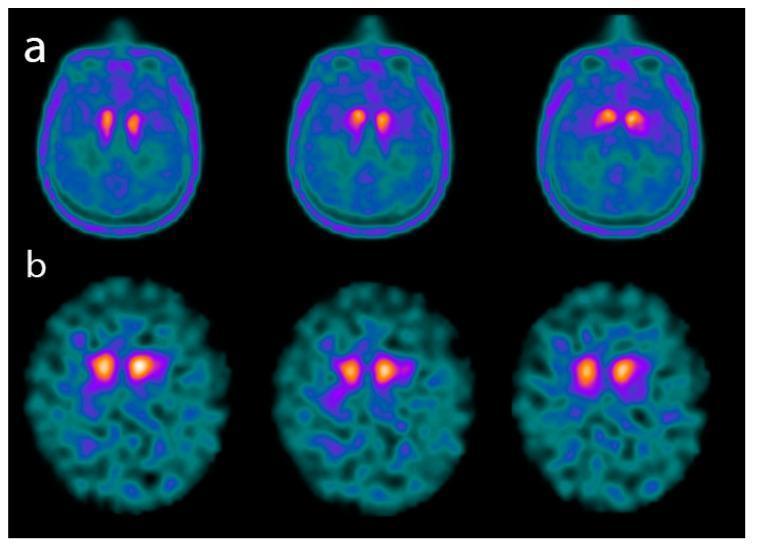
This diagnostic comparison image presents axial brain scans from two different functional imaging modalities: 18F-Fluoro-L-dopa (FDOPA) PET (row a) and 123I-FPCIT (DATSCAN) SPECT (row b). The images illustrate the neurochemical profile of patients with advanced dementia with Lewy bodies (DLB). Both rows demonstrate a characteristic reduction in radiotracer uptake within the basal ganglia, specifically the striatum (caudate nucleus and putamen). In row (a), the FDOPA PET scans show diminished metabolic activity in the dopaminergic system, indicated by the reduced intensity and area of the warm colors (yellow/red) compared to healthy controls. In row (b), the DATSCAN SPECT images reveal a severe decrease in dopamine transporter (DAT) availability, represented by the restricted and weakened signal in the striatal regions. The surrounding cortical and subcortical brain tissue displays low, uniform background uptake in both modalities, primarily in cooler blue and green tones. This visual comparison highlights the integrated role of PET and SPECT imaging in identifying presynaptic dopaminergic deficits, a core diagnostic feature for differentiating alpha-synucleinopathies like DLB from other dementias such as Alzheimer’s disease.
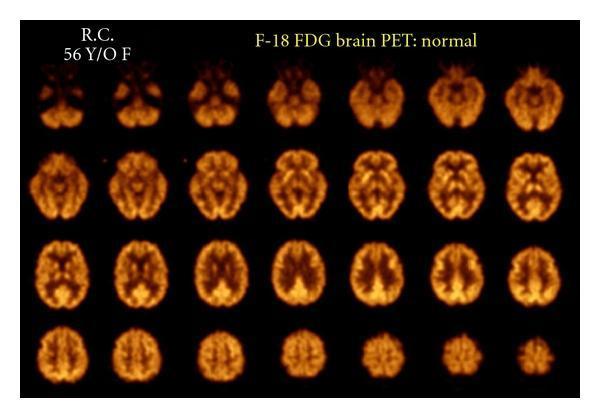
This diagnostic image displays a series of F-18 fluorodeoxyglucose (FDG) Positron Emission Tomography (PET) axial slices of a human brain from a 56-year-old female. The montage represents a normal baseline scan conducted at rest, showcasing 28 sequential cross-sectional slices from the cerebellum and skull base through the vertex. The radiotracer distribution is characterized by symmetrical, physiological uptake throughout the cerebral cortex and subcortical structures. Consistent metabolic activity is observed in the frontal, parietal, temporal, and occipital lobes, as well as the basal ganglia and thalamus. There is a high grey-to-white matter contrast, which is normal for FDG PET imaging. No focal areas of pathological hypometabolism or hypermetabolism are present, indicating preserved glucose metabolism across all neuroanatomical regions. This imaging modality is used in neurology and nuclear medicine to evaluate regional cerebral metabolic rates of glucose (rCMRglu), serving as a reference for diagnosing conditions like epilepsy, neurodegenerative diseases, or focal brain lesions.
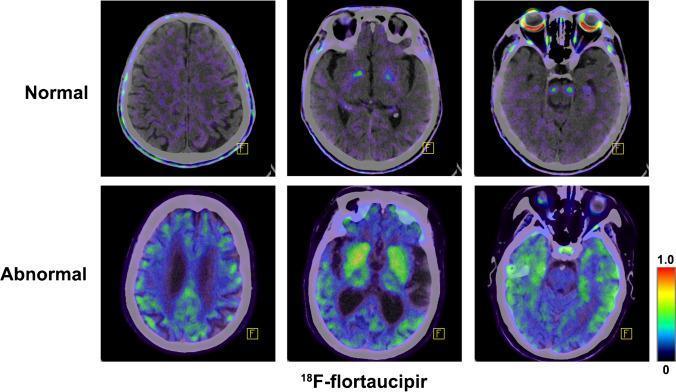
This Comparison Chart features a series of transaxial 18F-flortaucipir PET/CT fusion images of the brain, demonstrating tau protein deposition patterns. The image is organized into two rows: 'Normal' (top) representing a healthy elderly individual and 'Abnormal' (bottom) representing a patient with Alzheimer’s Disease (AD). The color scale on the right indicates radiotracer intensity, with green and yellow representing high retention. In the 'Normal' row, the brain shows minimal cortical radiotracer uptake, with some physiological off-target binding in deep brain structures and the retina. In contrast, the 'Abnormal' row displays marked, bilateral radiotracer retention across several cortical regions, specifically the inferior lateral temporal lobes, temporoparietal junctions, and the posterior cingulate cortex. These findings correlate with advanced Braak staging of tau pathology in AD. The image serves as a diagnostic reference for identifying neurodegenerative tauopathies and illustrates the clinical utility of tau-specific PET imaging in geriatric neurology.
![This diagnostic comparison image displays axial brain scans from two different functional imaging modalities, [123I]FP-CIT SPECT (top row) and [18F]FE-PE2I PET/CT (bottom row), across two clinical states: Non-Parkinsonian Syndrome (Non-PS, left) and Parkinsonian Syndrome (PS, right). The primary focus is the radiotracer uptake within the dopaminergic pathways of the striatum, specifically the caudate nucleus and putamen. In the Non-PS columns, both SPECT and PET/CT show intense, symmetrical, comma-shaped tracer binding, reflecting normal dopamine transporter (DAT) density. In the PS columns, there is a visible reduction in tracer uptake, particularly in the posterior striatum (putamen), which appears shorter or fainter compared to the Non-PS state. The PET/CT row provides enhanced anatomical localization by fusing high-resolution molecular data with structural CT data. This comparison illustrates the clinical utility of molecular imaging in identifying neurodegenerative changes associated with Parkinsonian syndromes, highlighting the loss of striatal dopaminergic innervation.](https://cdn.orris.care/cdss_images/pmc_clinical_VQA_6d15f8be1a2202540f93c573c3c4491e7b9b6cf69523d24fb20188595ea5de4e.jpg)
This diagnostic comparison image displays axial brain scans from two different functional imaging modalities, [123I]FP-CIT SPECT (top row) and [18F]FE-PE2I PET/CT (bottom row), across two clinical states: Non-Parkinsonian Syndrome (Non-PS, left) and Parkinsonian Syndrome (PS, right). The primary focus is the radiotracer uptake within the dopaminergic pathways of the striatum, specifically the caudate nucleus and putamen. In the Non-PS columns, both SPECT and PET/CT show intense, symmetrical, comma-shaped tracer binding, reflecting normal dopamine transporter (DAT) density. In the PS columns, there is a visible reduction in tracer uptake, particularly in the posterior striatum (putamen), which appears shorter or fainter compared to the Non-PS state. The PET/CT row provides enhanced anatomical localization by fusing high-resolution molecular data with structural CT data. This comparison illustrates the clinical utility of molecular imaging in identifying neurodegenerative changes associated with Parkinsonian syndromes, highlighting the loss of striatal dopaminergic innervation.
https://qims.amegroups.org/article/view/6214/html
FDG PET brain hypometabolism Alzheimer frontotemporal dementia
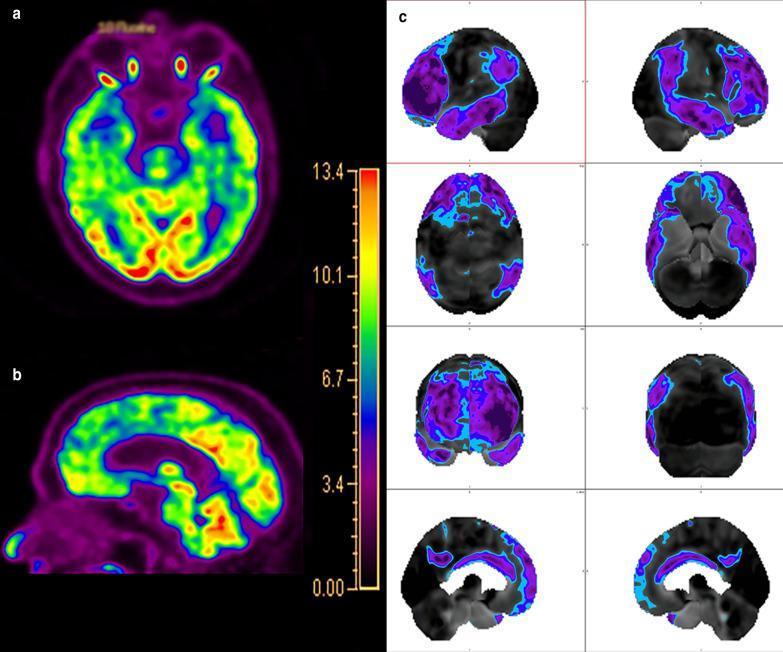
This diagnostic image displays Fluorodeoxyglucose (FDG) PET/CT brain imaging of a 68-year-old male presenting with personality changes, characteristic of Frontotemporal Dementia (FTD). Panel (a) shows an axial view and panel (b) shows a sagittal view using a rainbow color scale to map metabolic activity. These views demonstrate marked hypometabolism (purple/blue) in the frontal and temporal lobes, while metabolic activity is relatively preserved (green/yellow/red) in the parietal and occipital lobes, including the precuneus and posterior cingulate cortex (PCC). Panel (c) presents Single-Subject Statistical Parametric Mapping (ss-SPM) results. This analysis highlights significant negative deviation from control mean uptake values, visualized as blue and purple clusters overlaying brain templates across multiple slices (sagittal, axial, and coronal). The ss-SPM confirms a characteristic FTD pattern: predominant hypometabolism in the anterior cingulate and frontal regions compared to the posterior cingulate. This imaging profile serves as an educational example of how FDG-PET and quantitative SPM analysis can differentiate FTD from other neurodegenerative conditions like Alzheimer's disease.
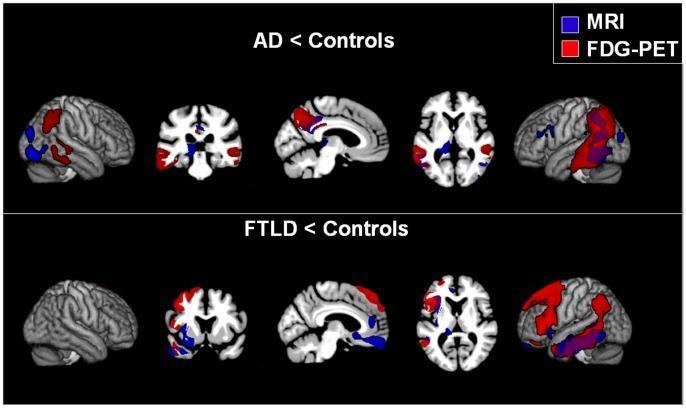
This diagnostic comparison chart displays neuroimaging results for Alzheimer’s disease (AD) and Frontotemporal Lobar Degeneration (FTLD) relative to healthy controls. The image utilizes statistical parametric mapping overlaid on brain templates in sagittal, coronal, and axial views. Red clusters indicate glucose hypometabolism (FDG-PET), blue clusters represent cortical atrophy (structural MRI), and violet regions show where atrophy and hypometabolism overlap. The upper panel (AD < Controls) demonstrates a characteristic pattern of hypometabolism in the parieto-mesial cortex, specifically the precuneus and posterior cingulate, with bilateral involvement of the lateral temporal and inferior parietal regions. The lower panel (FTLD < Controls) shows a distinct distribution concentrated in the fronto-median and fronto-lateral cortex, as well as the insula, with a marked lateralization to the left hemisphere. This visualization highlights the differential topographical patterns of neurodegeneration used to distinguish these two common forms of dementia through functional and structural imaging modalities.
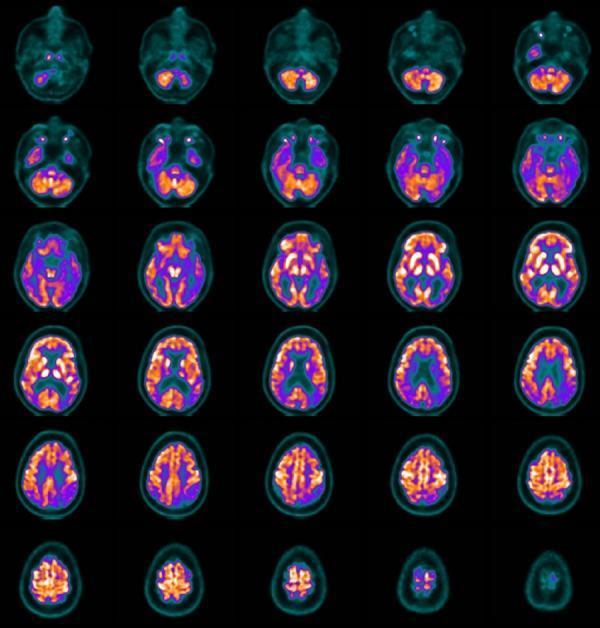
This diagnostic image set consists of 30 transversal slices from an FDG-PET (Fluorodeoxyglucose Positron Emission Tomography) scan of a patient with Alzheimer's disease. The color-coded metabolic map uses orange/red to represent high glucose metabolism and purple/blue for low metabolism (hypometabolism). The scans demonstrate a classic neurodegenerative pattern: marked hypometabolism is visible in the posterior cingulate cortex and the posterior temporoparietal association cortex. In contrast, the frontal lobes and primary motor/sensory cortices show relatively preserved metabolic activity, indicated by the higher intensity orange regions. This visual disparity between the hypoactive posterior regions and the normally active frontal regions is a key diagnostic hallmark used to differentiate Alzheimer's disease from other forms of dementia, such as frontotemporal dementia. The series provides a comprehensive view of global cerebral glucose utilization from the base of the brain through the vertex.
DAT SPECT DaTSCAN Parkinson disease dopamine transporter
![This diagnostic image set consists of axial [123I]FP-CIT SPECT (DaTscan) slices of a human brain, used to evaluate presynaptic dopamine transporter (DAT) density. The scans demonstrate a bilateral reduction in tracer uptake within the striatum, particularly affecting the posterior putamen. In a normal scan, the striatal uptake typically appears as a bright, comma-shaped or 'comma-like' signal representing the caudate nucleus and putamen. In these images, the signal is markedly diminished and more 'period-shaped,' indicating loss of dopaminergic neurons. There is a visible asymmetry in the signal intensity, with the left side showing a more pronounced deficit compared to the right, consistent with asymmetric neurodegeneration typical of Parkinson's disease. The color-coded heat map shows the highest concentration of DAT in the red/yellow regions, which are noticeably restricted in this patient. These findings are clinically significant for confirming presynaptic dopamine transporter loss to support a diagnosis of Parkinsonian syndrome in patients presenting with movement disorders like bradykinesia and tremors.](https://cdn.orris.care/cdss_images/pmc_clinical_VQA_db1fc2b2ec801bae952c8d6ff96e4d91bad2056dd0accd2bdd87fd1ec186484e.jpg)
This diagnostic image set consists of axial [123I]FP-CIT SPECT (DaTscan) slices of a human brain, used to evaluate presynaptic dopamine transporter (DAT) density. The scans demonstrate a bilateral reduction in tracer uptake within the striatum, particularly affecting the posterior putamen. In a normal scan, the striatal uptake typically appears as a bright, comma-shaped or 'comma-like' signal representing the caudate nucleus and putamen. In these images, the signal is markedly diminished and more 'period-shaped,' indicating loss of dopaminergic neurons. There is a visible asymmetry in the signal intensity, with the left side showing a more pronounced deficit compared to the right, consistent with asymmetric neurodegeneration typical of Parkinson's disease. The color-coded heat map shows the highest concentration of DAT in the red/yellow regions, which are noticeably restricted in this patient. These findings are clinically significant for confirming presynaptic dopamine transporter loss to support a diagnosis of Parkinsonian syndrome in patients presenting with movement disorders like bradykinesia and tremors.
![Diagnostic [123I]ioflupane (DaTSCAN) brain SPECT images in the axial plane, focusing on striatal dopamine transporter (DAT) activity. The image set is organized into two rows. The top row displays striatal phantom scans comparing 'clinical' (left) and 'research' (right) reconstruction algorithms; the clinical version shows smoother, more symmetrical bilateral high-intensity signals, while the research reconstruction exhibits higher granularity and sharper signal localization. The bottom row presents comparative clinical cases: the left image shows a healthy subject with normal, symmetrical, 'comma-shaped' tracer uptake in the caudate nucleus and putamen bilaterally. The right image shows a patient with Parkinson's disease, demonstrating a significant dopaminergic deficit characterized by marked asymmetry, reduced signal intensity, and a 'period-shaped' appearance due to the characteristic loss of uptake in the posterior putamen. These images illustrate the diagnostic utility of DAT imaging in differentiating healthy dopaminergic function from the neurodegenerative changes associated with Parkinsonian syndromes.](https://cdn.orris.care/cdss_images/pmc_clinical_VQA_e5adf6830d3c5972daefbaa61da8b8d2cd8fdb06d733aa02f7628f3c8e4753d1.jpg)
Diagnostic [123I]ioflupane (DaTSCAN) brain SPECT images in the axial plane, focusing on striatal dopamine transporter (DAT) activity. The image set is organized into two rows. The top row displays striatal phantom scans comparing 'clinical' (left) and 'research' (right) reconstruction algorithms; the clinical version shows smoother, more symmetrical bilateral high-intensity signals, while the research reconstruction exhibits higher granularity and sharper signal localization. The bottom row presents comparative clinical cases: the left image shows a healthy subject with normal, symmetrical, 'comma-shaped' tracer uptake in the caudate nucleus and putamen bilaterally. The right image shows a patient with Parkinson's disease, demonstrating a significant dopaminergic deficit characterized by marked asymmetry, reduced signal intensity, and a 'period-shaped' appearance due to the characteristic loss of uptake in the posterior putamen. These images illustrate the diagnostic utility of DAT imaging in differentiating healthy dopaminergic function from the neurodegenerative changes associated with Parkinsonian syndromes.
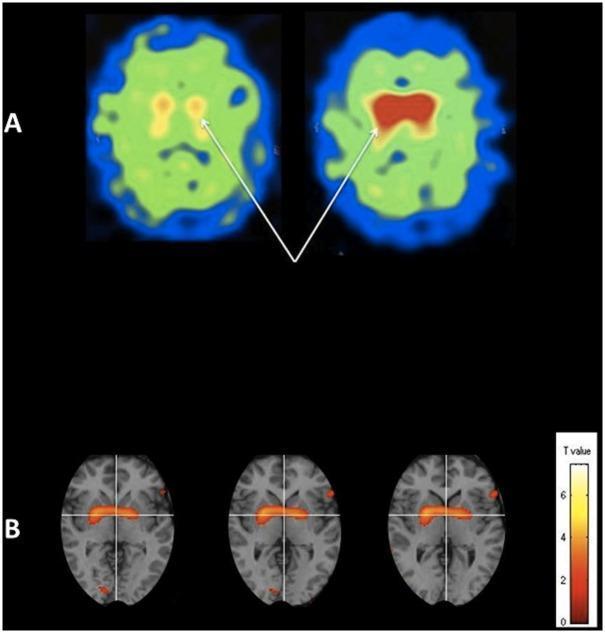
This composite diagnostic image illustrates the longitudinal effects of N-acetylcysteine (NAC) on dopamine transporter (DaT) availability in a Parkinson's disease patient. Section A displays two axial DaTscan (SPECT) images: 'pre-NAC' (left) and 'post-NAC' (right). The color-coded intensity maps show a transition from yellow/green to deep red in the striatum (caudate and putamen), indicated by arrows, signifying a substantial increase in dopamine transporter binding following treatment. Section B presents statistical parametric mapping (SPM8) results from a group-level paired t-test. Significant clusters (p < 0.05) are overlaid on axial T1-weighted MRI templates across three slices. These areas of significantly greater binding post-treatment are localized to the bilateral basal ganglia and are rendered in an orange-to-red color scale corresponding to T-values (0 to 6+). The visualization demonstrates both individual qualitative improvement in dopaminergic function and collective statistical significance in regional tracer uptake, relevant to clinical research in neurodegenerative disease management.
amyloid PET florbetapir florbetaben tau PET Alzheimer
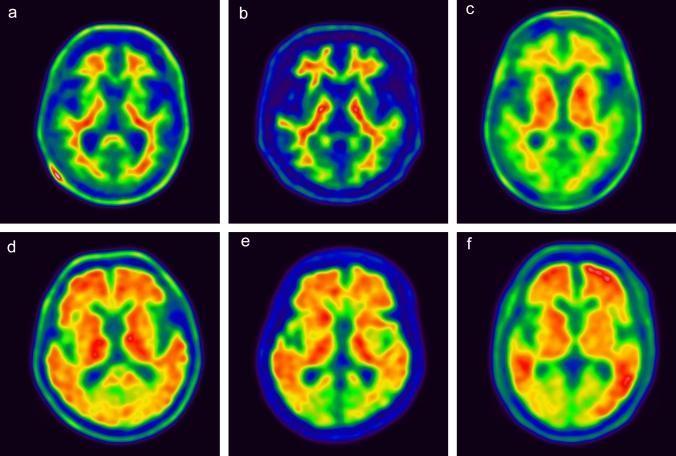
This Comparison Chart displays axial brain PET (Positron Emission Tomography) scans using three different amyloid-targeting radiopharmaceuticals: Florbetaben (FBB, panels a/d), Flutemetamol (FMM, panels b/e), and Florbetapir (FPN, panels c/f). The images are arranged to compare negative scans (upper row: a, b, c) with positive scans (lower row: d, e, f) using a rainbow color scale where warmer colors (red, orange, yellow) indicate higher radiopharmaceutical uptake and cooler colors (green, blue) indicate lower uptake. In the negative amyloid scans, tracer uptake is primarily localized to the white matter, maintaining a clear distinction from the cortical gray matter, which appears cool-toned. Notably, the FPN negative scan (c) shows higher striatal uptake compared to the others. In the positive scans, there is a diffuse, widespread increase in tracer uptake throughout the cortical regions (frontal, temporal, and parietal lobes), leading to a loss of the normal gray-white matter differentiation. This series illustrates the diagnostic visual markers for amyloid plaque deposition in Alzheimer's disease assessment across different PET tracers.
![This diagnostic image series presents six sagittal Positron Emission Tomography (PET) scans of the human brain, illustrating the uptake patterns of various Amyloid-beta (A̢) radiotracers in patients with Alzheimer’s disease. The tracers shown include [11C]PiB, [18F]Florbetaben, [18F]Flutemetamol, [18F]Florbetapir, [18F]Flutafuranol, and [18F]FIBT. The images use a pseudo-color scale where red/orange represents high signal intensity (higher plaque burden) and blue/green represents lower intensity. Most tracers demonstrate significant cortical uptake, particularly in the frontal, parietal, and temporal lobes, as well as the cingulate cortex. Variations in signal distribution are visible: [11C]PiB and [18F]Florbetapir show broad cortical involvement, whereas [18F]FIBT displays a more heterogeneous and localized distribution with lower overall intensity. This comparison highlights the differences in binding affinity, specificity, and pharmacokinetics among FDA-approved and experimental A̢ imaging agents, which are essential for the diagnosis and longitudinal monitoring of neurodegenerative amyloidopathies.](https://cdn.orris.care/cdss_images/pmc_clinical_VQA_b954a0b05f49e1d89b6997df217a505c82c699cfd478522762d6baf6b0aa87cc.jpg)
This diagnostic image series presents six sagittal Positron Emission Tomography (PET) scans of the human brain, illustrating the uptake patterns of various Amyloid-beta (A̢) radiotracers in patients with Alzheimer’s disease. The tracers shown include [11C]PiB, [18F]Florbetaben, [18F]Flutemetamol, [18F]Florbetapir, [18F]Flutafuranol, and [18F]FIBT. The images use a pseudo-color scale where red/orange represents high signal intensity (higher plaque burden) and blue/green represents lower intensity. Most tracers demonstrate significant cortical uptake, particularly in the frontal, parietal, and temporal lobes, as well as the cingulate cortex. Variations in signal distribution are visible: [11C]PiB and [18F]Florbetapir show broad cortical involvement, whereas [18F]FIBT displays a more heterogeneous and localized distribution with lower overall intensity. This comparison highlights the differences in binding affinity, specificity, and pharmacokinetics among FDA-approved and experimental A̢ imaging agents, which are essential for the diagnosis and longitudinal monitoring of neurodegenerative amyloidopathies.
18F-FDOPA PET brain Parkinson dopamine synthesis
![This composite educational graphic presents diagnostic imaging and quantitative analysis from a pre-clinical Parkinson’s disease study using mouse models. Panels A–D display coregistered coronal [18F]FDOPA PET/CT images of the brain across four experimental groups: (A) non-transgenic control, (B) hLRRK2 wild-type, (C) hLRRK2 R1441G hemizygous (HEM), and (D) hLRRK2 R1441G homozygous (HOM). The heatmaps represent the distribution of tracer uptake, where vibrant red/orange hotspots in the striatum indicate robust dopamine synthesis and storage in groups A and B. In contrast, groups C and D show a marked reduction in signal intensity in these regions, visualized as cooler yellow and green tones. Panel E is a dot plot with mean bars quantifying the average [18F]FDOPA uptake (SUV) in the striatum. Statistical significance markers (**, ***, ****) indicate that both the HEM and HOM R1441G transgenic groups have significantly lower striatal uptake compared to the hLRRK2 wild-type group. This visual content demonstrates nigrostriatal dopaminergic dysfunction associated with the LRRK2 R1441G mutation, serving as an educational resource for studying neurodegenerative disease biomarkers and metabolic imaging.](https://cdn.orris.care/cdss_images/pmc_clinical_VQA_fd5f12c58067b0a312b3e1e09fbee4c977b07947e2a183e9c4711bc46c8ad1d2.jpg)
This composite educational graphic presents diagnostic imaging and quantitative analysis from a pre-clinical Parkinson’s disease study using mouse models. Panels A–D display coregistered coronal [18F]FDOPA PET/CT images of the brain across four experimental groups: (A) non-transgenic control, (B) hLRRK2 wild-type, (C) hLRRK2 R1441G hemizygous (HEM), and (D) hLRRK2 R1441G homozygous (HOM). The heatmaps represent the distribution of tracer uptake, where vibrant red/orange hotspots in the striatum indicate robust dopamine synthesis and storage in groups A and B. In contrast, groups C and D show a marked reduction in signal intensity in these regions, visualized as cooler yellow and green tones. Panel E is a dot plot with mean bars quantifying the average [18F]FDOPA uptake (SUV) in the striatum. Statistical significance markers (**, ***, ****) indicate that both the HEM and HOM R1441G transgenic groups have significantly lower striatal uptake compared to the hLRRK2 wild-type group. This visual content demonstrates nigrostriatal dopaminergic dysfunction associated with the LRRK2 R1441G mutation, serving as an educational resource for studying neurodegenerative disease biomarkers and metabolic imaging.
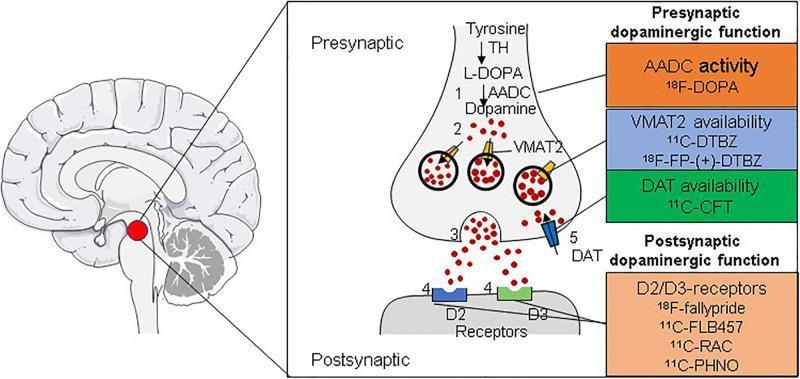
This medical illustration depicts a dopaminergic synapse within the brain, focusing on molecular targets for Positron Emission Tomography (PET) radiotracers used in diagnosing Parkinson's disease. The diagram is divided into presynaptic and postsynaptic components. The presynaptic section illustrates dopamine synthesis (Tyrosine to L-DOPA via TH, then to Dopamine via AADC), vesicular storage mediated by VMAT2, synaptic release, and reuptake via the dopamine transporter (DAT). Corresponding PET tracers are listed: 18F-DOPA for AADC activity; 11C-DTBZ and 18F-FP-(+)-DTBZ for VMAT2 availability; and 11C-CFT for DAT availability. The postsynaptic section identifies D2 and D3 receptors as primary targets, with listed tracers including 18F-fallypride, 11C-FLB457, 11C-RAC, and 11C-PHNO. A sagittal brain diagram provides anatomical context, highlighting the midbrain/striatal region as the focus of these neuroimaging techniques. The educational focus is on the in vivo assessment of dopaminergic terminal integrity and receptor status.
Radiotracers in CNS Brain Imaging: SPECT, PET/CT - Ligands, Mechanisms & Clinical Applications
1. Principles of Molecular Brain Imaging
| Feature | SPECT | PET/CT |
|---|---|---|
| Radiation | Single photon (gamma emitter) | Positron emitter (annihilation photons) |
| Resolution | ~8-10 mm | ~4-6 mm |
| Radionuclides | 99mTc, 123I, 133Xe | 18F, 11C, 15O, 13N, 68Ga |
| Half-life | Hours to days | Minutes to ~2 hours |
| Cost/Availability | Lower cost, more widely available | Higher cost, needs cyclotron or generator |
| Clinical advantage | Industrial production of tracers, long shelf life | Higher resolution and quantification |
2. SPECT Radiotracers in CNS Imaging
A. Cerebral Blood Flow (CBF) / Perfusion
| Tracer | Ligand | Target | Clinical Use |
|---|---|---|---|
| 99mTc-HMPAO (Ceretec) | Hexamethylpropylene amine oxime | CBF/perfusion | Stroke, dementia, epilepsy, psychiatric disorders |
| 99mTc-ECD (Neurolite) | Ethyl cysteinate dimer | CBF/perfusion | Stroke localization, epilepsy focus |
| 133Xe (xenon) | Noble gas | CBF (quantitative) | Cerebrovascular disease |
- Alzheimer's disease: Characteristic posterior cingulate, temporal and parietal hypoperfusion
- FTD: Frontal and anterior temporal lobe hypoperfusion
- Vascular dementia: Patchy deficits matching infarct territories
- DLB: Occipital hypoperfusion (distinctive)
- Epilepsy: Ictal hyperperfusion at seizure focus vs. interictal hypoperfusion
B. Dopamine Transporter (DAT) SPECT
| Tracer | Ligand (Chemical Name) | Notes |
|---|---|---|
| 123I-FP-CIT (DaTSCAN) | 123I-N-[3-fluoropropyl]-2β-carbomethoxy-3β-[4-iodophenyl] | FDA-approved; most widely used |
| 123I-β-CIT | 123I-β-carbomethoxy-3β-[4-iodophenyl]tropane | Also binds SERT |
| 99mTc-TRODAT-1 | 99mTc-labeled tropane derivative | First 99mTc-labeled DAT ligand; practical for routine use |
- Parkinson's disease (PD): Asymmetric putaminal loss
- Dementia with Lewy bodies (DLB): Bilateral DAT reduction; differentiates from Alzheimer's
- Multisystem atrophy (MSA) / PSP: Bilateral reduction
- Essential tremor: Normal DaTSCAN (useful to differentiate from PD)
3. PET/CT Radiotracers in CNS Imaging
A. Metabolic Imaging - 18F-FDG
- FDG enters cells via glucose transporters, is phosphorylated by hexokinase, and is trapped (cannot continue glycolysis) → accumulates proportionally to metabolic activity
- The brain normally shows uniform, symmetric high FDG uptake in cortex, basal ganglia, and thalamus
| Disease | Pattern of Hypometabolism |
|---|---|
| Alzheimer's disease | Posterior cingulate, temporoparietal, precuneus (frontal and motor cortex spared early) |
| Frontotemporal dementia (FTD) | Frontal lobes + anterior temporal lobes |
| DLB | Occipital + parietal; posterior cingulate relatively spared vs AD |
| Vascular dementia | Patchy, corresponding to infarcts |
| PSP/CBD | Frontal > temporal; midbrain involvement |
| Epilepsy (interictal) | Hypometabolism at seizure focus |
| Brain tumors | High FDG in high-grade glioma; low in low-grade |
B. Amyloid PET Tracers
| Tracer | Ligand | Radionuclide | FDA Approval |
|---|---|---|---|
| 11C-PiB (Pittsburgh Compound B) | N-methyl-[11C]2-(4'-methylaminophenyl)-6-hydroxybenzothiazole | 11C | Research use |
| 18F-Florbetapir (Amyvid) | (E)-4-(2-(6-(2-(2-(2-[18F]fluoroethoxy)ethoxy)ethoxy)pyridin-3-yl)vinyl)-N-methylaniline | 18F | FDA-approved 2012 |
| 18F-Florbetaben (Neuraceq) | Trans-florbetaben | 18F | FDA-approved 2014 |
| 18F-Flutemetamol (Vizamyl) | 2-[18F]fluoro-3-(2-S)-2,2,2-trifluoro-1-methylethyl)-phenyl-1-naphthol | 18F | FDA-approved 2013 |
| 18F-Flutafuranol (Centiloid) | AZD4694 | 18F | Approved 2020 |
- Negative: Tracer stays in white matter; clear gray-white contrast - rules out Alzheimer's
- Positive: Diffuse cortical gray matter uptake; loss of gray-white differentiation = amyloid plaques present (frontal, parietal, temporal lobes, posterior cingulate)
C. Tau PET Tracers
| Tracer | Ligand | Target Tau |
|---|---|---|
| 18F-Flortaucipir (Tauvid / AV-1451) | 7-(6-[18F]fluoropyridin-4-yl)-5H-pyrido[4,3-b]indole | AD-pattern tau (3R/4R) |
| 18F-MK-6240 | - | AD tau |
| 18F-RO948 | - | AD tau |
| 18F-PI-2620 | - | 4R tauopathies (PSP, CBD) |
| FDDPN | - | Amyloid plaques + tau tangles |
D. Dopaminergic System PET Tracers
Presynaptic - Dopamine Synthesis
| Tracer | Target | Notes |
|---|---|---|
| 18F-FDOPA (18F-Fluoro-L-DOPA) | AADC (aromatic amino acid decarboxylase) activity | Measures dopamine synthesis capacity in striatum; reduced in PD |
Presynaptic - DAT (Dopamine Transporter)
| Tracer | Ligand | Notes |
|---|---|---|
| 11C-CFT | [11C]2β-carbomethoxy-3β-(4-fluorophenyl)tropane | Cocaine derivative; DAT binding |
| 18F-FE-PE2I | - | High resolution DAT PET |
Vesicular Monoamine Transporter 2 (VMAT2)
| Tracer | Chemical Name | Notes |
|---|---|---|
| 11C-DTBZ | [11C]dihydrotetrabenazine | VMAT2 availability in striatum; marker of dopaminergic terminals |
| 18F-FP-(+)-DTBZ | - | Longer half-life than 11C |
Postsynaptic - D2/D3 Receptors
| Tracer | Chemical Name | Notes |
|---|---|---|
| 11C-Raclopride | [11C]raclopride | D2/D3 antagonist; gold standard for striatal D2 |
| 18F-Fallypride | [18F]fallypride | D2/D3; images extrastriatal regions (frontal cortex) |
| 11C-NMSP | [11C]N-methylspiperone | First successful in vivo D2 imaging tracer; also 5-HT2A in cortex |
| (+)-11C-PHNO | (+)-[11C]propyl-hexahydro-naphtho-oxazine | D3-preferring agonist; used in schizophrenia research |
E. Serotonergic System PET Tracers
| Tracer | Full Name | Target |
|---|---|---|
| 11C-DASB | [11C]3-amino-4-[2-(dimethylaminomethylphenylthio)]benzonitrile | SERT (serotonin transporter) |
| 11C-NMSP | [11C]N-methylspiperone | 5-HT2A receptors in cortex |
| 18F-Altanserin | - | 5-HT2A receptors |
| 11C-CIMBI-36 | - | 5-HT2A agonist PET |
F. Cholinergic System PET Tracers
| Tracer | Full Name | Target |
|---|---|---|
| 11C-MP4A | N-[11C]methylpiperidin-4-yl acetate | Acetylcholinesterase (AChE) activity |
| 11C-NMPB | [11C]N-methyl-4-piperidyl benzylate | Muscarinic AChR (mAChR) |
| 11C-GSK1034702 | - | mAChR subtype 1 |
| 18F-FAZAN / 2-18F-FA / 6-18F-FA | Various | Nicotinic AChR subtype α4β2 |
| 18F-ASEM | - | Nicotinic α7 subtype |
G. Neuroinflammation / TSPO Tracers
| Tracer | Chemical Name | Notes |
|---|---|---|
| 11C-PK11195 | [11C]1-(2-chlorophenyl)-N-methyl-N-(1-methylpropyl)-3-isoquinoline carboxamide | Prototype TSPO ligand; most studied |
| 18F-FEPPA | N-(2-(2-[18F]fluoroethoxy)benzyl)-N-(4-phenoxypyridin-3-yl)acetamide | Second-generation TSPO |
| 18F-GE-180 | - | Third-generation; lower non-specific binding |
| 11C-DPA713 / 18F-DPA714 | - | Second-generation TSPO |
- Alzheimer's disease: Activated microglia adjacent to amyloid plaques
- Multiple sclerosis: Active plaques show TSPO upregulation
- Stroke/TBI: Post-injury neuroinflammation mapping
- Encephalitis: Active inflammation mapping
H. Cannabinoid Receptor PET Tracers
| Tracer | Target | Notes |
|---|---|---|
| 11C-OMAR | CB1 receptors | Broad CNS CB1 imaging |
| 18F-MK-9470 | CB1 receptors | Used in schizophrenia, addiction research |
| 3H-MePPEP | CB1 receptors | Research use |
I. Glutamate/GABA/Glycine System Tracers
| Tracer | Target | Chemical Name |
|---|---|---|
| 18F-FMEZ / 18F-JMZ | GABA-A (benzodiazepine site) | [18F]fluoroflumezanil |
| 11C-flumazenil | GABA-A benzodiazepine receptors | Epilepsy focus localization |
| 11C-GSK931145 | Glycine transporter 1 (GlyT1) | Schizophrenia research |
J. Vesicular Acetylcholine Transporter (VAChT)
| Tracer | Chemical Name | Notes |
|---|---|---|
| 123I-BVM (SPECT) | [123I]iodobenzovesamicol | Vesicular ACh transporter in cholinergic terminals |
4. Disease-Specific Imaging Summary
Alzheimer's Disease (AD)
| Modality | Tracer | Findings |
|---|---|---|
| FDG-PET | 18F-FDG | Posterior cingulate, temporoparietal, precuneus hypometabolism |
| Amyloid-PET | 18F-Florbetapir / Florbetaben / Flutemetamol | Cortical amyloid deposition (positive = gray-white contrast loss) |
| Tau-PET | 18F-Flortaucipir | Inferior temporal, posterior cortex tau (Braak staging) |
| SPECT | 99mTc-HMPAO | Posterior cingulate + parietal hypoperfusion |
Parkinson's Disease (PD) / Parkinsonism
| Modality | Tracer | Findings |
|---|---|---|
| DAT-SPECT | 123I-FP-CIT (DaTSCAN) | Asymmetric putaminal loss; "period-shaped" |
| DAT-SPECT | 99mTc-TRODAT-1 | Putaminal DAT reduction |
| PET | 18F-FDOPA | Reduced striatal uptake (dopamine synthesis) |
| PET | 11C-DTBZ / VMAT2 | Reduced terminal density |
| PET | 11C-Raclopride | D2 receptor upregulation (compensatory) in early PD |
Dementia with Lewy Bodies (DLB)
- DAT-SPECT: Reduced (differentiates DLB from AD)
- FDG-PET: Occipital hypometabolism + parietal (not typically seen in AD)
- 18F-FDOPA PET: Reduced striatal uptake
Epilepsy
| Phase | Tracer | Finding |
|---|---|---|
| Ictal | 99mTc-HMPAO SPECT | Hyperperfusion at seizure focus |
| Interictal | 99mTc-HMPAO SPECT | Hypoperfusion at seizure focus |
| Interictal | 18F-FDG PET | Hypometabolism at focus |
| - | 11C-Flumazenil PET | Reduced GABA-A receptors at epileptic focus |
Schizophrenia
- 11C-Raclopride / 18F-Fallypride PET: D2/D3 receptor density; excess intrasynaptic dopamine confirmed (dopamine hypothesis)
- (+)-11C-PHNO: D3-preferring imaging
- 11C-DASB: Serotonin transporter
- 11C-NMSP: 5-HT2A cortical receptors - reduced in schizophrenia
Depression
- 11C-DASB PET: Reduced SERT binding in midbrain and limbic regions
- FDG-PET: Frontal hypometabolism
- 18F-Altanserin: 5-HT2A changes
Brain Tumors
- 18F-FDG PET: High-grade glioma = hypermetabolism; low-grade = iso/hypometabolic
- 11C-Methionine PET: Amino acid tracer; superior to FDG for low-grade tumors; marks protein synthesis
- 18F-FDOPA PET: Amino acid analogue; excellent for glioma delineation; not confounded by cortical glucose uptake
- 18F-FET (fluoroethyl-tyrosine) PET: Widely used in Europe for glioma; useful for radiotherapy planning and recurrence vs. radiation necrosis
Multiple Sclerosis (MS)
- TSPO PET (11C-PK11195, 18F-FEPPA): Active microglial inflammation in plaques and normal-appearing white matter
- Myelin PET (11C-MeDAS / Myelivid): New tracer; first class to directly image myelin; awaiting broader clinical use
Huntington's Disease
- 11C-Raclopride PET: D2 receptor loss in striatum (precedes clinical onset)
- FDG-PET: Caudate + putamen hypometabolism early
Stroke / Cerebrovascular Disease
- 99mTc-HMPAO SPECT: CBF mapping; penumbra vs. infarct
- 15O-water PET: Gold standard for quantitative CBF
- 18F-FDG PET: Metabolic depression (diaschisis)
5. Key Physical Properties of Common Radionuclides
| Radionuclide | Half-Life | Decay | Key Tracers |
|---|---|---|---|
| 18F | 110 min | β+ | FDG, Florbetapir, Fallypride, FDOPA |
| 11C | 20 min | β+ | Raclopride, DTBZ, PiB, DASB, PK11195 |
| 15O | 2 min | β+ | Water (CBF), O2 (CMRO2) |
| 13N | 10 min | β+ | Ammonia |
| 68Ga | 68 min | β+ | PSMA (prostate; limited CNS use) |
| 99mTc | 6 hr | γ | HMPAO, ECD, TRODAT-1 |
| 123I | 13 hr | γ | FP-CIT (DaTSCAN), β-CIT |
| 133Xe | 5.2 days | γ | Cerebral blood flow |
6. Comprehensive Radiotracer Table by Neurotransmitter System
| Target System | Tracer | Chemical Name |
|---|---|---|
| AChE activity | [11C]MP4A | N-[11C]methylpiperidin-4-yl acetate |
| CB1 receptors | [11C]OMAR | [11C]1-(2,4-dichlorophenyl)-4-cyano-5-(4-methoxyphenyl)-N-(piperidin-1-yl) |
| CB1 receptors | [18F]MK-9470 | N-[2-(3-cyano-phenyl)-3-(4-(2-[18F]fluoroethoxy)phenyl)...] |
| DAT | [123I]β-CIT | [1,4]oxazin-9-ol β-CIT |
| GABA-A | [18F]JMZ | [18F]fluoroflumezanil |
| GlyT1 | [11C]GSK931145 | N-(1-[11C]H3)dimethylamino(cyclopentyl)(phenyl)methyl)-2,6-dimethylbenzamide |
| mAChR | [11C]NMPB | [11C]N-methyl-4-piperidyl benzylate |
| mAChR1 | [11C]GSK1034702 | [11C]4-fluoro-6-methyl-1-(piperidin-4-yl)-benzimidazol-2-one derivative |
| nAChR α4β2 | 2-[18F]FA / 6-[18F]FA | Fluoropyridine-azetidine derivatives |
| nAChR α7 | [18F]ASEM | - |
| TSPO | [18F]FEPPA | N-(2-(2-[18F]fluoroethoxy)benzyl)-N-(4-phenoxypyridin-3-yl)acetamide |
| VAChT | [123I]BVM | [123I]iodobenzovesamicol |
| VMAT2 | [11C]DTBZ | [11C]dihydrotetrabenazine |
| SERT | [11C]DASB | [11C]3-amino-4-[2-(dimethylaminomethylphenylthio)]benzonitrile |
| D2/D3 | [11C]Raclopride | Benzamide derivative |
| D2/D3 agonist | (+)-[11C]PHNO | (+)-propyl-hexahydro-naphtho-oxazine |
| D2/D3 (extrastriatal) | [18F]Fallypride | Benzamide derivative |
7. Emerging & Novel Tracers (2024-2026)
- Myelin PET - 11C-MeDAS (Myelivid): First PET tracer for direct myelin quantification; for MS, TBI, white matter disorders (Cleveland Clinic initiative)
- 18F-Cholestify (CYP46A1): Targets CYP46A1 enzyme which eliminates brain cholesterol; for neurodegenerative disease assessment
- [18F]SynVesT-1 / SDM-8: Synaptic density imaging via SV2A (synaptic vesicle protein); correlates with synaptic loss in epilepsy, AD, PD
- TSPO 3rd generation: Reduced binding site polymorphism issue (rs6971 genotype problem)
- 11C-UCB-J: Binds SV2A (synaptic vesicle glycoprotein 2A) - direct synaptic density imaging
All about Post acl graft assesment of knee MRI- include all possible values,angle tunnel assemnt all
ACL graft MRI assessment tunnel angles tibial femoral values normal findings 2024
https://pmc.ncbi.nlm.nih.gov/articles/PMC5065670
https://www.kjronline.org/DOIx.php?id=10.3348%2Fkjr.2016.17.…
ACL graft MRI knee tunnel position femoral tibial assessment
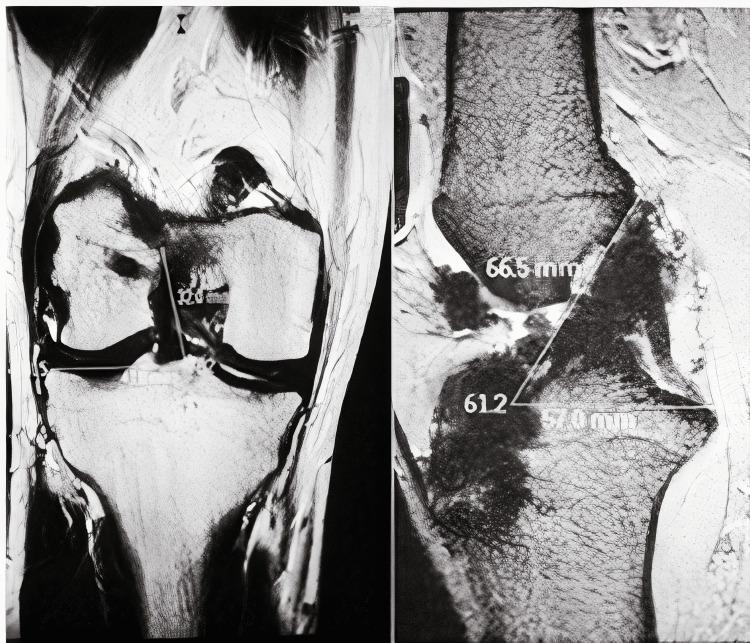
This diagnostic image provides a split-view MRI assessment of a knee joint following a double-bundle anterior cruciate ligament (ACL) reconstruction. The left panel shows a coronal view, highlighting the femoral condyles, the tibial plateau, and the intra-articular space where the graft is positioned. A linear measurement of 32.0 mm is applied to the graft structure within the intercondylar notch. The right panel displays a sagittal or oblique view focused on the tibial and femoral tunnel placement. Critical surgical planning or post-operative measurements are visible, including a tunnel length of 66.5 mm, a tibial width measurement of 57.0 mm, and a graft inclination angle indicated as 61.2 degrees. The imaging demonstrates the anatomical relationship between the distal femur, proximal tibia, and the reconstructed ligamentous tissue, which is essential for evaluating graft tension and tunnel positioning in sports medicine and orthopedic surgery.
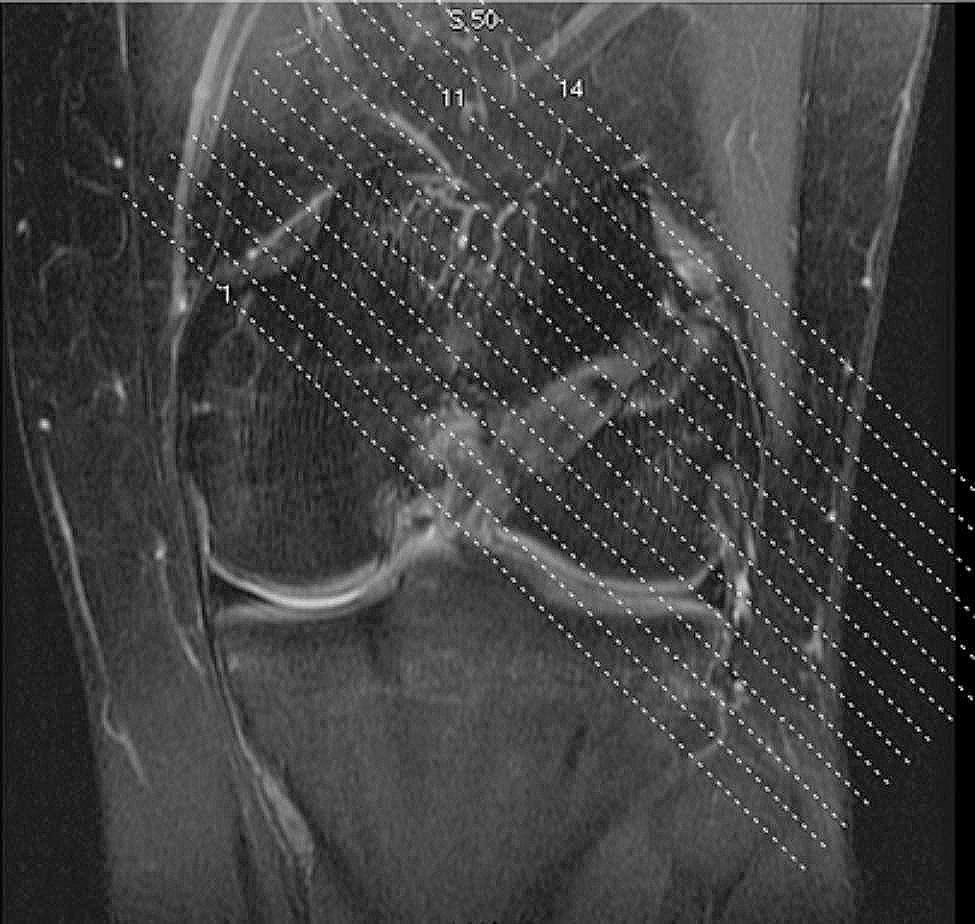
This diagnostic image is a T2-weighted sagittal MRI scan of a human knee joint, captured six months post-Anterior Cruciate Ligament (ACL) reconstruction. The image provides a detailed view of the femoral condyles, the tibial plateau, and the joint space with visible articular cartilage layers. A primary focus is the femoral bone tunnel and the reconstructed ACL graft, which are being assessed for postoperative outcomes. Superimposed on the anatomical scan is a grid of numbered, diagonal white dotted lines (ranging from labels 5.50 to 14). These lines represent the planning of cross-sectional scan layers, oriented perpendicular to the long axis of the femoral bone tunnel. This specialized imaging plane is used for the precise measurement of bone tunnel enlargement and to evaluate the integration of the graft. The image demonstrates key concepts in orthopedic radiology, including postoperative graft assessment, tunnel positioning, and MRI slice acquisition planning for musculoskeletal analysis.
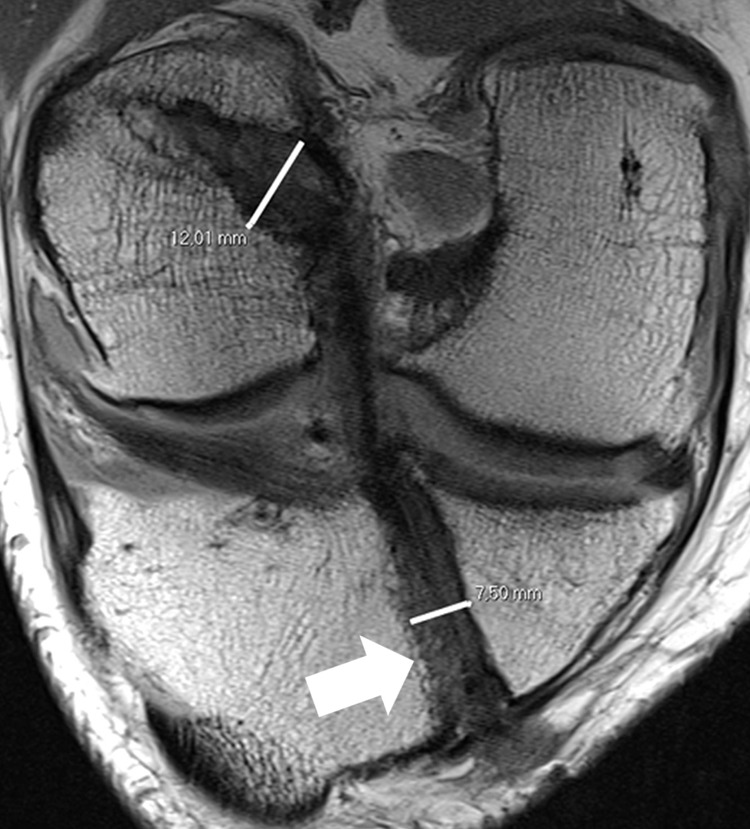
**Imaging Modality:** Oblique coronal proton density-weighted (PDW) magnetic resonance imaging (MRI). **Anatomical Region:** Right knee joint focusing on the intercondylar notch and proximal tibia. **Observed Pathology/Post-operative Status:** Status post-anterior cruciate ligament (ACL) reconstruction. The image demonstrates the morphology of the surgical tunnels and the ACL graft. **Characteristic Visual Features:** * **Femoral Tunnel:** An anteromedial (AM) femoral tunnel is visible with a conical, widened morphology, measured at a diameter of 12.01 mm. * **Tibial Tunnel:** An evenly narrowed tibial AM tunnel is observed, measured at 7.50 mm. * **ACL Graft:** A continuous, low-signal intensity band representing the ACL graft is seen traversing the joint space between the femoral and tibial tunnels. * **Hardware:** A white arrow indicates the position of an interference screw within the tibial tunnel, partially obscured by susceptibility artifact. **Differentiating Features:** The image highlights tunnel widening (conical femoral tunnel) versus uniform tunnel maintenance (tibial tunnel), which is critical for assessing post-operative graft stability and potential tunnel osteolysis.
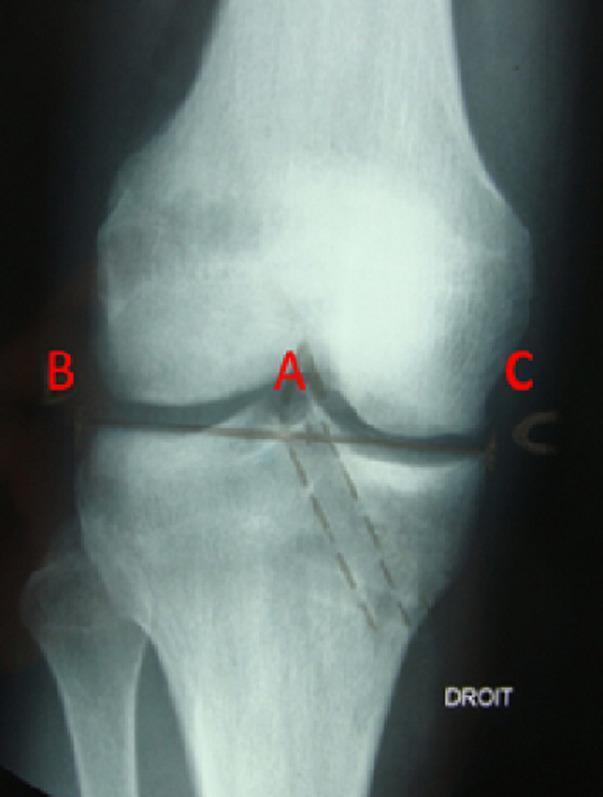
This anterior-posterior (AP) radiograph of a human right knee demonstrates a post-operative assessment of an anterior cruciate ligament (ACL) reconstruction. The image focuses on the evaluation of the tibial tunnel position using the Romano method. Key anatomical structures visible include the distal femur, proximal tibia, fibula, and the knee joint space. A radiolucent tibial tunnel is clearly visible, demarcated by dashed lines, following an oblique trajectory from the medial aspect of the proximal tibia toward the intercondylar eminence. Lettered annotations (A, B, and C) facilitate the measurement of the tunnel's exit point relative to the tibial plateau's width (B-C). Specifically, point A indicates the center of the tunnel's articular exit near the medial tibial spine. Surgical hardware, likely representing metallic staples or sutures, is faintly visible near the joint line and lateral femoral cortex. This diagnostic image is used in orthopedic surgery to ensure anatomical tunnel placement, which is critical for graft isometricity and preventing post-operative graft impingement or failure.
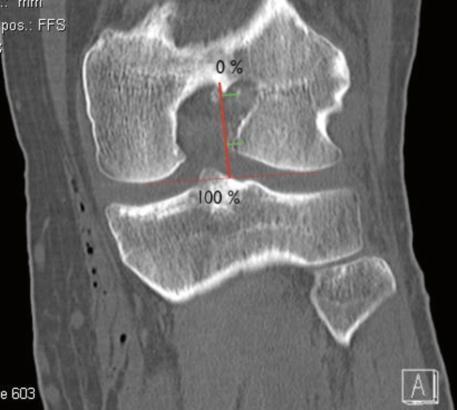
This diagnostic image is a coronal CT reconstruction of the human knee joint, specifically the distal femur and proximal tibia/fibula. The image illustrates a radiological assessment of femoral tunnel positioning following Anterior Cruciate Ligament (ACL) reconstruction, utilizing the method described by Hoser et al. (2005). Visible landmarks include the medial and lateral femoral condyles, the intercondylar notch, and the tibial plateau. A clear surgical femoral tunnel appears as a dark, circular lucency within the lateral femoral condyle near the notch roof. Superimposed red reference lines facilitate measurement: one horizontal line tangent to the most distal points of the femoral condyles and a perpendicular vertical line extending from the intracondylar roof to the distal condylar line. This vertical line is labeled with '0%' at the roof and '100%' at the distal level, serving as a coordinate system to quantify the tunnel's proximal-distal position. This clinical imaging is used in orthopedics to evaluate surgical accuracy and graft placement stability.
ACL graft MRI Figueroa score graft signal ligamentization posterior tibial slope failure risk assessment
ACL graft MRI signal intensity normal ligamentization maturation knee
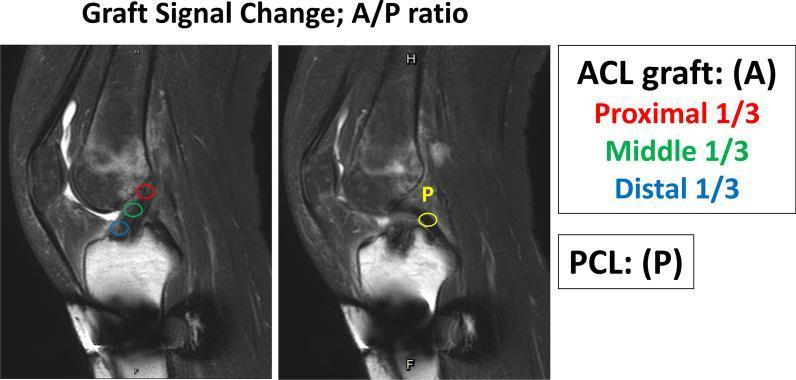
This diagnostic image displays two side-by-side sagittal T2-weighted MRI scans of a human knee joint, illustrating the methodology for assessing Anterior Cruciate Ligament (ACL) graft maturation. The images demonstrate the placement of Regions of Interest (ROIs) used to measure signal intensity. In the left panel, three circular ROIs are color-coded along the intra-articular course of the ACL graft: red for the proximal third (near the femoral tunnel), green for the middle third, and blue for the distal third (near the tibial tunnel). In the right panel, a yellow circular ROI labeled 'P' is placed on the mid-substance of the Posterior Cruciate Ligament (PCL), which serves as a hypointense reference point for signal normalization. The visual focuses on the 'A/P ratio'—a quantitative metric comparing graft signal (A) to the PCL signal (P)—to track ligamentization post-reconstruction. This clinical imaging tool is used in sports medicine and orthopedics to evaluate the biological healing of hamstring tendon grafts within the joint environment.
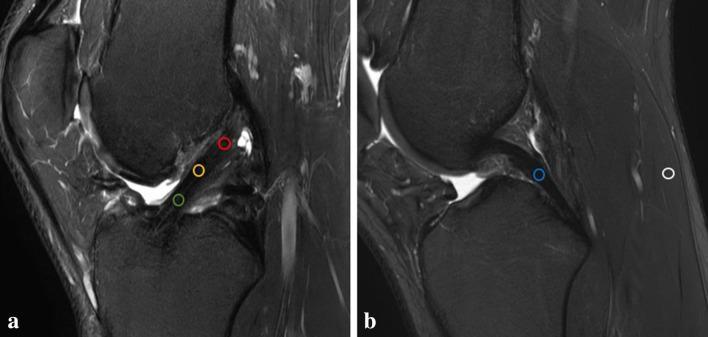
Two sagittal proton-density (PD) intermediate-weighted MRI scans of the knee (labeled A and B) demonstrating regions of interest (ROI) for measuring signal intensity of an anterior cruciate ligament (ACL) autograft. Image A shows three 4 mm circular ROIs along the intraarticular course of the ACL graft: proximal (red), mid-substance (yellow), and distal (green). Image B identifies internal reference points used for signal normalization: the mid-substance of the posterior cruciate ligament (PCL, blue circle) and the medial head of the gastrocnemius muscle (white circle). The images illustrate a standardized method for calculating the ACL/PCL signal ratio (APR) and the ACL/muscle ratio (AMR) to monitor the graft maturation and ligamentization process postoperatively. The primary anatomical structures visible include the femoral condyle, tibial plateau, reconstructed ACL, intact PCL, and posterior musculature.
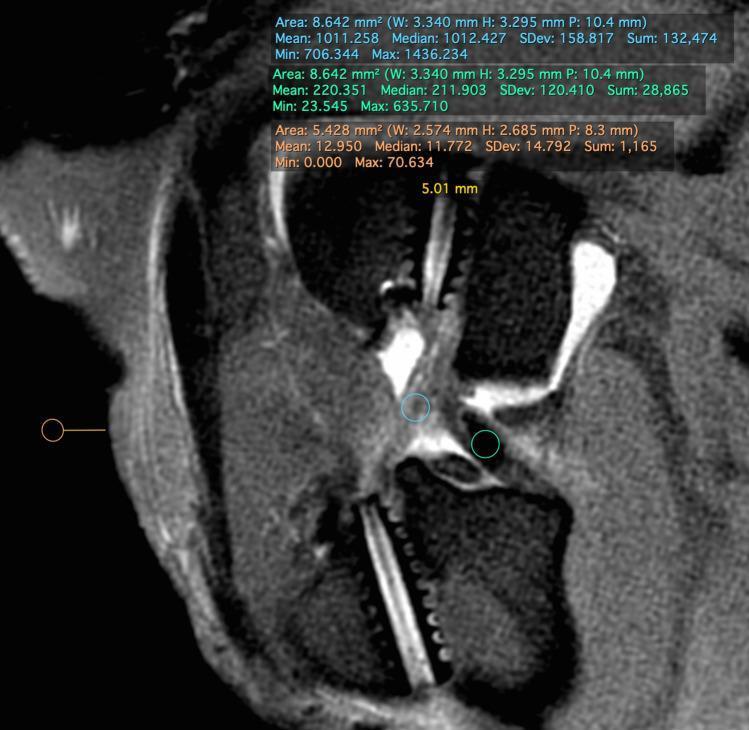
A diagnostic MRI image of a sagittal oblique PD-STIR section of a stifle (knee) joint, illustrating the methodology for calculating the signal-to-noise quotient (SNQ) to assess graft maturation. The image displays three specific Regions of Interest (ROIs): a blue circular ROI positioned over the intra-articular ligament graft, a green circular ROI placed over the posterior cruciate ligament (PCL) to serve as an internal reference, and an orange circular ROI located cranial to the skin edge to measure background signal intensity. Quantitative data overlays at the top of the image provide detailed pixel intensity statistics for each ROI, including area (mm²), mean, median, standard deviation, and range. This radiological technique is used in orthopedic research to objectively quantify the signal intensity of an ACL or similar graft relative to healthy ligamentous tissue and background noise, where a lower SNQ value indicates more advanced ligamentization and graft healing.
cyclops lesion ACL graft impingement knee MRI
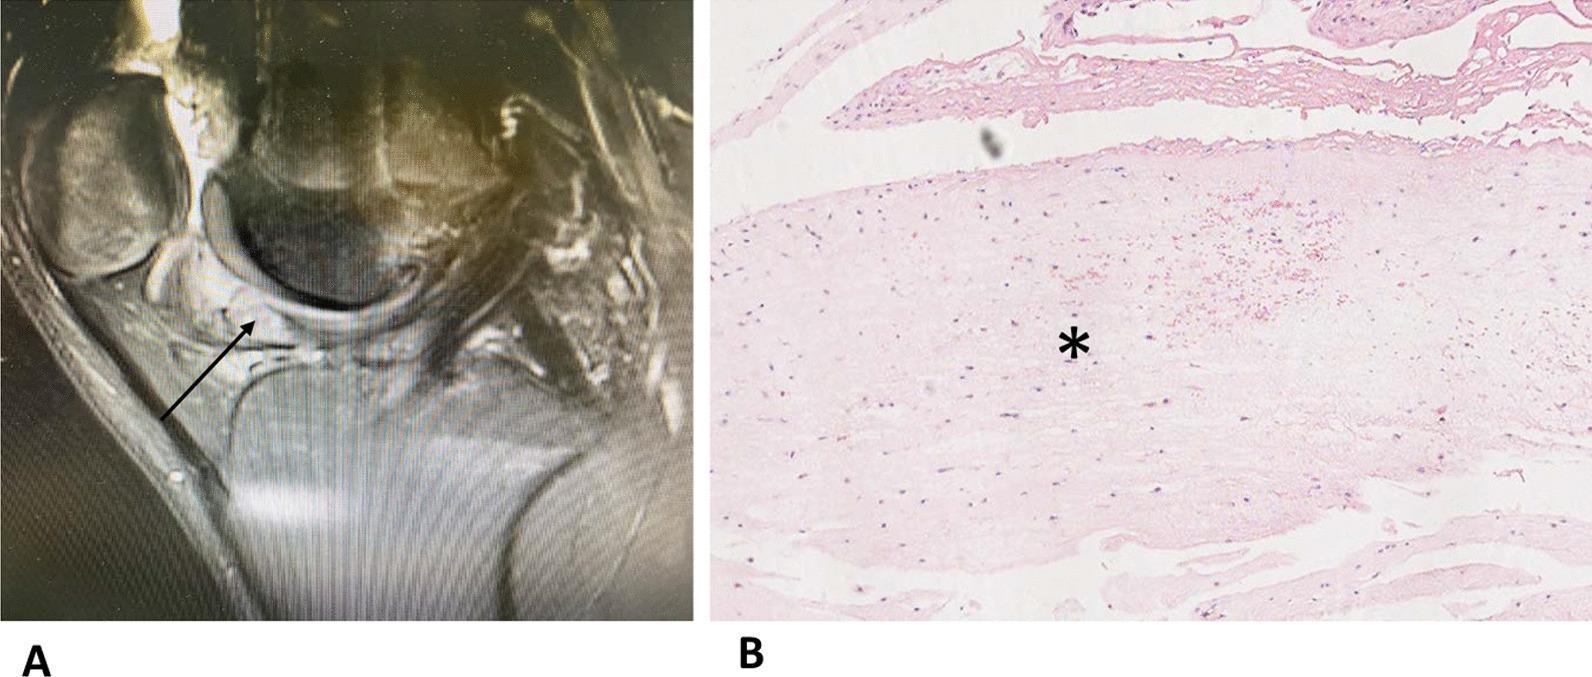
This composite educational figure illustrates the clinical imaging and histopathology of a cyclops lesion (localized arthrofibrosis) following anterior cruciate ligament (ACL) reconstruction. Panel A shows a sagittal T2-weighted or proton density-weighted MRI of the knee. An arrow highlights the pathognomonic cyclops lesion: a well-defined, low-to-intermediate signal intensity nodule situated within the anterior intercondylar notch, anterior to the ACL graft. The lesion demonstrates typical morphology that can cause extension deficit by mechanical impingement. Panel B provides a corresponding histopathological view via light microscopy (H&E stain). The section, marked with an asterisk, shows dense, hypocellular fibrous connective tissue. The tissue exhibits a relatively uniform, wavy collagenous texture with scattered spindle-shaped fibroblasts, closely resembling the organized structure of tendinous or ligamentous tissue. This comparison facilitates the understanding of postoperative complications in orthopedic surgery, specifically the fibroproliferative response of ACL remnants or graft material that leads to symptomatic intra-articular masses.
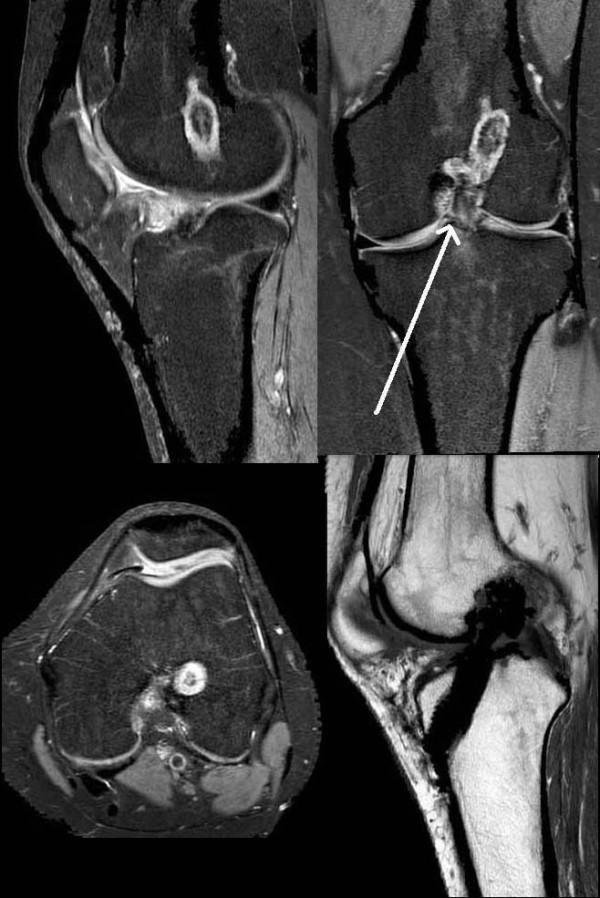
This composite diagnostic image displays multiple MRI views of a human knee joint following anterior cruciate ligament (ACL) reconstruction. The imaging set includes Proton Density-Weighted Fat-Suppressed (PDW FS) sequences in sagittal (top left), coronal (top right), and axial (bottom left) planes, alongside a T1-weighted Turbo Spin Echo (TSE) sagittal sequence (bottom right). The images demonstrate the status of an ACL graft, which appears continuous. A key pathological finding is a focal, low-to-intermediate signal intensity mass located anterior to the ACL graft near the tibial insertion, characteristic of a 'cyclops lesion' (localized anterior arthrofibrosis). This lesion is most clearly demarcated on the sagittal and coronal views (indicated by a white arrow in the coronal plane). The MRI also shows surgical hardware artifacts in the femoral and tibial tunnels. The patellofemoral compartment and joint space are visible across planes to assess for secondary signs of graft dysfunction, such as impingement or altered knee mechanics.
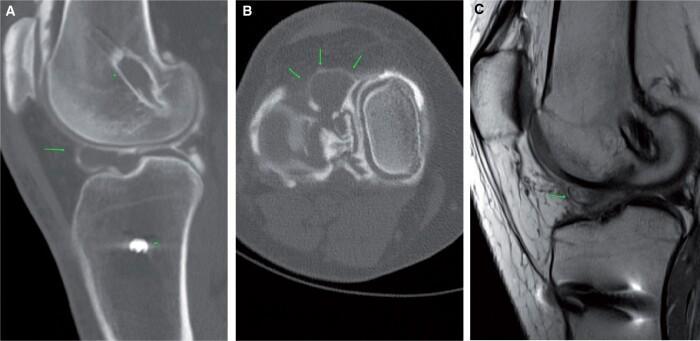
This composite figure presents diagnostic imaging of a cyclops lesion, a common complication following anterior cruciate ligament (ACL) reconstruction. Image A is a sagittal CT arthrogram showing focal soft tissue thickening in the Hoffa’s fat pad region, with visible hardware from a prior ACL repair in the tibia and femur. Image B is a corresponding axial CT arthrogram slice highlighting a well-defined, rounded, 'ballooning' soft tissue mass (indicated by green arrows) located within the anterior intercondylar notch. Image C provides a comparison using a PD-weighted sagittal MRI, which demonstrates a developing cyclops lesion (green arrow) that appears as a low-to-intermediate signal intensity mass anterior to the ACL graft. This collection illustrates the characteristic morphology and anatomical location of localized anterior arthrofibrosis, which clinically correlates with a loss of terminal knee extension. The images highlight the utility of multi-planar CT and MRI in identifying these postoperative soft tissue impingement lesions.
Blumensaat line ACL graft angle tibial tunnel sagittal knee MRI
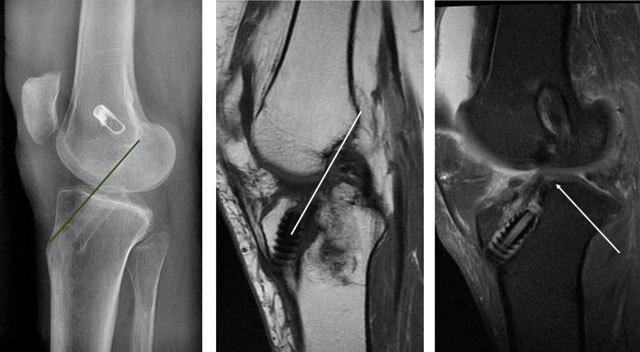
A comparative diagnostic series of the knee joint post-anterior cruciate ligament (ACL) reconstruction. (a) Lateral radiograph demonstrating optimal tibial tunnel positioning. A reference line (Blumensaat’s line) is superimposed, showing the tunnel exit situated entirely posterior to the line of the intercondylar roof, preventing impingement. (b) Sagittal T1-weighted MRI and (c) Sagittal T2-weighted MRI of a different patient demonstrating suboptimal, anterior tibial tunnel placement. The MRI scans reveal the ACL graft is positioned anterior to the projected Blumensaat's line, causing mechanical impingement. Visually, this results in a characteristic 's-shaped' deformity or buckling of the graft, as indicated by the white arrow in (c). High signal intensity within the graft on T2-weighted imaging and thinning of the fibers at the point of impingement are evident, suggesting graft irritation or partial tearing. The images serve as an educational comparison between successful surgical tunnel placement and the radiological signs of impingement syndrome in ligament reconstruction.
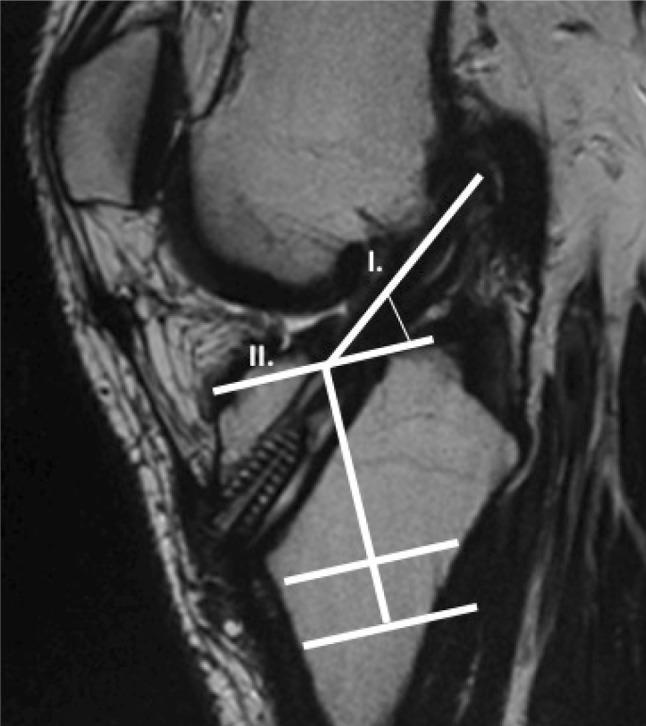
This diagnostic image is a sagittal MRI of a human knee post-anterior cruciate ligament (ACL) reconstruction, demonstrating the methodology for measuring the graft inclination angle. The image features the distal femur, proximal tibia, and an ACL graft passing through a tibial bone tunnel. To calculate the inclination angle, two primary reference lines are superimposed: Line I is drawn tangential to the anterior border of the ACL graft, and Line II is drawn tangential to the anterior aspect of the intercondylar eminence, perpendicular to the long axis of the tibia. The intersection of these lines defines the sagittal obliquity of the graft. Additional white annotations indicate the tibial long axis and segmental markers along the tibia for orientation. This visualization is used in orthopedic radiology to assess the anatomic positioning of the reconstructed ligament, which is critical for evaluating surgical outcomes, joint stability, and the risk of graft impingement or failure. The clinical significance lies in ensuring the graft's orientation mimics the native ACL's biomechanical properties.
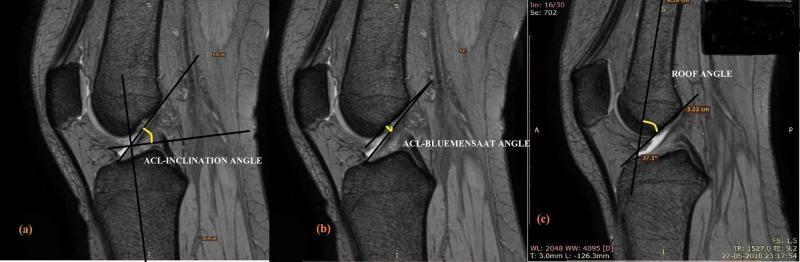
A composite of three sagittal T2-weighted MRI slices of a human knee joint, demonstrating the quantitative assessment of the anterior cruciate ligament (ACL) orientation and femoral morphology. (a) Illustrates the ACL-inclination angle, measured between a tangent line along the anterior aspect of the ACL and a line perpendicular to the longitudinal tibial axis. (b) Depicts the ACL-Blumensaat angle, defined as the angle formed between the Blumensaat line (the roof of the intercondylar notch) and the tangent to the anterior ACL fibers. (c) Displays the roof angle, which is the angle between the femoral longitudinal axis and the Blumensaat line, with an annotated value of 37.1 degrees. The images highlight key anatomical landmarks including the patella, distal femur, proximal tibia, and the fibrillar structure of the ACL. These measurements are clinically relevant in orthopedics for evaluating ACL graft placement, impingement risk, and native ligament biomechanics.
ACL graft tear MRI partial complete rupture knee failure
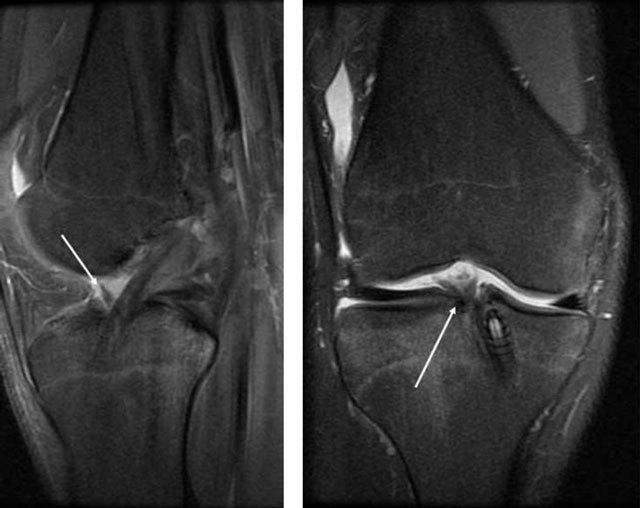
Diagnostic Image: Two T2-weighted MRI scans of the knee joint in sagittal (left) and coronal (right) planes, illustrating a partial rupture of an anterior cruciate ligament (ACL) graft. In the sagittal view, the anterior portion of the ACL graft exhibits a localized region of increased signal intensity (hyperintensity) and visible fiber discontinuity, indicated by a white arrow, suggesting a focal tear or fluid accumulation within the ligament. The coronal view demonstrates similar findings, with an arrow pointing to a high-signal area in the anterior-medial aspect of the graft, reflecting edema or intrasubstance disruption. These radiological features differentiate a partial rupture from a normal graft, which typically maintains low signal intensity across all planes. The imaging also captures the postoperative anatomy, including the surgical tunnels and surrounding soft tissues of the knee joint, emphasizing the importance of MRI in evaluating graft integrity and identifying late-stage complications such as partial or total failure.
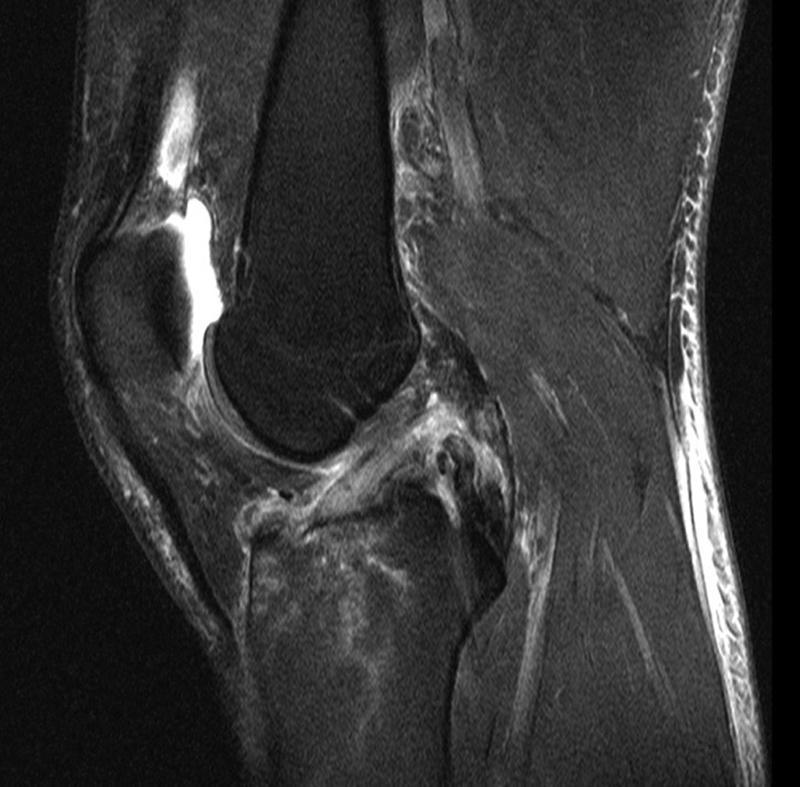
This sagittal T2-weighted fluid-sensitive MRI of the human knee demonstrates multi-ligamentous injury. The image shows a complete rupture of the posterior cruciate ligament (PCL), characterized by clear discontinuity of the fibers and retraction of the proximal segment near its femoral origin. Significant hyperintense signal edema and hemorrhage are visible surrounding the expected PCL location. The anterior cruciate ligament (ACL) follows a continuous anatomical course but exhibits altered internal signal intensity and fiber irregularity suggestive of a partial tear. Additionally, there is evidence of extensive bone marrow edema (trabecular microfracture) within the posterior tibial plateau and a joint effusion in the suprapatellar bursa. This diagnostic image is representative of high-energy knee trauma, illustrating the radiological findings necessary for evaluating acute ligamentous instability and structural disruption in orthopedic and musculoskeletal radiology.
tunnel widening ACL reconstruction femoral tibial osteolysis MRI
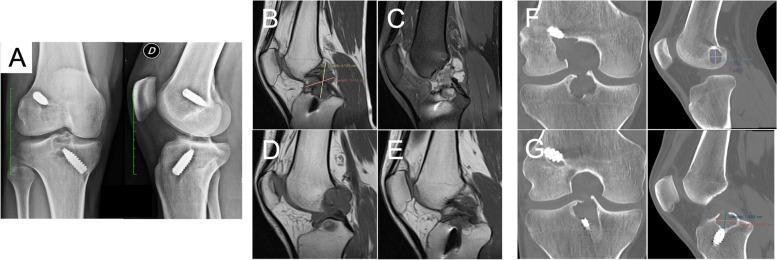
Multi-modal diagnostic imaging of a knee joint post-ACL reconstruction with a synthetic LARS graft, demonstrating significant osteolysis and a pseudo-myxoid mass. (A) Anteroposterior and lateral X-rays show radiopaque fixation screws with marked widening of the femoral and tibial tunnels and increased radiolucency in the intercondylar eminence, indicating peri-tunnel bone resorption. (B-E) Sagittal MRI views demonstrate a large, well-defined mass occupying the intercondylar notch. The lesion is predominantly hypointense on T1-weighted sequences (B, D) and displays heterogeneous hyperintensity on STIR sequences (C, E), consistent with a multicystic, fluid-filled pseudo-myxoid mass that lacks a healthy ACL graft signal. (F-G) Coronal and sagittal CT scans highlight the precise morphology of the grade 3 osteolytic cavities, revealing extensive loss of subchondral and cancellous bone surrounding the femoral (F) and tibial (G) tunnels. This imaging series illustrates a severe inflammatory and osteolytic complication following synthetic ligament implantation, characterized by tunnel enlargement and intra-articular cystic mass formation.
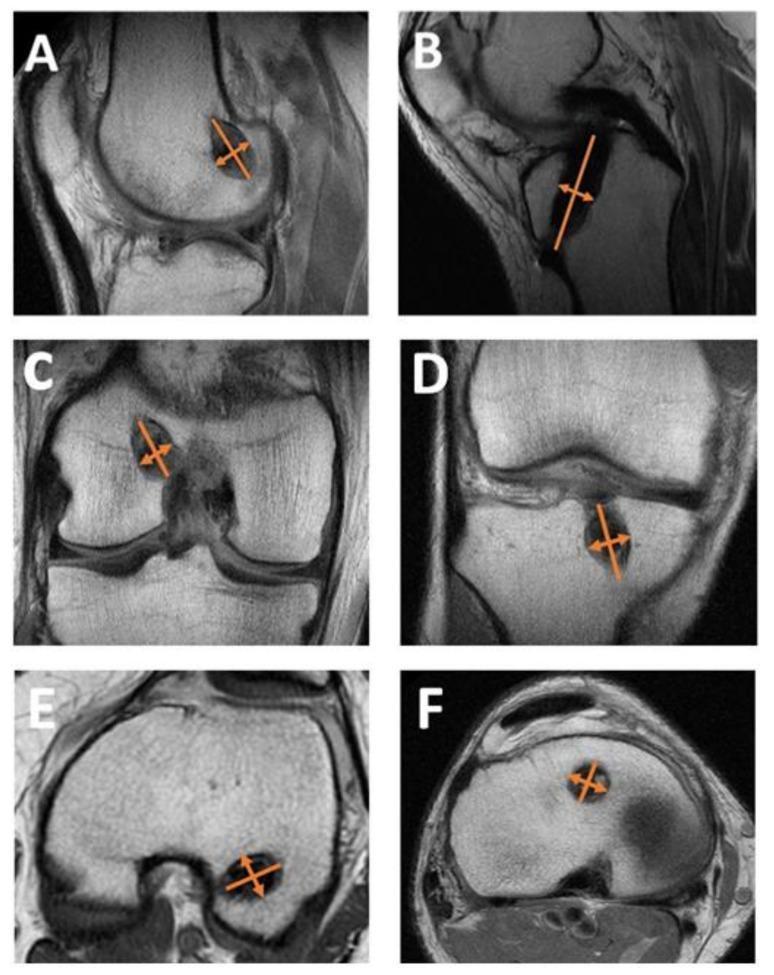
This diagnostic image set consists of six MRI panels (A–F) demonstrating the methodology for measuring femoral and tibial tunnel expansion following Anterior Cruciate Ligament (ACL) reconstruction. Panels A, C, and E show the femoral tunnel in sagittal, coronal, and axial planes, respectively. Panels B, D, and F show the tibial tunnel in sagittal, coronal, and axial planes, respectively. In each plane, the tunnels appear as well-defined, low-signal (dark) cylindrical voids within the cancellous bone of the distal femur and proximal tibia. Orange bidirectional arrows illustrate the quantitative measurement technique, specifically identifying the tunnel diameter perpendicular to the greatest diameter or long axis. This visualization is used to assess post-operative biological complications such as tunnel widening or 'windshield-wiper' effect, which are critical for evaluating graft stability and planning potential revision surgery. The imaging highlights the precise anatomical placement and morphology of the tunnels within the knee joint structures.
posterior tibial slope measurement MRI ACL failure risk knee
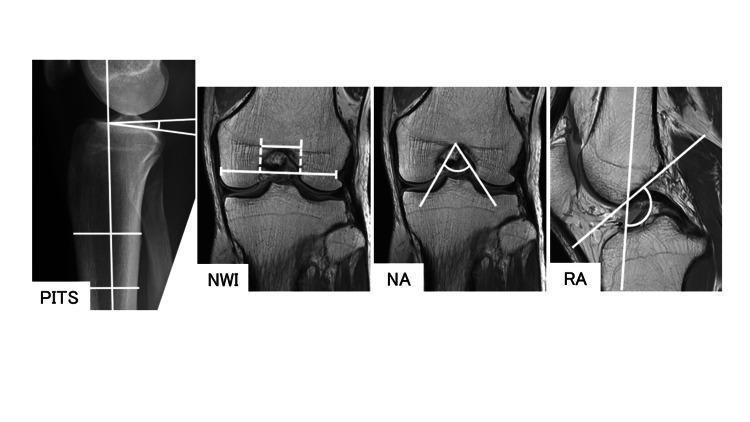
This composite diagnostic image illustrates anatomical measurement protocols for knee morphology assessment, likely for evaluating risk factors in ACL injuries. The image consists of four panels: (1) PITS (Posterior-Inferior Tibial Slope): A lateral radiograph of the proximal tibia and distal femur showing the angle between the tibial longitudinal axis and the medial tibial plateau slope. (2) NWI (Notch Width Index): A coronal MRI slice at the distal femur demonstrating the ratio of the intercondylar notch width to the total bicondylar width. (3) NA (Notch Angle): A coronal MRI slice showing the angle formed by the intercondylar notch aperture. (4) RA (Roof Inclination Angle): A midsagittal MRI slice depicting the obtuse angle between the Blumensaat line (intercondylar roof) and the longitudinal axis of the knee. These measurements are clinical indicators for femoral notch stenosis and tibial slope steepness, which are critical in orthopedic biomechanics and ligamentous injury analysis.
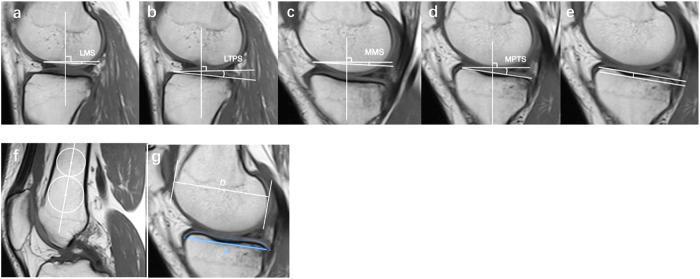
A series of seven sagittal MRI frames of a human knee joint (labeled a-g) demonstrating quantitative morphometric measurements used in orthopedic assessment, specifically for ACL and meniscus injury risk profiling. Panels a-d illustrate slope measurements relative to a vertical tibial reference line: (a) Lateral Meniscal Slope (LMS) and (c) Medial Meniscal Slope (MMS) measured along the superior meniscal borders; (b) Lateral Posterior Tibial Slope (LPTS) and (d) Medial Posterior Tibial Slope (MTPS) measured along the subchondral bone surface. Panel (e) depicts the measurement of medial posterior tibial depth. Panel (f) demonstrates the method for establishing the femoral longitudinal axis by connecting the midpoints of two circles tangent to the femoral shaft cortex. Panel (g) shows the measurement of the medial femoral condyle (MFC) diameter (D) using parallel lines tangent to the anterior-most and posterior-most aspects, and the medial tibial plateau (MTP) anterior-posterior length (L) based on the cartilaginous surface outline. These quantitative parameters are critical for evaluating anatomical predispositions to ramp lesions and ACL instability.
Post-ACL Graft Assessment on MRI: Complete Reference Guide
1. Overview: What to Assess on Post-ACL MRI
- Graft type identification
- Graft signal and maturation (ligamentization)
- Graft morphology and integrity (tears, attenuation)
- Graft inclination angles (sagittal and coronal)
- Femoral tunnel - position, angle, widening
- Tibial tunnel - position, angle, widening
- Fixation hardware
- Complications (cyclops, impingement, arthrofibrosis, cysts)
- Anatomical risk factors (tibial slope, notch morphology)
- Associated knee pathology (menisci, cartilage, other ligaments)
2. MRI Sequences Used
| Sequence | Best For |
|---|---|
| Sagittal PD / PD-FS | Graft signal, continuity, tunnel orientation |
| Sagittal T1 | Tunnel bone interface, hardware |
| Sagittal T2 / T2-FS | Edema, fluid at tunnel-graft interface, tears |
| Coronal PD-FS | Femoral tunnel angle/clock-face, coronal graft inclination |
| Axial PD-FS | Cyclops lesion, notch, cross-section of tunnels |
| 3D DESS / 3D PDW | High-res graft detail, cartilage evaluation |
3. Graft Types and Normal Appearances
Common Graft Types
| Graft | Source | Key MRI Feature |
|---|---|---|
| BPTB (Bone-Patellar Tendon-Bone) | Central third patellar tendon | Bone plugs = low T1/T2 at insertion sites; most uniform signal long-term |
| Hamstring (STG) | Semitendinosus + gracilis | Quadrupled or doubled graft; slightly more variable signal |
| Quadriceps tendon | Quad tendon + patellar bone plug | Broader, flat; bone plug at femoral end |
| Allograft | Cadaveric | Similar appearance to autograft; slower maturation |
Normal Graft Signal (Mature Graft)
- T1: Low signal
- T2/PD: Low signal (dark band traversing intercondylar notch)
- Fat-suppressed sequences: Dark, no increased signal
4. Graft Maturation / Ligamentization
| Phase | Time Post-op | MRI Signal | Biology |
|---|---|---|---|
| Necrosis | 0-4 weeks | Low to intermediate signal | Avascular graft |
| Revascularization | 4-12 weeks | Increased T2 signal | Angiogenesis from synovial membrane |
| Cell proliferation | 3-6 months | Intermediate-high signal | Fibroblast infiltration |
| Ligamentization | 6-24 months | Progressively decreasing signal | Collagen maturation |
| Mature graft | >24 months | Uniformly hypointense | Signal equals native ACL |
5. Figueroa Score (Graft Maturation Scoring)
| Parameter | Finding | Points |
|---|---|---|
| Integration (synovial fluid at tunnel-graft interface) | Positive (fluid present) | 1 |
| Negative (no fluid) | 2 | |
| Ligamentization (graft signal pattern, >50% of graft) | Hyperintense | 1 |
| Isointense | 2 | |
| Hypointense | 3 | |
| Graft characterization | Poor | 2 |
| Adequate | 3-5 |
- Score 2 = Insufficient graft maturation (likely failure or early phase)
- Score 3-5 = Adequate ligamentization and graft integration
- Score 5/5 = Normal, mature graft
6. ACL/PCL Signal Ratio (APR) - Quantitative Assessment
- APR = ACL graft signal / PCL signal
- Normal mature graft: APR approaches 1.0 (isointense to PCL)
- Immature graft: APR > 1.0 (brighter than PCL)
- Failed/torn graft: Absent signal or markedly abnormal APR
7. Blumensaat's Line and ACL-Blumensaat Angle
Tibial Tunnel vs. Blumensaat's Line
- The entire intra-articular opening of the tibial tunnel must be located posterior to (dorsally to) the projected Blumensaat's line on sagittal MRI
- If the tunnel opening lies anterior to Blumensaat's line = too anterior = impingement risk
ACL-Blumensaat Angle
- Measured between the Blumensaat line and the anterior border of the ACL graft fibers on sagittal MRI
- Normal: 0-15° (nearly parallel; graft runs along notch roof)
-
15° = graft failure indicator
- Values of 25-26° reported in failed grafts
8. Tibial Tunnel Assessment
8A. Sagittal Plane - Tibial Tunnel Position (AP Direction)
- On mid-sagittal MRI, measure the center of the tibial tunnel aperture as a percentage of the total AP length of the tibial plateau (measured from anterior edge)
- Normal tibial tunnel center: ~42-43% of AP tibial plateau length
- Native ACL: located between 28% and 63% (center at 46%)
- Acceptable range: 27-60%
| Position | Value | Consequence |
|---|---|---|
| Too anterior | <27% | Impingement with notch roof, cyclops lesion, extension deficit |
| Normal | 27-60% (center ~42-43%) | Optimal |
| Too posterior | >60% | Vertical graft, poor rotational control, instability |
8B. Coronal Plane - Tibial Tunnel Angle
- Measured as the angle between the line along the tunnel center and the ipsilateral tibial plateau surface
- Normal: ≤72°
- If tibial tunnel coronal angle >72° = excessive angulation = compromised graft mechanics = instability indicator
- Recommended tibial tunnel coronal angle: 65-70° when femoral tunnel drilled through tibial tunnel
- Tibial graft angle (TGA): ~62-67° (varies by technique: AM ~67°, transtibial ~63°)
8C. Tunnel Widening
- Defined as postoperative enlargement >2 mm vs baseline
- Predominantly occurs in first 6 months post-surgery
- Appears as loss of parallel tunnel walls → cone-shaped (wider intra-articularly)
- Associated with: biologic response to graft, motion of graft ("windshield-wiper effect"), infection, synovial fluid ingress
9. Femoral Tunnel Assessment
9A. Position - Clock-Face Convention (Coronal View)
| Knee Side | Ideal Clock Position |
|---|---|
| Right knee | 10-11 o'clock |
| Left knee | 1-2 o'clock |
- AM (anteromedial) bundle: 10 o'clock (R) / 2 o'clock (L) = more proximal
- PL (posterolateral) bundle: 9 o'clock (R) / 3 o'clock (L) = more distal
9B. Coronal Plane - Femoral Tunnel Angle
- Measured between the femoral axis and the line bisecting the tunnel
- Femoral axis is drawn perpendicular to the trans-epicondylar axis
- Normal femoral tunnel angle: ~39°
- Malposition indicator: <17° = associated with rotational instability
- Femoral graft angle (FGA): AM approach ~48°, transtibial ~57° (measured between tunnel axis and joint line)
| Femoral Tunnel Angle | Interpretation |
|---|---|
| ~39° (coronal, from femoral axis) | Optimal anatomic position |
| ≤17° | Malposition - rotational instability |
| Too shallow/high | Graft taut in flexion; overstretches in extension - ROM restriction |
| Too inferior/anterior | Poor anterior-posterior control |
9C. Femoral Tunnel Position Percentages (Hoser Method)
- Posterior to anterior (deep to shallow): ~30% normal
- Proximal to distal (high to low): ~24% normal
- Mean femoral tunnel length: ~35 mm
9D. Femoral Tunnel Widening
- Similar to tibial side - >2mm indicates widening
- Conical shape with wider intra-articular opening = active widening
- Femoral side generally less pronounced than tibial side
10. Graft Inclination Angles
10A. Sagittal Graft Inclination Angle
| Value | Interpretation |
|---|---|
| 43-57° | Normal/optimal range |
| ≤60° | Acceptable |
| >60° | Excessive - risk of impingement |
- Native ACL sagittal angle: ~52-53°
- AM approach gives slightly different angle than transtibial technique
10B. Coronal Graft Inclination Angle
| Value | Interpretation |
|---|---|
| <75° | Normal - adequate rotatory control |
| ≥75° | Vertically oriented graft - poor rotational stability |
| ~88° (example) | Severely vertical - clearly pathological |
| Mean post-ACLR: ~69° | Within normal range |
11. Summary of Key Angles and Values
| Parameter | Normal Value | Pathological Value | Consequence |
|---|---|---|---|
| Tibial tunnel AP position | 27-60% (center ~42%) | <27% (anterior) | Impingement / cyclops |
| >60% (posterior) | Vertical graft, instability | ||
| Tibial tunnel coronal angle | ≤72° | >72° | Rotational instability |
| Femoral tunnel angle (coronal) | ~39° from femoral axis | <17° | Rotational instability |
| Femoral clock-face (R) | 10-11 o'clock | Outside range | Malposition |
| Sagittal graft inclination | 43-57° (max 60°) | >60° | Impingement |
| Coronal graft inclination | <75° | ≥75° | Poor rotational control |
| ACL-Blumensaat angle | 0-15° | >15° (esp. >25°) | Graft failure |
| Graft signal | Hypointense all sequences | Hyperintense T2 | Failure/immature/torn |
| Figueroa score | 3-5 | 2 | Inadequate maturation |
| Tunnel widening | <2mm change | >2mm | Osteolysis, revision issues |
| Tibial plateau slope | <12° | >12° | ACL failure/re-rupture risk |
| Femoral bending angle | ~114° | - | Graft stress |
12. Graft Complications on MRI
12A. Graft Tear (Partial or Complete)
- Complete tear: No identifiable graft fibers in intercondylar notch; "empty notch" sign; may show residual stumps
- Partial tear: Focal T2 hyperintensity + fiber discontinuity + irregular contour, graft is attenuated but partially present
- Associated: joint effusion, anterior tibial translation, PCL buckling (secondary signs)
12B. Cyclops Lesion
- Well-defined low-to-intermediate signal nodule in anterior intercondylar notch
- Located anterior to ACL graft (near tibial insertion)
- Best seen on sagittal and axial views
- Associated: loss of terminal extension clinically
12C. Graft Impingement
- Graft contacts the intercondylar notch roof during extension
- Cause: Too-anterior tibial tunnel (anterior to Blumensaat's line)
- MRI features: Increased T2 signal in distal two-thirds of graft; S-shaped graft deformity (buckling); extension deficit clinically
- Can lead to cyclops lesion if chronic
12D. Graft Stretching / Attenuation
- Graft intact but thinned, elongated
- Increased T2 signal + associated tunnel widening
- Clinical correlation: laxity
12E. Arthrofibrosis
- Fibrous scar tissue in intercondylar notch
- MRI: Hypointense scar tissue on all sequences
- Can be focal (cyclops lesion) or diffuse
- Restricts motion, especially extension
12F. Tunnel Cystic Changes
- Fluid-filled cysts within or around tunnels (ganglion-like)
- Appear as T2 hyperintense well-defined collections
- Can be related to synovial fluid ingress or biological reaction
13. Anatomical Risk Factors Assessed on MRI
13A. Posterior Tibial Slope
| Parameter | Normal | Pathological |
|---|---|---|
| Tibial plateau slope | <12° | >12° = significant ACL failure risk |
- Lateral tibial slope >6.5° vs <8.4° → 1.6-3.8× higher failure risk (odds ratio increases with each 2° increase)
-
12° slope = ~60% incidence of graft re-rupture or contralateral ACL injury (Webb et al.)
- More important in females
13B. Notch Morphology (Pre-op / Recurrence Risk)
- Notch width index (NWI): Width of intercondylar notch / total bicondylar width on coronal MRI
- Normal >0.31; narrow notch (<0.31) = risk factor for ACL injury / impingement
- Notch angle and roof angle (Blumensaat line angle): Steeper notch roof = less clearance
13C. Medial/Lateral Meniscal Slopes
- Measured on sagittal MRI
- Increased lateral meniscal slope = ACL injury risk factor
14. Structured MRI Report Template (Post-ACLR)
GRAFT TYPE: [BPTB / Hamstring / Quadriceps / Allograft / Other]

FEMORAL TUNNEL
  Position: [Correct / Anterior / Inferior]
  Clock-face: [10-11 o'clock (R) / 1-2 o'clock (L)]
  Coronal angle: [___°] (Normal ~39°; <17° = malposition)
  Tunnel widening: [Yes / No]; Diameter: [___mm]

TIBIAL TUNNEL
  Sagittal AP position: [___% of tibial plateau] (Normal 27-60%, center ~42%)
  Orientation re: Blumensaat: [Parallel / Anterior / Posterior]
  Coronal angle: [___°] (Normal ≤72°)
  Tunnel widening: [Yes / No]; Diameter: [___mm]

GRAFT
  Sagittal inclination angle: [___°] (Normal 43-57°, max 60°)
  Coronal inclination angle: [___°] (Normal <75°)
  ACL-Blumensaat angle: [___°] (Normal 0-15°)
  Graft length: [___mm]
  Graft signal (Figueroa score): [___/5] (3-5 = adequate)
  Graft characterization: [Intact / Partial tear / Complete tear / Attenuated]

TIBIAL PLATEAU SLOPE: [___°] (Normal <12°)

COMPLICATIONS
  Graft-related: [None / Cyclops / Impingement / Stretching / Tear / Degeneration]
  Tunnel-related: [None / Cystic / Osteolysis / Collection]
  Hardware: [Normal / Migration / Loosening / Breakage]

ASSOCIATED FINDINGS
  Cartilage: [Normal / Chondral lesion location/grade]
  Menisci: [Intact / Tear - location/type]
  PCL: [Normal / Abnormal]
  Collateral ligaments: [Normal / Abnormal]
  Bone marrow edema: [None / Present - location]
  Effusion: [None / Mild / Moderate / Large]
15. Secondary Signs of ACL Graft Failure on MRI
| Sign | Description |
|---|---|
| Empty notch sign | No graft seen in intercondylar region |
| Anterior tibial translation | Tibia shifted anteriorly relative to femur on sagittal MRI |
| PCL buckling | PCL appears angulated/bent (normally straight) due to anterior tibial translation |
| Bone marrow edema | Lateral femoral condyle + posterior tibial plateau ("kissing contusions" pattern) |
| Joint effusion | Hemarthrosis in acute re-rupture |
| Tunnel widening | Progressive enlargement post-op |
16. Double-Bundle ACL Reconstruction
| Bundle | Femoral Tunnel | Tibial Tunnel |
|---|---|---|
| AM (Anteromedial) | 10 o'clock (R) / 2 o'clock (L) - more proximal/anterior | Anterior of footprint |
| PL (Posterolateral) | 9 o'clock (R) / 3 o'clock (L) - more distal/posterior | Posterior of footprint |
17. Howell's Grading (Graft Signal)
| Grade | Signal | Interpretation |
|---|---|---|
| 1 | Uniformly low (hypointense) | Mature, normal graft |
| 2 | Low with focal intermediate | Minor ligamentization changes |
| 3 | Predominantly intermediate | Active remodeling or partial tear |
| 4 | Predominantly high (hyperintense) | Failure / inadequate maturation |
18. Key References
- PMC5065670 - MRI after ACL reconstruction: practical guide (World Journal of Orthopedics, 2016)
- Korean Journal of Radiology - Postoperative evaluation after ACL reconstruction (2016)
- Katal et al. - Structured MRI Reporting for ACL Grafts - Indian Journal of Radiology and Imaging (2026)
- Wilson et al. - ISAKOS 2025 Congress, radiological outcomes following ACL repair with internal bracing