Coagulation cascade . Perio operativecoagulTion monitoring . Thromboelastography vs rotem . For md Anaesthesia exam with pvivaquestions

Reading File
Finding Sources
Finding Sources
Finding Sources
Searching Images

coagulation cascade intrinsic extrinsic pathway diagram

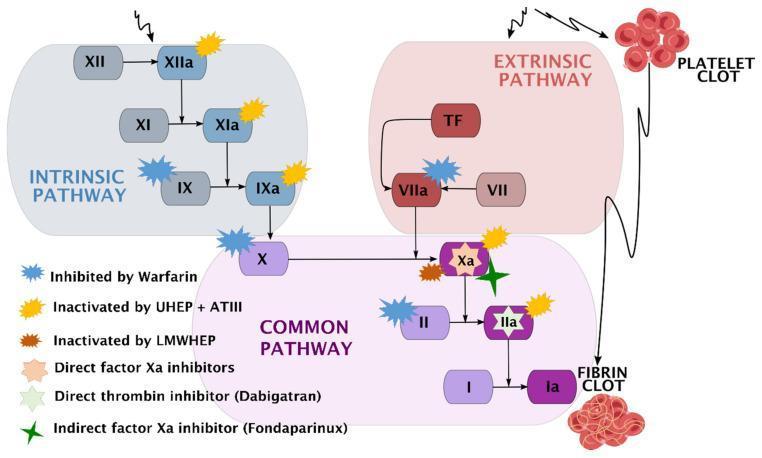
A comprehensive pathophysiology diagram illustrating the human coagulation cascade and the specific pharmacodynamic sites of action for various anticoagulants. The diagram is divided into three functional zones: the Intrinsic Pathway (blue), starting with Factor XII; the Extrinsic Pathway (red), initiated by Tissue Factor (TF) and Factor VII; and the Common Pathway (purple), where the pathways converge at Factor X. The cascade terminates in the conversion of Fibrinogen (I) to Fibrin (Ia), forming a fibrin clot. A secondary visual element depicts a platelet clot associated with the extrinsic pathway. Key clinical pharmacotherapeutic targets are marked with color-coded symbols: Warfarin inhibits Factors IX, VII, X, and II; Unfractionated Heparin (UHEP) + Antithrombin III (ATIII) inactivates Factors XIIa, XIa, IXa, Xa, and IIa; Low-Molecular-Weight Heparin (LMWHEP) and Fondaparinux target Factor Xa; Direct Factor Xa inhibitors act on Factor Xa; and Dabigatran acts as a direct thrombin inhibitor (Factor IIa). This schematic is designed for medical education regarding hemostasis and thromboprophylaxis.

A comprehensive pathophysiology diagram illustrating the human coagulation cascade and the specific pharmacodynamic sites of action for various anticoagulants. The diagram is divided into three functional zones: the Intrinsic Pathway (blue), starting with Factor XII; the Extrinsic Pathway (red), initiated by Tissue Factor (TF) and Factor VII; and the Common Pathway (purple), where the pathways converge at Factor X. The cascade terminates in the conversion of Fibrinogen (I) to Fibrin (Ia), forming a fibrin clot. A secondary visual element depicts a platelet clot associated with the extrinsic pathway. Key clinical pharmacotherapeutic targets are marked with color-coded symbols: Warfarin inhibits Factors IX, VII, X, and II; Unfractionated Heparin (UHEP) + Antithrombin III (ATIII) inactivates Factors XIIa, XIa, IXa, Xa, and IIa; Low-Molecular-Weight Heparin (LMWHEP) and Fondaparinux target Factor Xa; Direct Factor Xa inhibitors act on Factor Xa; and Dabigatran acts as a direct thrombin inhibitor (Factor IIa). This schematic is designed for medical education regarding hemostasis and thromboprophylaxis.

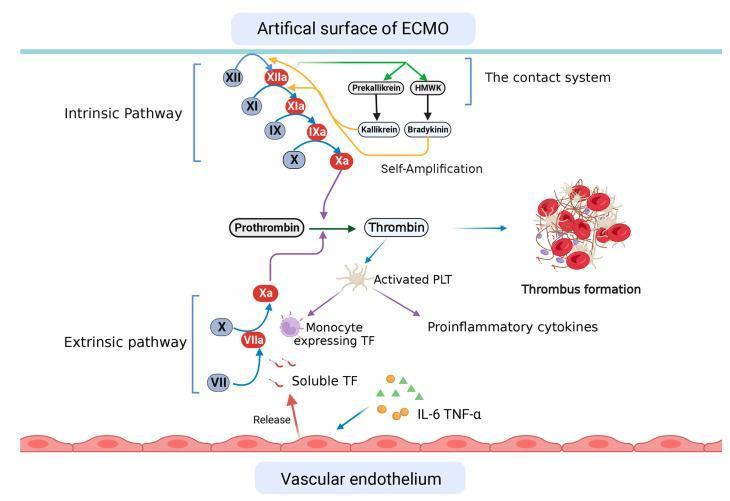
This pathophysiology diagram illustrates the dual activation of the coagulation cascade in patients undergoing Extracorporeal Membrane Oxygenation (ECMO). The diagram identifies two primary initiation mechanisms: contact with the artificial surface of the ECMO system and interactions with the vascular endothelium. The intrinsic pathway is triggered by the artificial surface, involving the contact system where Factor XII is activated to XIIa. This initiates a cascade (XIIa to XIa, XIa to IXa, and IXa to Xa) and a self-amplification loop involving Prekallikrein to Kallikrein and HMWK to Bradykinin. Concurrently, the extrinsic pathway is activated by soluble Tissue Factor (TF) released from the vascular endothelium and TF expressed on monocytes, leading to Factor VIIa activating Factor X to Xa. Both pathways converge at the common pathway, where Factor Xa converts Prothrombin to Thrombin. Thrombin subsequently leads to platelet activation (PLT), thrombus formation, and the release of proinflammatory cytokines, specifically IL-6 and TNF-α. The graphic serves as a clinical education tool for understanding the thrombotic and inflammatory risks associated with extracorporeal life support.

This pathophysiology diagram illustrates the dual activation of the coagulation cascade in patients undergoing Extracorporeal Membrane Oxygenation (ECMO). The diagram identifies two primary initiation mechanisms: contact with the artificial surface of the ECMO system and interactions with the vascular endothelium. The intrinsic pathway is triggered by the artificial surface, involving the contact system where Factor XII is activated to XIIa. This initiates a cascade (XIIa to XIa, XIa to IXa, and IXa to Xa) and a self-amplification loop involving Prekallikrein to Kallikrein and HMWK to Bradykinin. Concurrently, the extrinsic pathway is activated by soluble Tissue Factor (TF) released from the vascular endothelium and TF expressed on monocytes, leading to Factor VIIa activating Factor X to Xa. Both pathways converge at the common pathway, where Factor Xa converts Prothrombin to Thrombin. Thrombin subsequently leads to platelet activation (PLT), thrombus formation, and the release of proinflammatory cytokines, specifically IL-6 and TNF-α. The graphic serves as a clinical education tool for understanding the thrombotic and inflammatory risks associated with extracorporeal life support.

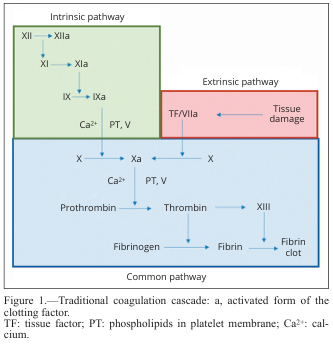
Summary : This diagram illustrates the traditional coagulation cascade, detailing the sequence of events and factors involved in blood clotting via the intrinsic, extrinsic, and common pathways.

flowchart:
# Pathways :
  • Intrinsic pathway (green box): Initiated by factor XII, proceeds through XI, IX, and VIII, with activation steps indicated by "a" (e.g., XIIa, XIa, IXa).
  • Extrinsic pathway (red box): Initiated by tissue damage, which activates tissue factor (TF) and factor VIIa.
  • Common pathway (blue box): Both intrinsic and extrinsic pathways converge at factor X, leading to the activation of prothrombin to thrombin, which then converts fibrinogen to fibrin, forming a fibrin clot.

# Nodes :
  • XII → XIIa (Intrinsic)
  • XI → XIa (Intrinsic)
  • IX → IXa (Intrinsic)
  • Ca²⁺, PT, V (Intrinsic, Common)
  • TF/VIIa (Extrinsic)
  • Tissue damage (Extrinsic)
  • X → Xa (Common)
  • Prothrombin → Thrombin (Common)
  • Fibrinogen → Fibrin (Common)
  • XIII (Common)
  • Fibrin clot (Common)

# Connectors :
  • Arrows indicate the direction of activation or conversion between factors.
  • Intrinsic and extrinsic pathways both feed into the activation of factor X in the common pathway.
  • Ca²⁺ and PT, V are required cofactors at specific steps.

# Layout :
  • Three main colored sections: green (intrinsic, top left), red (extrinsic, top right), blue (common, bottom).
  • Flow proceeds from top (initiation) to bottom (clot formation).
  • Arrows show sequential activation and convergence of pathways.

# Analysis :
  • The diagram clearly separates the intrinsic and extrinsic initiation mechanisms, both converging on the common pathway at factor X.
  • The cascade is highly sequential, with each activated factor catalyzing the next step.
  • Calcium ions (Ca²⁺) and phospholipids (PT) are essential cofactors at multiple steps.
  • The final outcome is the formation of a stable fibrin clot, highlighting the coordinated nature of the coagulation process.

Summary : This diagram illustrates the traditional coagulation cascade, detailing the sequence of events and factors involved in blood clotting via the intrinsic, extrinsic, and common pathways. flowchart: # Pathways : • Intrinsic pathway (green box): Initiated by factor XII, proceeds through XI, IX, and VIII, with activation steps indicated by "a" (e.g., XIIa, XIa, IXa). • Extrinsic pathway (red box): Initiated by tissue damage, which activates tissue factor (TF) and factor VIIa. • Common pathway (blue box): Both intrinsic and extrinsic pathways converge at factor X, leading to the activation of prothrombin to thrombin, which then converts fibrinogen to fibrin, forming a fibrin clot. # Nodes : • XII → XIIa (Intrinsic) • XI → XIa (Intrinsic) • IX → IXa (Intrinsic) • Ca²⁺, PT, V (Intrinsic, Common) • TF/VIIa (Extrinsic) • Tissue damage (Extrinsic) • X → Xa (Common) • Prothrombin → Thrombin (Common) • Fibrinogen → Fibrin (Common) • XIII (Common) • Fibrin clot (Common) # Connectors : • Arrows indicate the direction of activation or conversion between factors. • Intrinsic and extrinsic pathways both feed into the activation of factor X in the common pathway. • Ca²⁺ and PT, V are required cofactors at specific steps. # Layout : • Three main colored sections: green (intrinsic, top left), red (extrinsic, top right), blue (common, bottom). • Flow proceeds from top (initiation) to bottom (clot formation). • Arrows show sequential activation and convergence of pathways. # Analysis : • The diagram clearly separates the intrinsic and extrinsic initiation mechanisms, both converging on the common pathway at factor X. • The cascade is highly sequential, with each activated factor catalyzing the next step. • Calcium ions (Ca²⁺) and phospholipids (PT) are essential cofactors at multiple steps. • The final outcome is the formation of a stable fibrin clot, highlighting the coordinated nature of the coagulation process.

Reading File
Reading File
Finding Sources
Finding Sources
Searching Images

thromboelastography TEG ROTEM tracing parameters

<table>
  <tr>
    <th></th>
    <th>2010 Prior Guideline Recommendation</th>
    <th>2023 Update Guideline Recommendation</th>
  </tr>
  <tr>
    <td>Thromboelastography may be useful during the HT surgery to further elucidate the status of the patient’s hemostasis.<br>Class IIa, Level of Evidence C</td>
    <td>Perioperative viscoelastic tests, thromboelastography (TEG) and rotational thromboelastometry (ROTEM), may be useful in HT surgery to analyze full clot formation profiles, including platelet function, in further elucidating the recipient’s anticoagulation status.<br><b>Class IIa, Level of Evidence C</b></td>
  </tr>
  <tr>
    <td>Fibrinogen levels and D-Dimer values should be measured postoperatively because these are tests of fibrinolysis and correlate with the risk of bleeding after HT surgery.<br>Class IIa, Level of Evidence C</td>
    <td>Postoperative measurements of fibrinogen and D-dimer values, which correlate with increased risk of bleeding after HT may be measured in recipients identified as having specific increased risks for vascular thrombosis.<br><b>Class IIb, Level of Evidence C</b></td>
  </tr>
  <tr>
    <td>Platelet function can be measured either by platelet aggregometry or by a point of care assay such as the platelet function assay 100 (PFA-100) during the HT surgery.<br>Class IIa, Level of Evidence C</td>
    <td>Continuing approval without change</td>
  </tr>
  <tr>
    <td>Thromboelastography may be repeated after HT surgery to monitor patients’ hemostasis.<br>Class IIa, Level of Evidence C</td>
    <td><b>Recommendation removed</b></td>
  </tr>
</table>

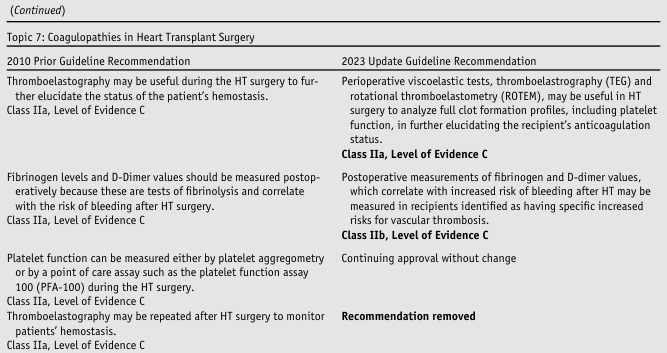
<table> <tr> <th></th> <th>2010 Prior Guideline Recommendation</th> <th>2023 Update Guideline Recommendation</th> </tr> <tr> <td>Thromboelastography may be useful during the HT surgery to further elucidate the status of the patient’s hemostasis.<br>Class IIa, Level of Evidence C</td> <td>Perioperative viscoelastic tests, thromboelastography (TEG) and rotational thromboelastometry (ROTEM), may be useful in HT surgery to analyze full clot formation profiles, including platelet function, in further elucidating the recipient’s anticoagulation status.<br><b>Class IIa, Level of Evidence C</b></td> </tr> <tr> <td>Fibrinogen levels and D-Dimer values should be measured postoperatively because these are tests of fibrinolysis and correlate with the risk of bleeding after HT surgery.<br>Class IIa, Level of Evidence C</td> <td>Postoperative measurements of fibrinogen and D-dimer values, which correlate with increased risk of bleeding after HT may be measured in recipients identified as having specific increased risks for vascular thrombosis.<br><b>Class IIb, Level of Evidence C</b></td> </tr> <tr> <td>Platelet function can be measured either by platelet aggregometry or by a point of care assay such as the platelet function assay 100 (PFA-100) during the HT surgery.<br>Class IIa, Level of Evidence C</td> <td>Continuing approval without change</td> </tr> <tr> <td>Thromboelastography may be repeated after HT surgery to monitor patients’ hemostasis.<br>Class IIa, Level of Evidence C</td> <td><b>Recommendation removed</b></td> </tr> </table>

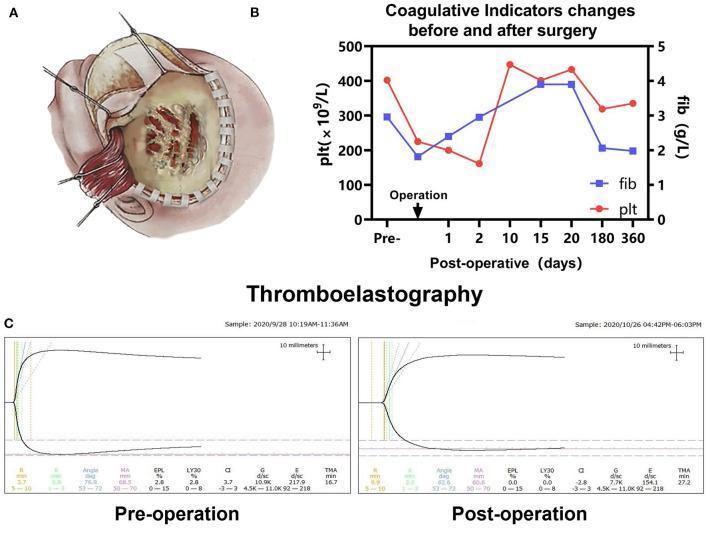
Educational panel consisting of a surgical diagram, a longitudinal line graph, and diagnostic tracing images related to a pediatric neurosurgical case. 

Panel A: An anatomical diagram illustrating a left frontotemporal craniotomy on an infant. The illustration shows a reflected scalp flap held by retractors, exposing an abnormal skull surface characterized by thinning and distinctive dark-red, worm-like vascular changes and blood seeping, indicative of tumor invasion. 

Panel B: A line graph tracking coagulative indicators from pre-operative status through 360 days post-operative. Platelet count (plt, x10^9/L) is shown in red, and fibrinogen (fib, g/L) in blue. The graph demonstrates a sharp perioperative decline in both markers followed by a recovery phase peaking around day 10–20. 

Panel C: Pre-operative and post-operative Thromboelastography (TEG) tracings showing normal clot formation kinetics, including R-time, K-time, alpha angle, and Maximum Amplitude (MA). The tracings represent a stable coagulation profile despite the significant surgical intervention for a suspected intracranial Kaposiform Hemangioendothelioma (KHE).

Educational panel consisting of a surgical diagram, a longitudinal line graph, and diagnostic tracing images related to a pediatric neurosurgical case. Panel A: An anatomical diagram illustrating a left frontotemporal craniotomy on an infant. The illustration shows a reflected scalp flap held by retractors, exposing an abnormal skull surface characterized by thinning and distinctive dark-red, worm-like vascular changes and blood seeping, indicative of tumor invasion. Panel B: A line graph tracking coagulative indicators from pre-operative status through 360 days post-operative. Platelet count (plt, x10^9/L) is shown in red, and fibrinogen (fib, g/L) in blue. The graph demonstrates a sharp perioperative decline in both markers followed by a recovery phase peaking around day 10–20. Panel C: Pre-operative and post-operative Thromboelastography (TEG) tracings showing normal clot formation kinetics, including R-time, K-time, alpha angle, and Maximum Amplitude (MA). The tracings represent a stable coagulation profile despite the significant surgical intervention for a suspected intracranial Kaposiform Hemangioendothelioma (KHE).

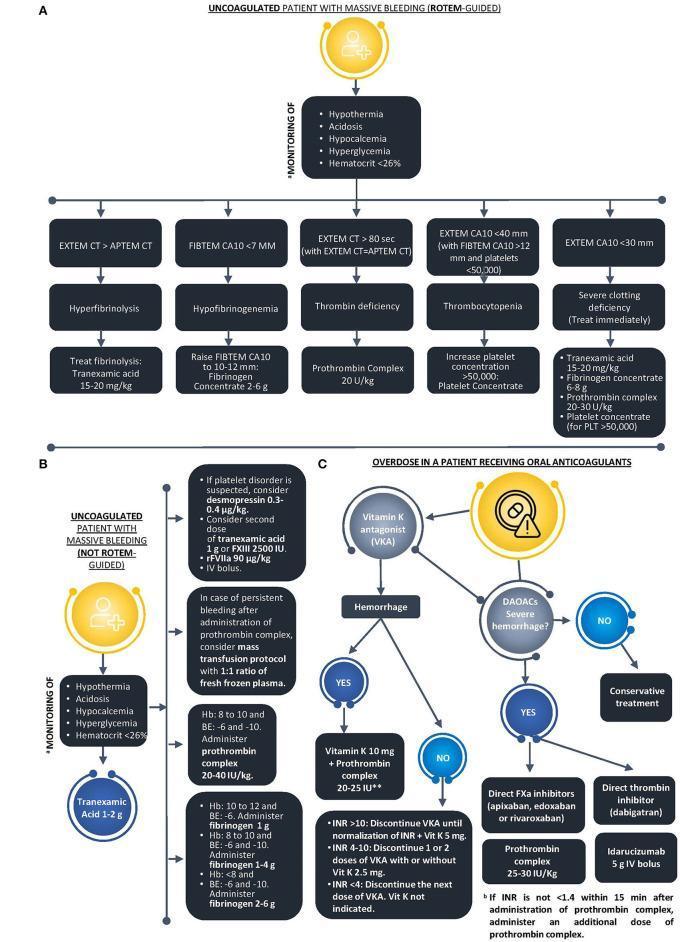
This medical infographic presents three clinical algorithms (A, B, and C) for managing massive bleeding in acute settings. Algorithm A details a ROTEM-guided approach for uncoagulated patients, using viscoelastic parameters (EXTEM, FIBTEM, APTEM) to differentiate and treat hyperfibrinolysis (tranexamic acid), hypofibrinogenemia (fibrinogen concentrate), thrombin deficiency (prothrombin complex), and thrombocytopenia. Algorithm B outlines management for uncoagulated patients when ROTEM is unavailable, focusing on monitoring for the 'lethal triad' (acidosis, hypothermia, coagulopathy), lab values like hemoglobin and base excess, and the administration of blood products or PCC. Algorithm C addresses oral anticoagulant overdose, branching by agent type: Vitamin K Antagonists (VKA) or Direct Oral Anticoagulants (DOACs). It provides decision nodes based on INR levels and hemorrhage severity, recommending reversal agents such as Vitamin K, prothrombin complex (PCC), or Idarucizumab for dabigatran. The diagrams use standardized medical terminology and dosage guidelines suitable for emergency medicine, hematology, and trauma surgery education.

This medical infographic presents three clinical algorithms (A, B, and C) for managing massive bleeding in acute settings. Algorithm A details a ROTEM-guided approach for uncoagulated patients, using viscoelastic parameters (EXTEM, FIBTEM, APTEM) to differentiate and treat hyperfibrinolysis (tranexamic acid), hypofibrinogenemia (fibrinogen concentrate), thrombin deficiency (prothrombin complex), and thrombocytopenia. Algorithm B outlines management for uncoagulated patients when ROTEM is unavailable, focusing on monitoring for the 'lethal triad' (acidosis, hypothermia, coagulopathy), lab values like hemoglobin and base excess, and the administration of blood products or PCC. Algorithm C addresses oral anticoagulant overdose, branching by agent type: Vitamin K Antagonists (VKA) or Direct Oral Anticoagulants (DOACs). It provides decision nodes based on INR levels and hemorrhage severity, recommending reversal agents such as Vitamin K, prothrombin complex (PCC), or Idarucizumab for dabigatran. The diagrams use standardized medical terminology and dosage guidelines suitable for emergency medicine, hematology, and trauma surgery education.

Reading File
Reading File
Reading File
Reading File
Reading File
Loading Image
Loading Image
Loading Image
Finding Sources
I now have all the material I need. Let me compile the comprehensive MD Anaesthesia exam answer.

Coagulation Cascade, Perioperative Coagulation Monitoring, and TEG vs ROTEM

MD Anaesthesia Exam Notes with PYQ-style Questions


PART 1: THE COAGULATION CASCADE

Traditional (Cell-Free) Model

The coagulation cascade is a series of amplifying enzymatic reactions leading to insoluble fibrin clot deposition. Each step involves: enzyme (activated factor) + substrate (inactive proenzyme) + cofactor, assembled on a negatively charged phospholipid surface (provided by activated platelets). Calcium is essential - it binds gamma-carboxylated glutamic acid residues on factors II, VII, IX, X (vitamin K-dependent factors).
Traditional Coagulation Cascade - Intrinsic, Extrinsic, Common Pathways

Intrinsic Pathway (Contact Activation)

  • Initiated by: contact with negatively charged surface (e.g., glass beads in lab)
  • XII → XIIa → XI → XIa → IX → IXa
  • IXa + VIIIa (tenase complex) → X → Xa
  • Assessed by: aPTT (partial thromboplastin time)
  • Factors: XII, XI, IX, VIII, X, V, II, fibrinogen

Extrinsic Pathway (Tissue Factor)

  • Initiated by: vascular injury exposing Tissue Factor (TF) to blood
  • TF + VIIa (extrinsic tenase) → X → Xa (also activates IX → IXa)
  • Assessed by: PT/INR
  • Factors: VII, X, V, II, fibrinogen

Common Pathway

  • Xa + Va (prothrombinase complex) + Ca2+ + phospholipid → Prothrombin (II) → Thrombin (IIa)
  • Thrombin converts fibrinogen → fibrin; also activates XIII → XIIIa (cross-links fibrin)
  • Thrombin amplifies cascade: activates V, VIII, XI, XIII, and platelets

Cell-Based Model of Coagulation (In Vivo Reality)

The lab-based intrinsic/extrinsic model does NOT recapitulate in vivo clotting. The cell-based model is more clinically relevant.
Three phases:
PhaseLocationKey Events
InitiationTF-bearing cellsTF-VIIa activates small amounts of IX, X → trace thrombin
AmplificationPlatelet surfaceTrace thrombin activates platelets, V, VIII, XI - "priming"
PropagationActivated platelet surfaceTenase + prothrombinase complexes → thrombin burst → fibrin clot
Key clinical fact: Factor XI deficiency → only mild bleeding (intrinsic pathway minor in vivo). Factor XII deficiency → NO bleeding (Hageman factor not needed for hemostasis). Factors V, VII, VIII, IX, X deficiency → moderate-severe bleeding.

Anticoagulants and Their Targets

Coagulation Cascade with Anticoagulant Drug Targets
DrugMechanismFactors Affected
WarfarinInhibits Vitamin K-dependent synthesisII, VII, IX, X (also Protein C, S)
UFH + ATIIIInactivates multiple factorsXIIa, XIa, IXa, Xa, IIa
LMWHEnhances ATIII vs Xa >> IIaXa > IIa
FondaparinuxIndirect anti-XaXa only
Rivaroxaban/ApixabanDirect anti-XaXa
DabigatranDirect thrombin inhibitorIIa (thrombin)

Anticoagulant Proteins (Natural Inhibitors)

  • Antithrombin III (ATIII): inhibits IIa, Xa, IXa, XIa, XIIa - activity potentiated 1000x by heparin
  • Tissue Factor Pathway Inhibitor (TFPI): inhibits TF-VIIa-Xa complex
  • Protein C + S: Thrombin binds thrombomodulin → activates Protein C → degrades Va, VIIIa
  • Plasminogen/Plasmin: fibrinolysis - tPA/uPA converts plasminogen → plasmin → degrades fibrin → FDPs/D-dimers

PART 2: PERIOPERATIVE COAGULATION MONITORING

Conventional Laboratory Tests

TestPathway AssessedNormal ValuesClinical Use
PT / INRExtrinsic + commonPT: 11-15 sec; INR: 0.8-1.2Warfarin monitoring, liver disease, pre-op screen
aPTTIntrinsic + common25-35 secUFH monitoring, hemophilia A/B, factor deficiencies
TT (Thrombin Time)Fibrinogen → fibrin step14-19 secFibrinogen quality, heparin effect, dabigatran
Fibrinogen (Clauss)Fibrinogen level2-4 g/LDIC, massive transfusion, liver disease
D-dimerFibrinolysis marker<0.5 mg/LDVT/PE screening, DIC
ACT (Activated Clotting Time)Whole blood, near-patient90-130 secHigh-dose heparin monitoring (cardiac surgery, ECMO)
Platelet countQuantitative150,000-400,000/µLThrombocytopenia, pre-op, DIC

Limitations of Conventional Tests

  • Performed on platelet-poor plasma (not whole blood)
  • Assessed at 37°C regardless of patient temperature - miss hypothermia-induced coagulopathy
  • Do NOT detect: platelet dysfunction, hyperfibrinolysis, factor XIII deficiency, clot strength, effect of acidosis
  • Static measurements - do not reflect dynamic clot formation and lysis
  • PT/aPTT may be normal in up to 50% of patients with clinically significant coagulopathy

Point-of-Care Tests

TestUse
ACTNear-patient; cardiac bypass, ECMO, cathlab
TEG / ROTEMWhole blood viscoelastic; trauma, cardiac surgery, liver transplant, obstetrics
PFA-100 / PFA-200Platelet function screening (simulates high-shear conditions)
Platelet mapping (TEG)Antiplatelet drug monitoring - ADP, arachidonic acid pathways
Multiplate / VerifyNowWhole blood impedance aggregometry for antiplatelet drugs

PART 3: THROMBOELASTOGRAPHY (TEG) vs ROTEM

Principle

Both are viscoelastic hemostatic assays (VHA) that measure whole-blood clot formation, strength, and lysis in real time. They assess all three phases of hemostasis simultaneously - primary, secondary, and fibrinolysis.
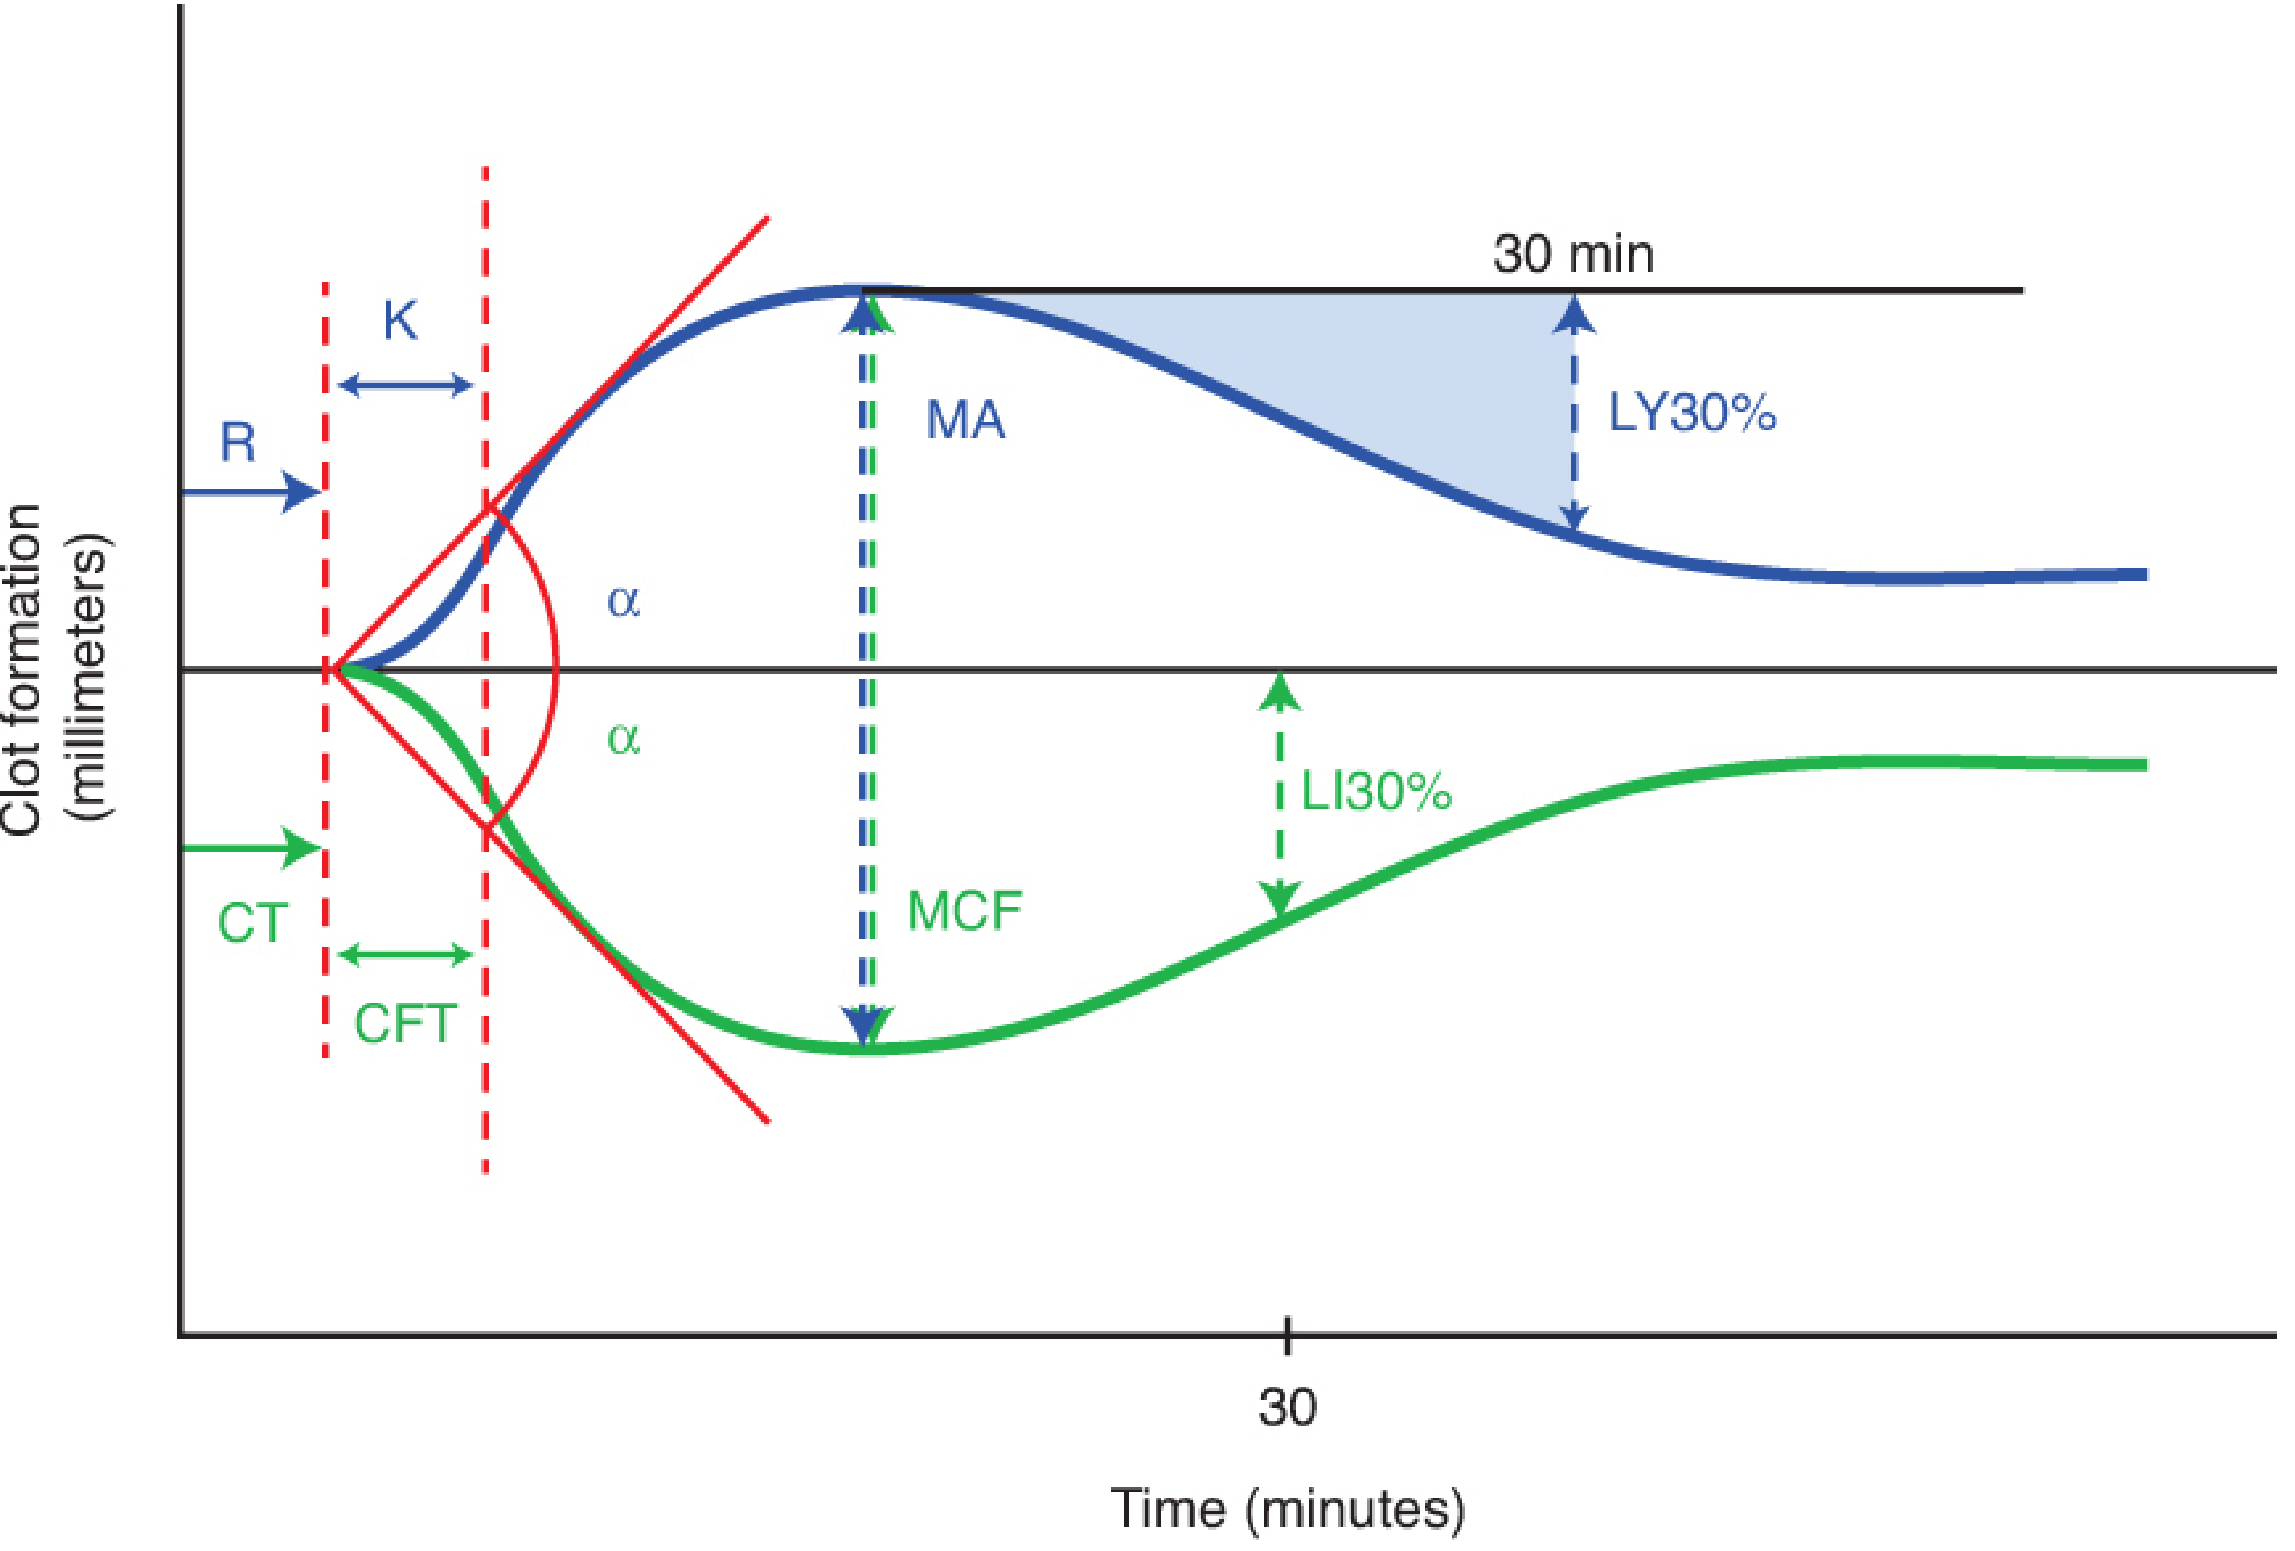
TEG (Hartert, 1948): rotating cup + stationary pin (torsion wire senses clot resistance) ROTEM: fixed cup + rotating pin (optical detector)
TEG vs ROTEM Tracing Parameters - Barash Clinical Anesthesia

Parameter Comparison Table (HIGH YIELD)

ParameterTEGROTEMMeasuresNormal Range (approx)
Clot initiationR (Reaction time)CT (Clotting time)Time to initial fibrin formation; prolonged by factor deficiency, heparinR: 2-8 min; CT: 100-240 sec
Clot formation kineticsK (Kinetics)CFT (Clot formation time)Time from initial clot to 20mm; reflects fibrinogen, plateletsK: 1-3 min; CFT: 30-110 sec
Rate of clot formationα angleα angleTangential angle to midline; low = slow fibrin/platelet buildupα: 47-74°; α: 63-83°
Maximum clot strengthMA (Maximum Amplitude)MCF (Maximum Clot Firmness)Clot strength; reflects platelet-fibrin interactionMA: 54-72 mm; MCF: 50-72 mm
FibrinolysisLY30 (% lysis at 30 min)LI30 (Lysis index at 30 min)Percent clot lysis at 30 min after MALY30 <7.5%; LI30 >85%
Overall coagulation indexCI (Coagulation Index)-Summary index-3 to +3
Memory trick: "R-K-Alpha-MA-LY" = "Really Kool Anaesthetists Monitor Lysis"

Mechanism Difference

FeatureTEGROTEM
Moving partCup rotates (~4-45°); pin stationaryPin rotates; cup stationary
Motion detectionTorsion wire (mechanical)Optical detector (less vibration artifact)
Sample volume0.35 mL whole blood0.34 mL whole blood
Temperature37°C37°C
Activator for standard testKaolin (intrinsic)Ellagic acid (intrinsic) = INTEM

ROTEM Assay Channels (HIGH YIELD for Exams)

ChannelActivatorWhat it TestsUse
EXTEMTissue Factor + phospholipidsExtrinsic pathway + plateletsOverall coagulation, like PT
INTEMEllagic acid (contact)Intrinsic pathway + plateletsLike aPTT, detects heparin effect
FIBTEMTF + cytochalasin D (platelet blocker)Fibrinogen contribution to clot onlyIsolates fibrinogen - low MCF = low fibrinogen
APTEMTF + aprotinin (anti-fibrinolytic)Confirms hyperfibrinolysisEXTEM - APTEM: if MCF improves → hyperfibrinolysis confirmed
HEPTEMEllagic acid + heparinaseNeutralizes heparinINTEM vs HEPTEM: difference = heparin effect

TEG Assay Variants

ChannelDetails
Kaolin TEGStandard intrinsic activation
Rapid TEG (rTEG)Kaolin + TF = faster results (10-15 min)
Functional Fibrinogen (FF)With platelet blocker - isolates fibrinogen contribution like ROTEM FIBTEM
Platelet MappingUses ADP/AA agonists - quantifies % platelet inhibition by antiplatelets

Interpretation of Abnormal Patterns

PatternTEG/ROTEM FindingCauseTreatment
Prolonged R/CTLong time to initiationFactor deficiency, heparin, UFHFFP, reverse heparin (protamine)
Low MA/MCFWeak clotThrombocytopenia, platelet dysfunction, low fibrinogenPlatelets, fibrinogen concentrate/cryoprecipitate
Low FIBTEM MCF specificallyFibrinogen deficiencyMassive transfusion, DIC, liver failureFibrinogen concentrate, cryoprecipitate
High LY30 / Low LI30FibrinolysisDIC, post-cardiac surgery, prostate/liver surgery, traumaTranexamic acid, epsilon-aminocaproic acid
INTEM prolonged, HEPTEM normalHeparin effectUnintentional heparinProtamine
Narrow flat tracingAnticoagulation/no clotFull heparinization, severe factor deficiencyDepends on cause

TEG vs ROTEM: Key Differences (Exam Table)

FeatureTEGROTEM
Cup movementCup rotatesPin rotates
Motion detectionTorsion wireOptical
Susceptibility to vibrationHigherLower
Standard activatorKaolinEllagic acid (INTEM)
Fibrinogen channelFunctional Fibrinogen (FF)FIBTEM
Heparin neutralizationhTEG (heparinase)HEPTEM
Hyperfibrinolysis confirmationCFF + kaolin TEG comparisonAPTEM vs EXTEM
Result units for max strengthMA (mm)MCF (mm)
Lysis measureLY30 (% lysis)LI30 (% remaining clot)
Portability/POCTEG 6s (newer, cartridge-based)ROTEM delta/sigma
Evidence baseCardiac surgery, liver transplantCardiac surgery, trauma, major obstetric hemorrhage

Clinical Applications of VHA (TEG/ROTEM)

  1. Cardiac surgery (CPB): guides transfusion, detects residual heparin, diagnoses coagulopathy post-bypass
  2. Major trauma / Damage Control Resuscitation: detects Trauma-Induced Coagulopathy (TIC) early - detects hyperfibrinolysis better than lab tests
  3. Liver transplantation: monitors dynamic coagulation changes (all phases), guides cryoprecipitate/FFP/platelet use
  4. Obstetric hemorrhage: detects hypofibrinogenemia early (FIBTEM MCF <12mm → fibrinogen <2g/L)
  5. Neurosurgery: detects hypercoagulable states
  6. ECMO: monitors anticoagulation
STS/SCA/AmSECT Guidelines: POC VHA use is a Class I, Level B-NR recommendation for guiding transfusion in perioperative bleeding. (Miller's Anesthesia 10e)

Limitations of VHA

  • Long testing time (30-45 min for complete assay) - though rTEG gives results in 10-15 min
  • Susceptible to vibration (especially TEG - less so ROTEM with optical detection)
  • Does NOT measure platelet aggregation directly (platelet mapping needed)
  • Cannot replace full lab workup in all settings
  • High inter-laboratory variability; need local reference ranges
  • Does not detect von Willebrand disease well

PART 4: PREVIOUS YEAR QUESTIONS (MD Anaesthesia Style)

Q1. Describe the coagulation cascade. What are the differences between the laboratory model and the in-vivo cell-based model? (10 marks)
Key points: intrinsic (XII→XI→IX→VIIIa+IXa→X) + extrinsic (TF-VIIa→X) + common (Xa+Va→thrombin→fibrin); Vitamin K-dependent factors (II, VII, IX, X); cell-based model - initiation/amplification/propagation phases; clinical significance of factor XII deficiency (no bleeding) vs factor XI deficiency (mild bleeding).
Q2. What is thromboelastography? Describe the parameters measured and their clinical significance. (10 marks)
Key: rotating cup + torsion wire principle; R (reaction time), K, alpha angle, MA, LY30; what each represents; interpretation of abnormal patterns; use in cardiac surgery/trauma/liver transplant.
Q3. Compare TEG and ROTEM. (5 marks)
Key comparison table: mechanical difference (cup vs pin rotation), activators, parameter nomenclature (R=CT, K=CFT, MA=MCF, LY30=LI30), ROTEM channels (EXTEM/INTEM/FIBTEM/APTEM/HEPTEM), applications.
Q4. What is the role of viscoelastic testing in perioperative blood management? (5 marks)
POC testing; superiority over conventional tests (whole blood, detects hyperfibrinolysis); Class I recommendation; guides targeted therapy (FFP for factor deficiency, cryoprecipitate/fibrinogen for FIBTEM MCF <10mm, platelets for low MA, TXA for high LY30); reduces allogeneic blood product use.
Q5. What are the limitations of routine coagulation tests (PT, aPTT) in perioperative settings? (5 marks)
Platelet-poor plasma; static test; miss hypothermia-induced coagulopathy; do not assess fibrinolysis, clot strength, platelet function; lab turnaround time; poor predictor of surgical bleeding.
Q6. What is FIBTEM and what is its clinical significance?
ROTEM channel with TF + cytochalasin D (platelet blocker); MCF reflects fibrinogen contribution only; MCF <10mm suggests fibrinogen deficiency requiring cryoprecipitate or fibrinogen concentrate; particularly useful in obstetric hemorrhage and cardiac surgery.
Q7. How does heparin affect TEG/ROTEM and how is it detected?
Heparin prolongs R (TEG) and CT (ROTEM INTEM). Detected by comparing INTEM vs HEPTEM (heparinase neutralizes heparin - if HEPTEM CT normalizes, heparin is the cause). On TEG, compare kaolin TEG vs heparinase TEG.

Quick Memory Summary

COAGULATION CASCADE:
Intrinsic: XII→XI→IX (+ VIII) → X       [aPTT]
Extrinsic: TF+VII → X                   [PT/INR]
Common: X+V → Thrombin → Fibrin → XIII→cross-linked fibrin

VIT K FACTORS: 1972 → II, VII, IX, X (+ C, S, Z)

TEG vs ROTEM:
R  = CT    (initiation - factor deficiency, heparin)
K  = CFT   (kinetics - fibrinogen, platelets)
α  = α     (rate of clot build-up)
MA = MCF   (strength - platelets + fibrinogen)
LY30 = LI30 (fibrinolysis)

ROTEM channels: EXTEM (extrinsic) | INTEM (intrinsic) | FIBTEM (fibrinogen) | APTEM (fibrinolysis) | HEPTEM (heparin)

Sources: Miller's Anesthesia 10e (Ch. 46, 50); Barash's Clinical Anesthesia 9e (Ch. 17); Robbins Pathologic Basis of Disease (Ch. 4); Harrison's Principles of Internal Medicine 22e (Ch. 122); Quick Compendium of Clinical Pathology 5e
This is a shared conversation. Sign in to Orris to start your own chat.