
Heart attack ecg
Reading File
ECG changes in a heart attack (myocardial infarction) follow a classic sequence: hyperacute T-waves early, then ST elevation, Q-wave development, and T-wave inversion. The specific leads affected tell you which coronary artery is involved.
Searching sources...
Finding Sources
Finding Sources
Reading File
Reading File
Reading File
Reading File
Reading File
Loading Image
Loading Image
Loading Image
Finding Sources
Here is a thorough breakdown of heart attack ECG findings, drawn from Harrison's, Ganong's, and Rosen's Emergency Medicine.
ECG Changes in Myocardial Infarction (Heart Attack)
Physiology Behind the Changes
When coronary artery occlusion cuts off blood supply to the myocardium, three electrical abnormalities develop in the infarcted cells:
| Defect | Current Flow | ECG Change |
|---|---|---|
| Rapid repolarization (K+ channels open) | Out of infarct | ST elevation |
| Decreased resting membrane potential (K+ loss) | Into infarct | TQ depression (recorded as ST elevation) |
| Delayed depolarization | Out of infarct | ST elevation |
All three changes produce the hallmark finding: ST segment elevation in leads overlying the infarct, with reciprocal ST depression in leads on the opposite side.
Temporal Evolution of ECG Changes
The ECG evolves through a characteristic sequence after coronary occlusion:
1. Hyperacute T-Waves (Minutes)
- Tall, peaked, broad T-waves appear within minutes of occlusion
- Represents the earliest sign of ischemia - often missed as it is transient
2. ST Elevation (Hours)
- The classic finding of STEMI
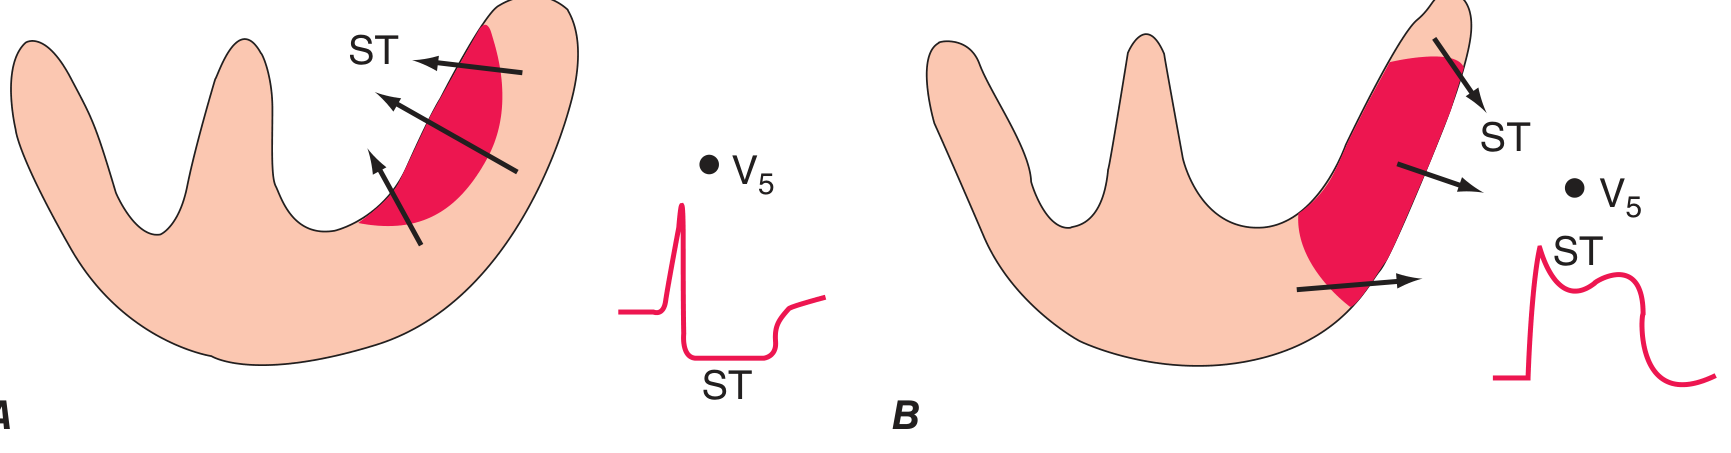
- Convex ("tombstone") or flat ST segment elevation
- Criteria: ≥1 mm in limb leads, ≥2 mm in precordial leads (≥2.5 mm in men <40 years, ≥1.5 mm in women in V2-V3)
- Reciprocal ST depression appears in mirror-image leads
The diagram below illustrates how subendocardial vs. transmural ischemia produce opposite ST vector directions:
3. Q-Wave Development (Hours to Days)
- Pathological Q waves appear as necrotic tissue becomes electrically silent
- Criteria: width ≥40 ms (≥0.04 s) or depth >25% of R-wave amplitude
- Reflect loss of depolarization forces in the infarcted zone
- Note: transmural infarcts may occur without Q waves ("non-Q wave MI"); subendocardial infarcts can sometimes produce Q waves
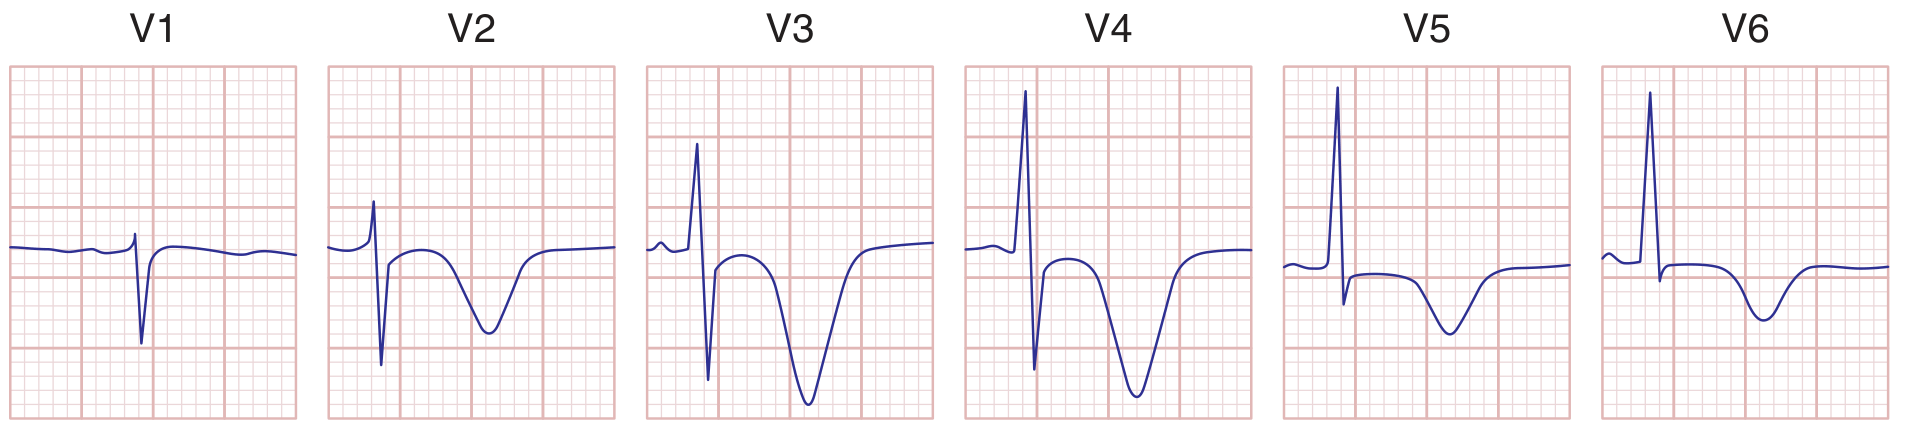
4. T-Wave Inversion (Days)
- Develops in same leads as ST elevation, typically within 24-48 hours
- May persist for weeks to months
5. ST Normalization (Days to Weeks)
- ST segments return toward baseline
- Persistent ST elevation (weeks or more) after Q-wave infarction suggests ventricular aneurysm or severe wall motion disorder
The precordial leads below show deep T-wave inversions in V1-V6 - the Wellens T-wave sign, indicating critical LAD stenosis:
Lead Localization - Where Is the Infarct?
| Territory | Leads with ST Elevation | Likely Artery |
|---|---|---|
| Anterior | V1-V4 | LAD (left anterior descending) |
| Anterolateral | V1-V6, I, aVL | LAD or LCx (left circumflex) |
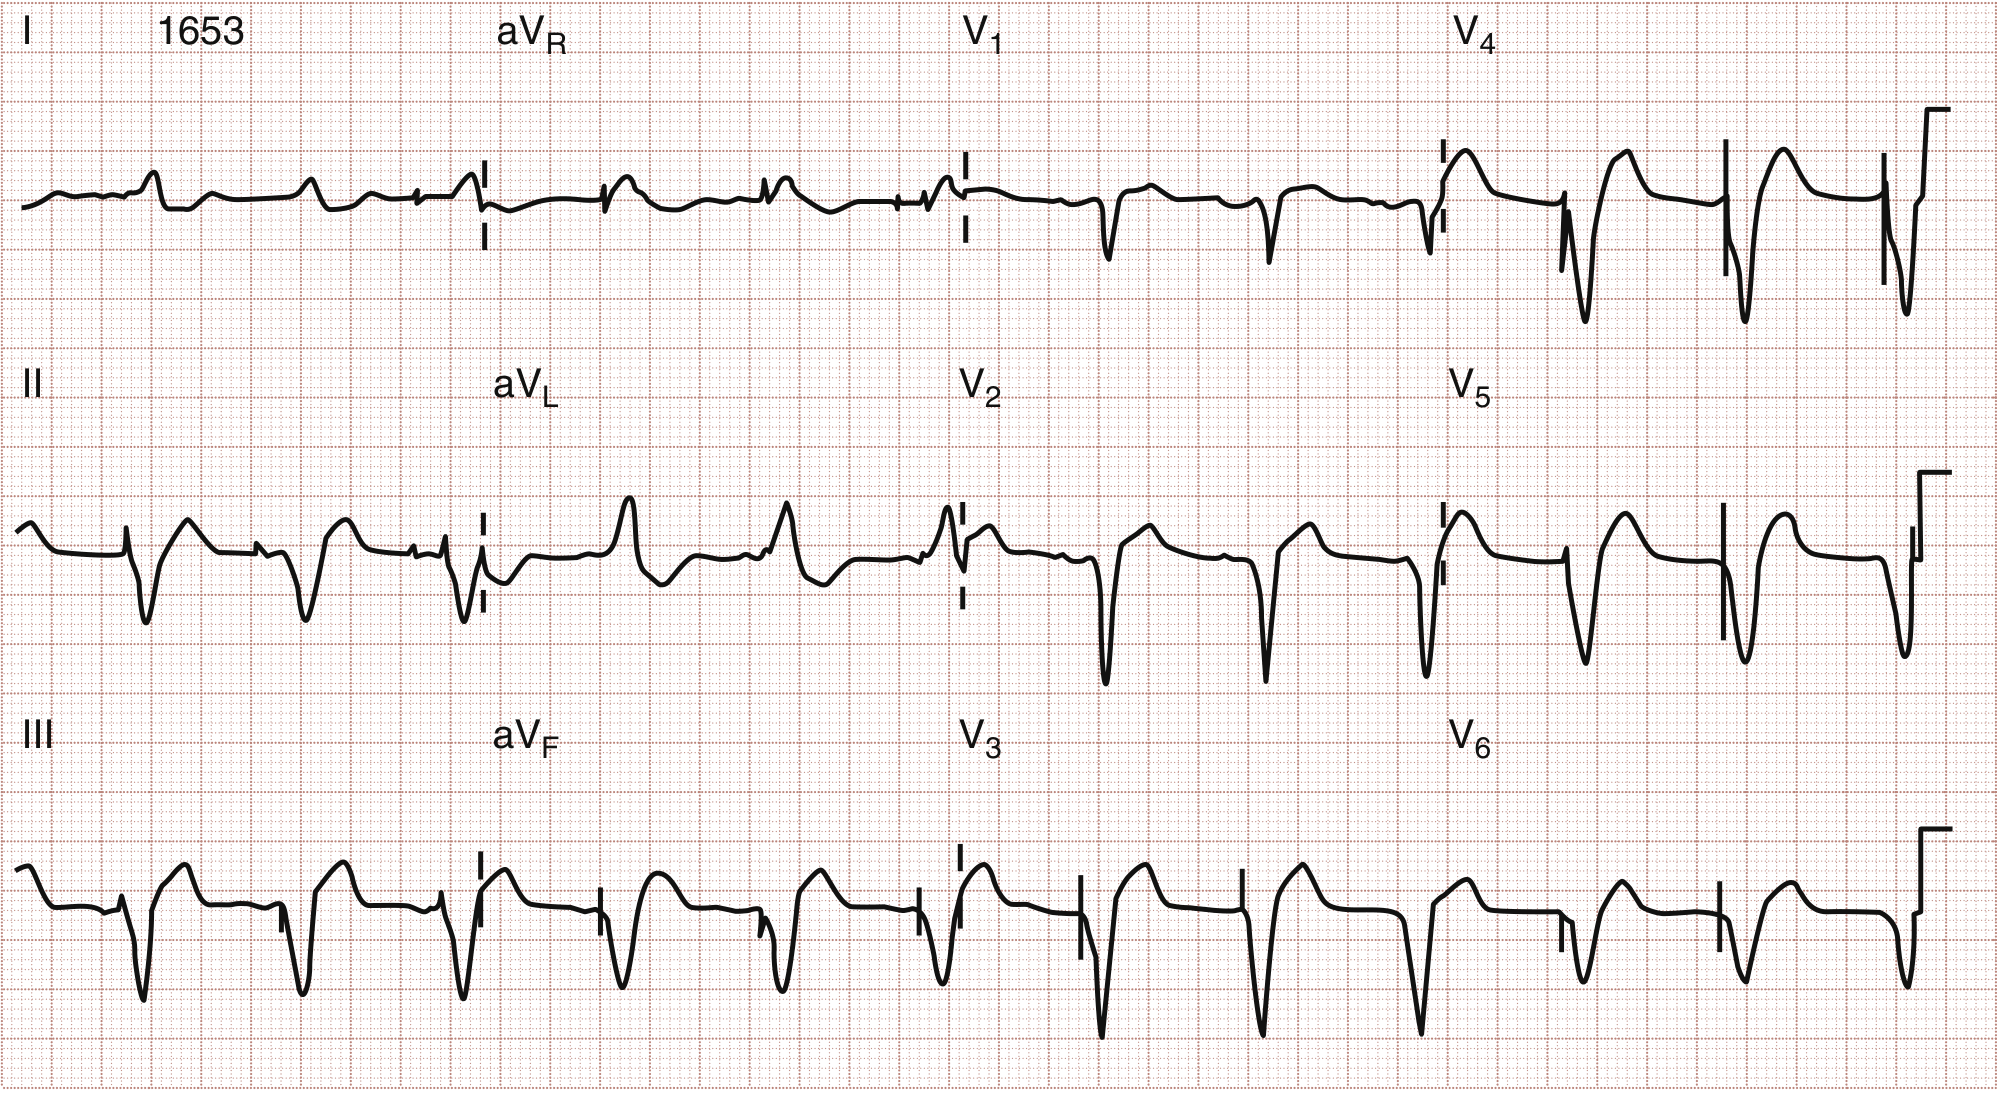
| Lateral | I, aVL, V5-V6 | LCx or diagonal branch |
| Inferior | II, III, aVF | RCA (right coronary artery) |
| Posterior | Reciprocal ST depression V1-V3; tall R in V1 | RCA or LCx |
| Right ventricular | V4R (right-sided leads) | Proximal RCA |
For posterior MI, there are no directly overlying leads in a standard 12-lead - it is recognized by reciprocal ST depression in V1-V3 and a tall R-wave in V1. Right-sided leads (especially V4R) are needed to detect right ventricular infarction, which occurs with proximal RCA occlusion.
The ECG below shows a real STEMI with concordant ST elevation in I and aVL (lateral wall MI):
STEMI vs. NSTEMI
| STEMI | NSTEMI | |
|---|---|---|
| ECG | ST elevation ≥1-2 mm in ≥2 contiguous leads | ST depression, T-wave inversion, or normal ECG |
| Biomarkers | Elevated troponin | Elevated troponin (required for diagnosis) |
| Mechanism | Complete occlusion | Partial occlusion or demand ischemia |
| Reperfusion | Emergency PCI within 90 min | Risk-stratified approach |
Important Mimics and Pitfalls
- Left Bundle Branch Block (LBBB): masks ischemic changes; new LBBB in chest pain treated as STEMI equivalent (Sgarbossa criteria used)
- Benign Early Repolarization: ST elevation in young patients, concave morphology, "fishhook" J-point notching
- Pericarditis: diffuse saddle-shaped ST elevation in most leads, PR depression
- Hyperkalemia: peaked T-waves can mimic hyperacute T-waves
- Takotsubo (stress) cardiomyopathy: can produce STEMI pattern without coronary occlusion
- WPW preexcitation: can mask or simulate ischemic changes
A normal ECG does not rule out MI - it occurs in a minority of true infarctions. Serial ECGs every 20-30 minutes and ST-trend monitoring significantly improve sensitivity for STEMI detection.
Sources: Harrison's Principles of Internal Medicine 22E (2025); Ganong's Review of Medical Physiology 26E; Rosen's Emergency Medicine 9E; Tintinalli's Emergency Medicine
This is a shared conversation. Sign in to Orris to start your own chat.