ECG reports
Asking for Preferences
Reading File
Finding Sources
Searching the Web
ECG normal vs abnormal findings interpretation 2025
Finding Sources
Finding Sources
Finding Sources
Reading File
Finding Sources
Reading File
Reading File
Reading File
Finding Sources
Reading File
Finding Sources
Loading Image
Loading Image
Here is a comprehensive guide to ECG Normal vs. Abnormal Findings:
The Normal ECG — Waves, Intervals & Segments

Fig. 4.17 — Normal ECG waveform (Lead II). — Costanzo Physiology, 7th Ed.
The ECG records potential differences on the body surface that reflect the sequence of cardiac depolarization and repolarization.
Normal Parameters
Heart Rate
| Age Group | Normal Range |
|---|---|
| Adult | 60–100 bpm |
| Neonate | Up to 220 bpm (sinus tachycardia) |
Intervals & Segments
| Component | Normal Value | Represents |
|---|---|---|
| P wave | <120 ms, upright in II, negative in aVR | Atrial depolarization |
| PR interval | 120–200 ms (adult) | Atrial → AV node → His bundle conduction |
| QRS complex | <120 ms | Ventricular depolarization |
| ST segment | Isoelectric (flat) | Plateau phase of ventricular action potential |
| T wave | Upright in most leads | Ventricular repolarization |
| QT interval | <440–460 ms (corrected, QTc) | Ventricular depolarization to end of repolarization |
Key ECG Components Explained
P Wave
- Normally positive in lead II, negative in aVR (sinus rhythm)
- May be biphasic in V1 (small positive right atrial component, small negative left atrial component — both normal)
- Abnormal: retrograde P waves (negative in II, positive in aVR) → ectopic atrial or junctional pacemaker
PR Interval
- Normal: ~160 ms (range 120–200 ms)
- Prolonged → AV nodal conduction delay (e.g., 1st-degree heart block)
- Shortened → pre-excitation (e.g., WPW syndrome) or enhanced AV conduction
QRS Complex
- Phase 1: Septal depolarization (left → right) → small r in V1, small q in V6
- Phase 2: LV dominates → S wave in V1, tall R in V6
- Widened (≥120 ms) → bundle branch block, ventricular pacing, hyperkalemia
ST Segment & T Wave
- Normally isoelectric; corresponds to the action potential plateau
- ST elevation → acute STEMI, pericarditis, Brugada pattern, early repolarization, LV aneurysm
- ST depression → subendocardial ischemia, digoxin effect, strain pattern
- T-wave inversion → ischemia, ventricular hypertrophy, bundle branch blocks (secondary), PE
Major Abnormal Findings
1. Bundle Branch Blocks
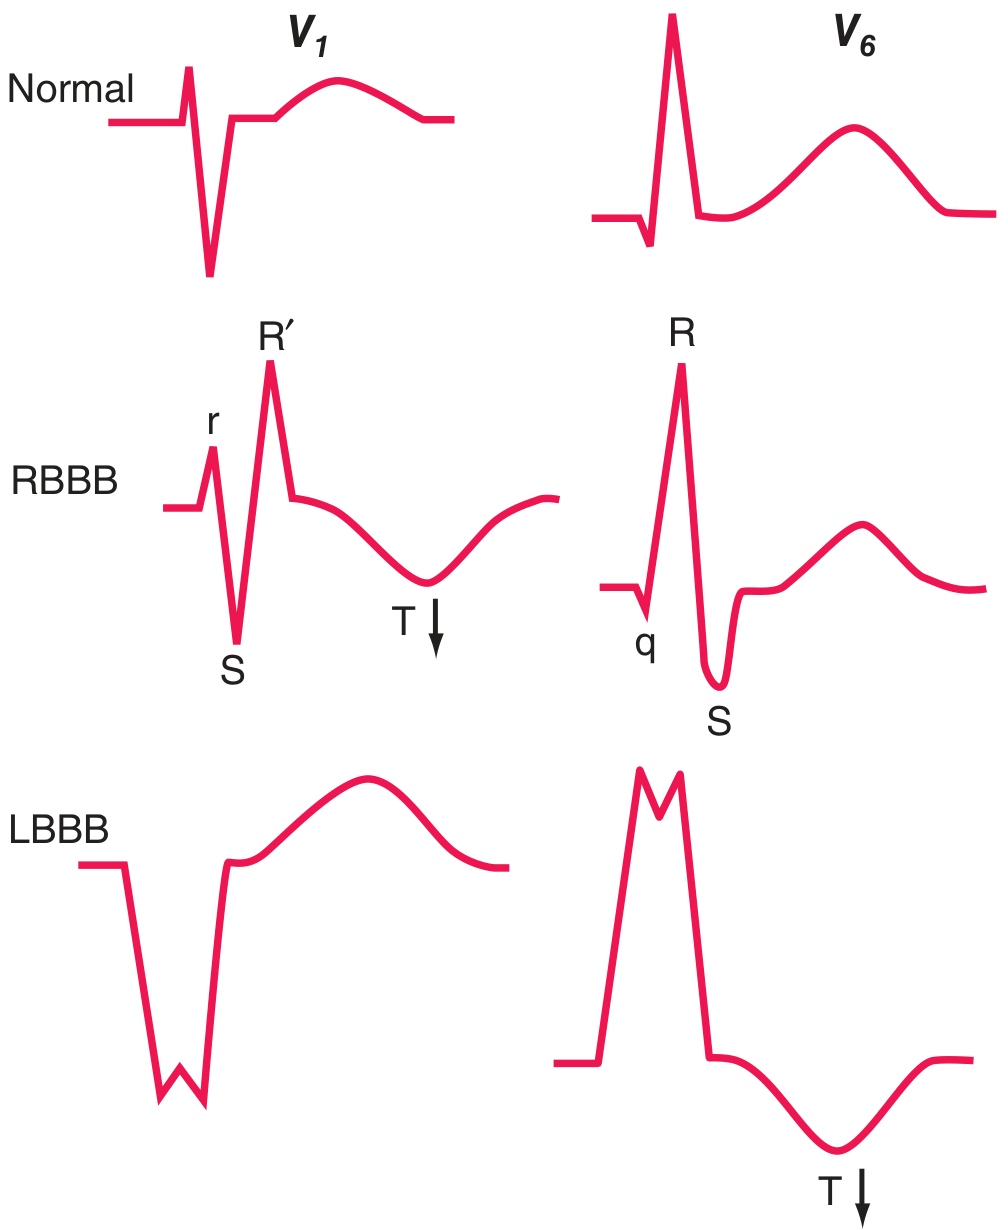
Fig. 247-10 — Normal, RBBB, and LBBB patterns in V1 and V6. Note secondary T-wave inversions. — Harrison's Principles of Internal Medicine, 22nd Ed.
| Pattern | QRS | V1 | V6 | Clinical Significance |
|---|---|---|---|---|
| RBBB | ≥120 ms | rSR' ("rabbit ears") | qRS | Can be normal; also ASD, PE, ischemia |
| LBBB | ≥120 ms | Wide QS | Tall broad R | Often marker of serious heart disease (CAD, HTN, cardiomyopathy) |
2. ST-Elevation — Differential Diagnosis
| Cause | Pattern |
|---|---|
| Acute MI (STEMI) | Regional, with reciprocal depressions |
| Acute pericarditis | Diffuse, saddle-shaped, PR depression |
| Brugada syndrome | Coved/saddle in V1–V2 with RBBB-like morphology |
| Early repolarization | Concave upward, mostly inferior/lateral leads |
| LV aneurysm | Persistent elevation after prior MI |
| Hyperkalemia | Peaked T waves → wide QRS → sine wave |
| Hypothermia | J (Osborn) waves |
| Pulmonary embolism | S1Q3T3 pattern, RBBB |
3. QT Prolongation
- QTc >440 ms (men) / >460 ms (women) = abnormal
- Causes: drugs (antiarrhythmics, antipsychotics, antibiotics), hypokalemia, hypomagnesemia, congenital long QT syndrome
- Risk: torsades de pointes → ventricular fibrillation
4. Axis Deviation
| Axis | Degrees | Significance |
|---|---|---|
| Normal | −30° to +90° | — |
| Left axis deviation | −30° to −90° | LAFB, inferior MI, LVH, WPW |
| Right axis deviation | +90° to +180° | RVH, LPFB, lateral MI, PE, normal in children |
5. Hypertrophy Patterns
- LVH: Tall R in V5/V6 (>25 mm), deep S in V1; Sokolow-Lyon criterion: S(V1) + R(V5 or V6) ≥35 mm
- RVH: Tall R in V1, right axis deviation, strain pattern in V1–V3
6. Ischemia & Infarction Sequence
| Stage | ECG Change |
|---|---|
| Hyperacute | Tall, peaked ("hyperacute") T waves |
| Acute STEMI | ST elevation, loss of R wave |
| Evolving | Deep Q waves develop, ST normalizes |
| Old infarct | Persistent Q waves, T-wave inversion |
Anterior STEMI: ST elevation in V1–V4, I, aVL; reciprocal depression in II, III, aVF
Inferior STEMI: ST elevation in II, III, aVF; reciprocal depression in I, aVL
Inferior STEMI: ST elevation in II, III, aVF; reciprocal depression in I, aVL
Quick Reference: Normal Adult ECG Values
| Parameter | Normal Range |
|---|---|
| Heart rate | 60–100 bpm |
| PR interval | 120–200 ms |
| QRS duration | <120 ms |
| QTc | <440 ms (men), <460 ms (women) |
| QRS axis | −30° to +90° |
| P wave axis | 0° to +75° (upright in I and II) |
Sources: Harrison's Principles of Internal Medicine, 22nd Ed.; Costanzo Physiology, 7th Ed.; Tintinalli's Emergency Medicine
This is a shared conversation. Sign in to Orris to start your own chat.