
Movement disorder
What aspect of movement disorders are you interested in? · What is your purpose?
How to approach clinically for a pt presented with movement disorder
movement disorder clinical classification diagram hyperkinetic hypokinetic
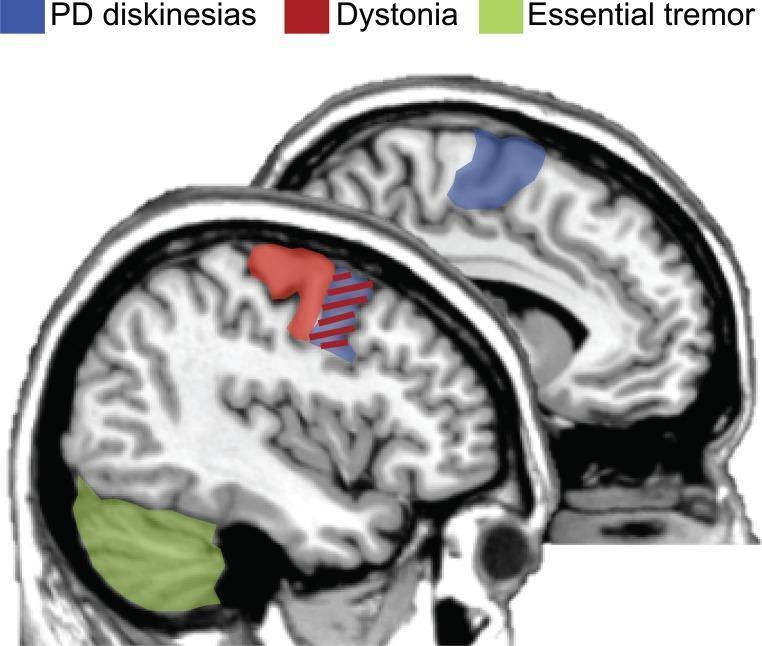
This medical diagram displays two sagittal brain slices, likely based on T1-weighted MRI or CT imaging, used to illustrate optimal neuroanatomical targets for repetitive transcranial magnetic stimulation (rTMS) in treating hyperkinetic movement disorders. The image employs a color-coded mapping system: blue highlights the premotor regions and supplementary motor area (SMA) as targets for Parkinson's Disease (PD) levodopa-induced dyskinesias; red highlights the primary motor and premotor cortices for dystonia; and green highlights the cerebellum as the preferred site for essential tremor. A red and blue striped overlay designates the premotor region as an overlapping therapeutic target for both dyskinesias and dystonia. The upper slice focuses on the superior cortical regions (SMA/premotor), while the lower slice demonstrates the spatial relationship between the motor cortex and the posterior-inferiorly located cerebellum. This visual resource serves as a clinical guide for neuromodulation protocols in neurology and neurosurgery, specifically addressing movement disorder pathophysiology.
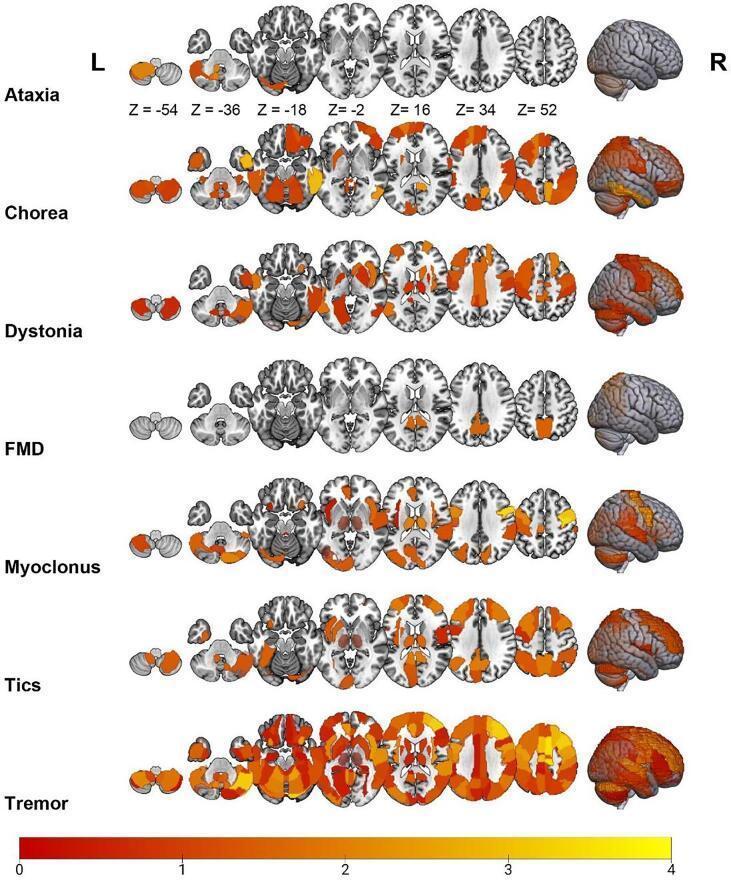
This diagnostic image provides a comparative overview of resting-state fMRI (rs-fMRI) alterations in Hyperkinetic Movement Disorders (HMD). It displays axial slices and 3D surface-rendered brains for seven phenotypes: Ataxia, Chorea, Dystonia, Functional Movement Disorder (FMD), Myoclonus, Tics, and Tremor. The visualization utilizes ALFF (Amplitude of Low-Frequency Fluctuations) and ReHo (Regional Homogeneity) analysis methods. A heat map scale at the bottom (0 to 4) indicates the degree of regional involvement based on the standardized mean difference (SMD), with colors progressing from deep red (lower involvement) to bright yellow (higher involvement). Key observations include primary cerebellar involvement in Ataxia; widespread cortical and subcortical alterations in Chorea and Tremor; and prominent sensorimotor cortex involvement in Dystonia. Tremor exhibits the most extensive and intense alterations across both hemispheres, including the cerebellum and cerebral cortex. FMD shows more localized cortical changes, while Tics demonstrate involvement in the frontal cortices and basal ganglia structures. This educational visualization assists in identifying neuroanatomical signatures and commonalities, such as cerebellar-thalamo-cortical pathway dysfunction, across different movement disorders.

This clinical flow diagram illustrates a digital pseudonymization and movement analysis procedure for infants. The sequence is divided into three stages: (A) Original clinical photograph of an infant in a supine position, with a black bar obscuring the eyes for initial privacy. (B) Body key point extraction using OpenPose software, showing a multi-colored skeletal overlay that maps anatomical landmarks including joints, limbs, and facial features (eyes and nose). (C) Automated de-identification where a blurring mask is applied to the facial region, specifically targeting the ocular and nasal areas to preserve anonymity while maintaining the visibility of the rest of the body. An inset magnification highlights the efficacy of the facial blurring mask. This process is relevant for pediatric research and diagnostic neurology, specifically in the automated classification of 'fidgety movements' (FM) to assess neurodevelopmental risks without compromising patient privacy.
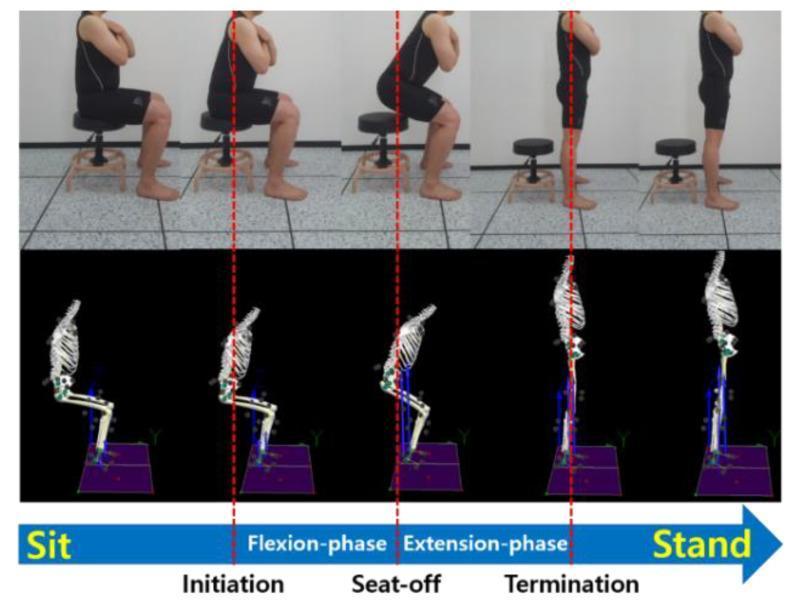
A multi-panel clinical biomechanics diagram illustrating the sit-to-stand (STD) movement. The image is divided into a top row of clinical photographs showing a person and a bottom row of matching skeletal motion-capture models. The sequence depicts five stages of movement: Initial Sit, Initiation, Seat-off, Termination, and Final Stand. Vertical dashed red lines align key timepoints across both rows. The movement is categorized into a 'Flexion-phase' (initiation to seat-off) characterized by forward trunk lean and increasing hip flexion, and an 'Extension-phase' (seat-off to termination) where the trunk, hips, and knees move toward full vertical alignment. In the clinical photos, the subject maintains arms crossed over the chest to isolate lower extremity and trunk mechanics. The skeletal models emphasize joint angles of the spine, femur, and tibia relative to a force plate and coordinate grid. This visual is designed for kinesiology and physical therapy education to demonstrate postural transitions, center of mass shifts, and phase-specific joint kinematics during functional mobility.
Parkinson disease resting tremor bradykinesia clinical signs
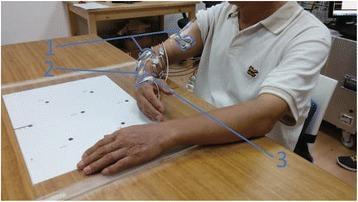
Clinical photograph of a neurophysiological experimental setup designed to study resting tremor in Parkinson’s disease. A subject is seated with their forearm resting on a height-adjustable table, maintaining a relaxed posture to facilitate tremor manifestation. The image illustrates three key components labeled numerically: (1) Bipolar surface Electromyography (EMG) electrodes positioned over several upper limb muscles, including the biceps brachii, triceps brachii, and various forearm flexors and extensors, to record muscle activity. (2) A motion sensor attached to the distal forearm used to capture kinematic data and track degrees of freedom in a magnetic field. (3) Surface electrical stimulation electrodes placed on the dorsal skin of the hand, specifically targeting the innervation zone of the superficial radial nerve near the first interosseous space. This setup evaluates the inhibitory effects of cutaneous afferent stimulation on pathological tremor through simultaneous EMG and kinematic recording.
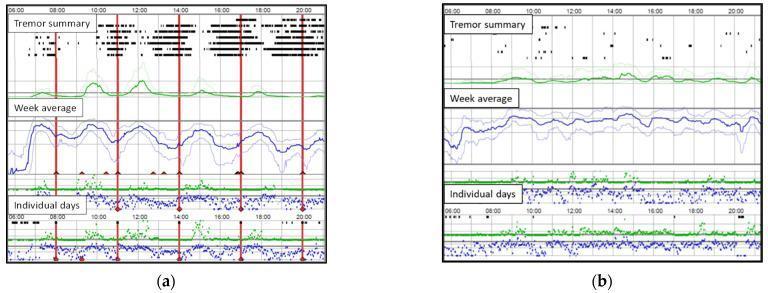
This diagnostic comparison chart displays two Parkinson’s KinetiGraph (PKG) recordings, (a) and (b), used to objectively monitor Parkinson's disease motor symptoms over a 24-hour timeframe (06:00 to 20:00). Each panel contains three primary sections: 'Tremor summary,' 'Week average,' and 'Individual days.' Panel (a) illustrates a 'wearing-off' phenomenon, characterized by dense black clusters in the Tremor summary and significant fluctuations in the Week average blue line (representing bradykinesia scores). These fluctuations correspond with vertical red lines indicating medication administration times, showing a cyclical pattern of symptom worsening before each dose. Panel (b) depicts a stable clinical state with minimal tremor activity and a relatively flat Week average line, indicating well-controlled motor symptoms without objective evidence of wearing-off. The PKG provides a continuous, quantitative assessment of bradykinesia and dyskinesia, aiding clinicians in adjusting dopaminergic therapies such as levodopa infusions. Key educational concepts include motor fluctuations, objective symptom monitoring, and the visualization of levodopa dose-response relationships.
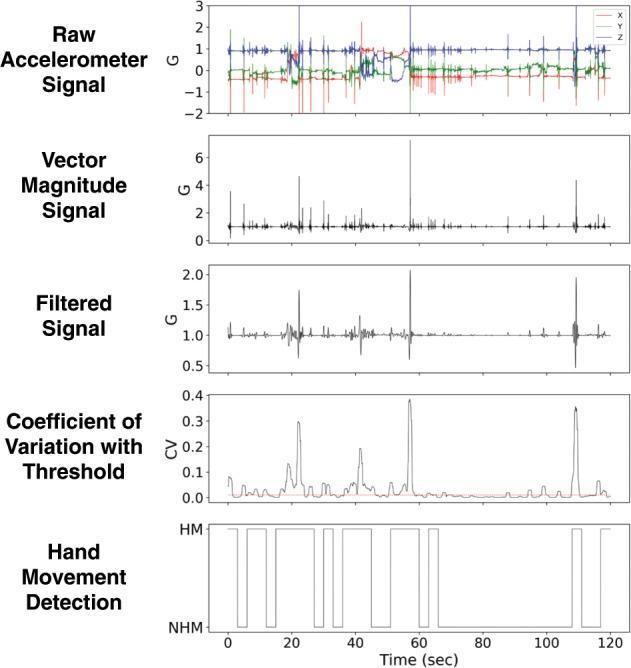
This infographic demonstrates a signal processing algorithm for detecting hand movement in clinical monitoring, particularly for Parkinson’s disease tremor and bradykinesia assessment. The image contains five stacked time-series graphs spanning 120 seconds. 1) Raw Accelerometer Signal: Shows triaxial (X, Y, Z) data from a wrist-worn sensor. 2) Vector Magnitude Signal: Represents the orientation-independent magnitude derived from the raw data. 3) Filtered Signal: Displays the data after a low-pass Butterworth filter is applied to remove high-frequency noise and tremor components. 4) Coefficient of Variation (CV) with Threshold: Illustrates a rolling CV calculation with an empirical threshold (red line at 0.01) to identify signal variability. 5) Hand Movement Detection: A binary classification output differentiating between ‘HM’ (Hand Movement) and ‘NHM’ (No Hand Movement) based on the CV exceeding the threshold. This sequence illustrates the data science pipeline used to extract objective motor symptoms from wearable sensors for diagnostic and treatment-monitoring purposes.
Clinical Approach to a Patient Presenting with Movement Disorder
Step 1 - First Question: Is the Movement Excess or Deficit?
| Category | Core Feature | Key Examples |
|---|---|---|
| Hypokinetic | Too little / slow movement | Parkinsonism, progressive supranuclear palsy (PSP), multiple system atrophy (MSA) |
| Hyperkinetic | Too much / involuntary movement | Tremor, chorea, dystonia, myoclonus, tics, athetosis, ballismus |
Step 2 - Characterize the Abnormal Movement (History + Observation)
A. Phenomenology - What does it look like?
| Movement Type | Key Features |
|---|---|
| Tremor | Rhythmic, oscillatory; classify by activation condition (rest, postural, kinetic) |
| Chorea | Irregular, random, flowing, dance-like; brief, unpredictable |
| Dystonia | Sustained or intermittent muscle contractions; twisting, repetitive postures |
| Myoclonus | Sudden, brief, shock-like jerks; can be positive (muscle contraction) or negative (asterixis) |
| Tics | Stereotyped, semi-voluntary; suppressible with urge; can be motor or phonic |
| Athetosis | Slow, writhing, continuous movements - especially distal limbs |
| Ballismus | Large-amplitude, flinging, proximal limb movements |
| Bradykinesia/Akinesia | Slowness and reduced amplitude of movements |
B. Tremor Sub-classification (critical, very common)
- Rest tremor - occurs with body part in complete repose; dampens with action. Classic for Parkinsonism. Pill-rolling (fingers), jaw, lips, tongue. Usually disappears during sleep.
- Postural tremor - elicited by maintaining a posture (arms outstretched). Seen in essential tremor, physiological tremor, drug-induced.
- Kinetic/Intention tremor - present throughout goal-directed movement, worsens approaching target. Classic for cerebellar disease.
- Dystonic tremor - slow, irregular, jerky; occurs in the body part affected by dystonia.
- Task-specific tremor - only during particular activities (e.g., writing tremor).
Step 3 - Directed History
- Acute onset: vascular (stroke), toxic/metabolic, drug-induced
- Subacute: autoimmune, infectious (encephalitis), paraneoplastic
- Chronic/progressive: neurodegenerative (PD, HD, Wilson's, spinocerebellar ataxias)
- Age of onset (young-onset favors Wilson's disease, DYT mutations, HD juvenile form)
- Family history (essential tremor, Huntington's, spinocerebellar ataxias are hereditary)
- Drug history - always ask about dopamine antagonists (antipsychotics, metoclopramide, prochlorperazine) - major cause of drug-induced parkinsonism
- Alcohol/substance use (alcohol improves essential tremor; worsens cerebellar)
- Exposures: MPTP, manganese, carbon monoxide
- Associated features: cognitive decline, autonomic symptoms, dysphagia, dysarthria, falls
- Fluctuation: better or worse at rest, with activity, with stress/anxiety
- Diurnal variation (dystonia in DYT5/dopa-responsive dystonia worsens in evening)
Step 4 - Systematic Neurological Examination
For Parkinsonism (Hypokinetic):
- Bradykinesia - finger-tapping (speed + amplitude decrement), hand open-close, foot tapping
- Rigidity - cogwheel or lead-pipe at wrist, elbow; activated by contralateral limb movement (Froment's maneuver)
- Rest tremor - observe hands at rest in lap; ask patient to do mental arithmetic (activates tremor)
- Postural instability - pull test (retropulsion); ask about falls
- Gait - shuffling, reduced arm swing, festination, freezing
- Facial expression - hypomimia (masked facies)
- Speech - hypophonia, monotone (PD); dysarthria (MSA, PSP)
- Eye movements - impaired vertical saccades (PSP - "downgaze palsy"), square wave jerks
- Autonomic assessment - orthostatic BP (MSA), bowel/bladder, sweating
For Hyperkinetic Disorders:
- Observe at rest, with posture maintained, during action, during walking
- Suppress-ability - can the patient voluntarily suppress? (yes = tics)
- Sensory trick (geste antagoniste) - touch relieves? (yes = dystonia)
- Distribution - focal, segmental, multifocal, generalized
- Rhythmicity - rhythmic = tremor; arrhythmic = chorea/myoclonus
- Cerebellar signs - dysmetria, dysdiadochokinesia, wide-based gait, nystagmus
- Cognitive screen - chorea + dementia = Huntington's; DLB
- Psychiatric features - behavioral changes (HD, Wilson's, neuroacanthocytosis)
- Kayser-Fleischer rings - slit-lamp in young patients with movement disorder (Wilson's disease)
Step 5 - Red Flag Features Suggesting Specific Diagnoses
| Red Flag | Think of |
|---|---|
| Young patient + hepatic dysfunction + psychiatric symptoms | Wilson's disease |
| Chorea + cognitive decline + psychiatric symptoms + family history | Huntington's disease |
| Parkinsonism + early falls + vertical gaze palsy | PSP |
| Parkinsonism + autonomic failure + cerebellar ataxia | MSA |
| Asymmetric parkinsonism + alien limb + myoclonus + apraxia | Corticobasal degeneration (CBD) |
| Parkinsonism + fluctuating cognition + visual hallucinations | DLB (Lewy body dementia) |
| Parkinsonism in someone on antipsychotics/metoclopramide | Drug-induced parkinsonism |
| Parkinsonism + lower body predominant + history of vascular risk factors | Vascular parkinsonism |
| Hemichorea/hemiballismus acute onset | Subthalamic nucleus stroke |
| Oculomotor crisis + recent antidopaminergic exposure | Acute dystonic reaction |
Step 6 - Features Differentiating Parkinsonian Syndromes
| Feature | PD | PSP | MSA-P | MSA-C | CBS | DLB |
|---|---|---|---|---|---|---|
| Bradykinesia | + | + | + | ± | + | ± |
| Rigidity | + | + | + | + | + | ± |
| Tremor | + | - | ± | ± | ± | ± |
| Ataxia | - | - | - | + | - | - |
| Dysautonomia | ± | ± | + | + | - | ± |
| Dementia | ± | + | ± | - | ± | + |
| Oculomotor deficit | - | + | - | + | + | ± |
| Asymmetrical findings | + | ± | ± | + | + | ± |
| L-dopa response | + | ± | ± | ± | - | ± |
| L-dopa dyskinesia | + | - | ± | - | - | - |
Step 7 - Investigations
- Bloods: FBC, U&E, LFTs, TFTs, calcium, glucose, B12, ceruloplasmin + serum copper + 24h urine copper (Wilson's in all young patients)
- Drug screen
- MRI brain - structural causes, "hummingbird sign" (PSP midbrain atrophy), "hot cross bun sign" (MSA pons), putaminal signal change
- DaTscan ([¹²³I]FP-CIT SPECT) - confirms dopaminergic deficit; differentiates neurodegenerative parkinsonism from drug-induced/functional (normal DaT in drug-induced)
- If young onset or family history: LRRK2, PARKIN, PINK1, GBA (PD); HTT CAG repeat (HD); ATP7B (Wilson's); SCA panels
- EMG/nerve conduction studies
- Accelerometry/tremor analysis
- If autoimmune/paraneoplastic suspected (anti-NMDAR, anti-LGI1, VGKC antibodies)
Step 8 - Functional (Psychogenic) Movement Disorder - Always Consider
- Abrupt onset
- Inconsistent or incongruous movements
- Response to placebo or suggestion
- Selective disability disproportionate to findings
- Dramatic resolution
- Maximum disability at onset (rather than progressive)
- Rhythmic shaking - entrainable (changes frequency when patient taps another limb at different rhythm)
- Bizarre gait not fitting any organic pattern
- Associated psychiatric history, significant life event, or secondary gain
Summary Algorithm
Movement Disorder Presentation
         |
         ├─ Is it EXCESS movement? → HYPERKINETIC
         │        ├─ Rhythmic? → TREMOR (rest/postural/intention)
         │        ├─ Flowing, random? → CHOREA
         │        ├─ Sustained twisting? → DYSTONIA
         │        ├─ Sudden jerks? → MYOCLONUS
         │        ├─ Suppressible with urge? → TICS
         │        └─ Large flinging? → BALLISMUS
         │
         └─ Is it REDUCED movement? → HYPOKINETIC / PARKINSONISM
                  ├─ Asymmetric + rest tremor + good L-dopa response → PD
                  ├─ Symmetric + early falls + vertical gaze palsy → PSP
                  ├─ Autonomic failure + cerebellar signs → MSA
                  ├─ Alien limb + apraxia + asymmetric → CBD
                  ├─ Dementia + hallucinations → DLB
                  └─ Drug history → Drug-induced parkinsonism