ECG
Asking for Preferences
Reading File
Finding Sources
Finding Sources
Searching Images
ECG electrocardiogram normal waves P QRS T interpretation
Finding Sources
Finding Sources
Searching Images
ECG leads placement 12 lead diagram
Reading File
Reading File
Reading File
Reading File
Loading Image
Loading Image
Reading File
I now have comprehensive content from Harrison's, Guyton, and Medical Physiology. Let me compile the complete ECG basics guide:
ECG Basics & Interpretation
What is an ECG?
When a cardiac impulse travels through the heart, electrical current spreads to the body's surface. Electrodes placed on the skin detect these potentials, and the recording is the electrocardiogram (ECG). — Guyton and Hall Textbook of Medical Physiology
The Cardiac Conduction System
The heartbeat originates in the sinoatrial (SA) node, which has spontaneous automaticity. From there, the impulse travels:
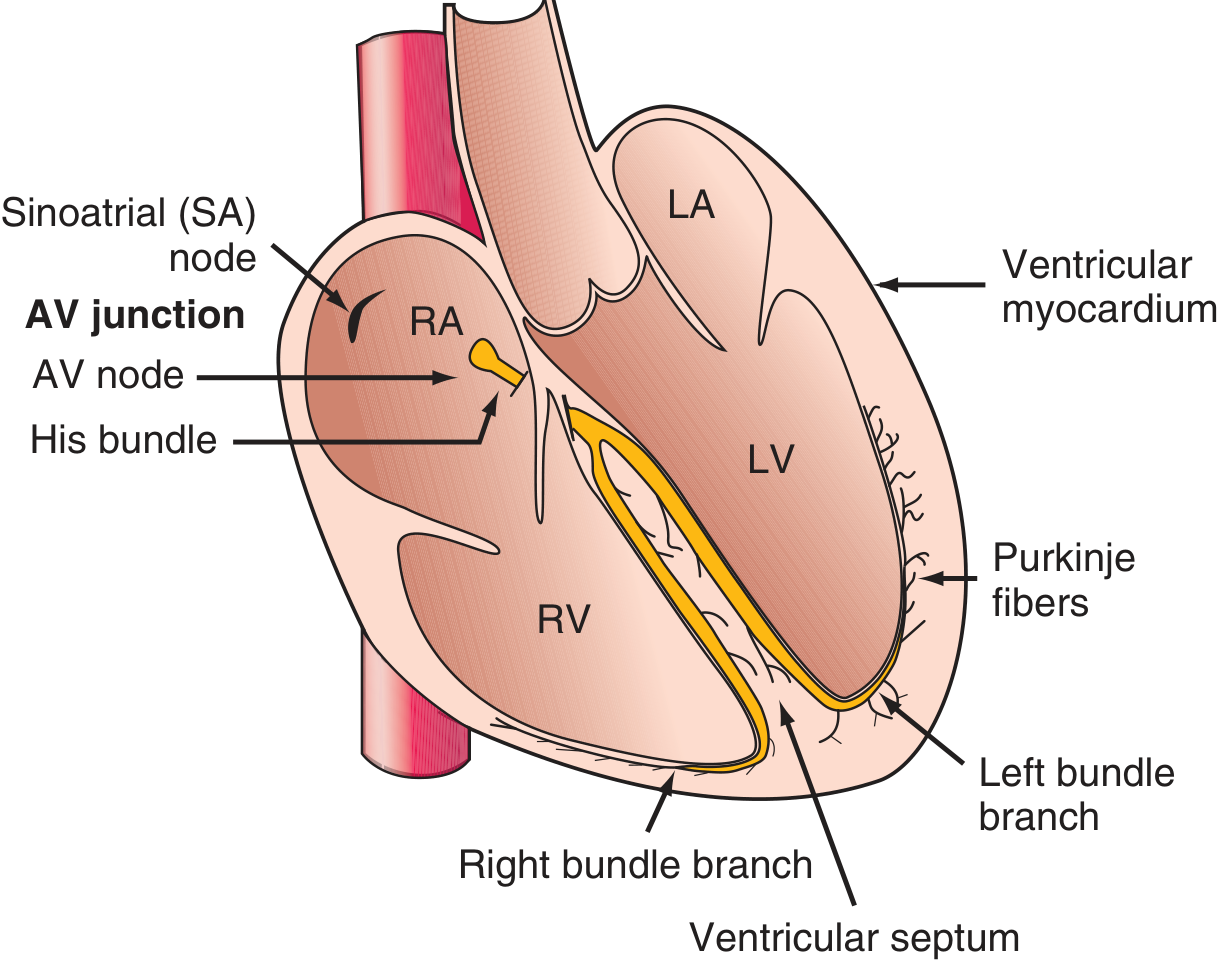
SA node → Atria → AV node → Bundle of His → Right & Left bundle branches → Purkinje fibers → Ventricular myocardium
The left bundle branch subdivides into left anterior and left posterior fascicles. Depolarization spreads endocardium → epicardium, triggering synchronized ventricular contraction. — Harrison's Principles of Internal Medicine, 22E
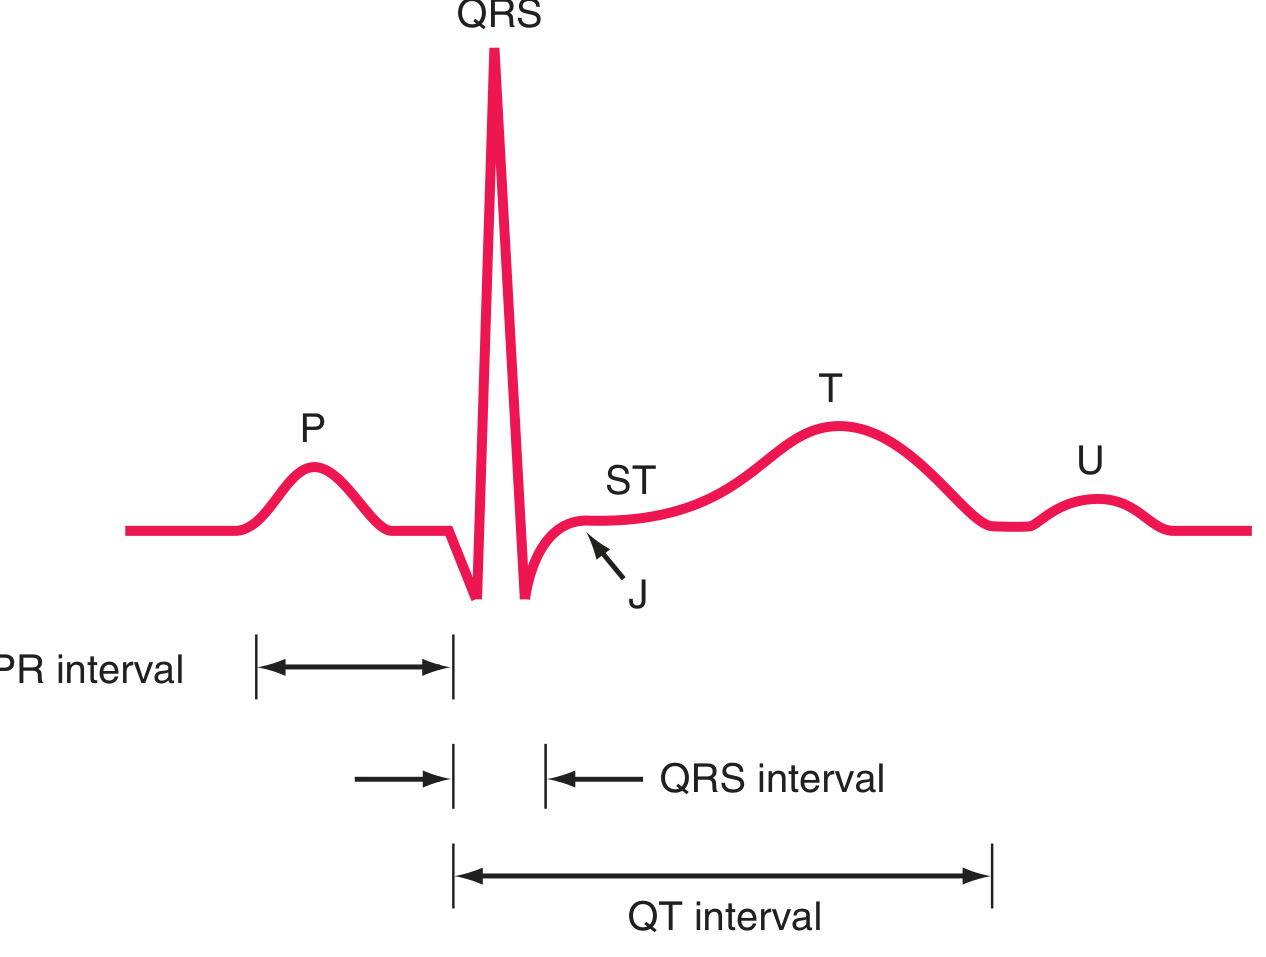
ECG Waveforms & What They Mean
| Wave/Complex | Represents | Normal |
|---|---|---|
| P wave | Atrial depolarization | Small, upright; positive in II, negative in aVR |
| PR interval | Atrial→ventricular conduction (AV node delay) | 120–200 ms (3–5 small boxes) |
| QRS complex | Ventricular depolarization | < 120 ms |
| ST segment | Isoelectric phase (plateau of action potential) | At baseline |
| T wave | Ventricular repolarization | Concordant with QRS in most leads |
| QT interval | Total ventricular depolarization + repolarization | QTc ≤ 460 ms (♀), ≤ 450 ms (♂) |
| U wave | Follows T wave; same polarity | Small; often due to Purkinje repolarization |
| J point | Junction of QRS end and ST segment start | At baseline |
The Q wave is the initial negative deflection; R wave is the first positive; S wave is the negative wave following R. Uppercase letters (Q, R, S) = large amplitude; lowercase (q, r, s) = small amplitude. — Medical Physiology (Boron & Boulpaep)
Depolarization vs. Repolarization
- P wave, QRS complex = depolarization waves (Na⁺ influx, phase 0 of action potential)
- T wave = repolarization wave (phase 3 of action potential)
- Atrial repolarization is buried within the QRS and usually invisible (occasionally seen in pericarditis or AV block)
- Factors slowing phase 0 (↓Na⁺ influx — hyperkalemia, flecainide) → widen QRS
- Factors prolonging phase 2/3 (amiodarone, hypocalcemia) → prolong QT
- Factors shortening repolarization (hypercalcemia, digoxin) → shorten QT — Harrison's
The 12 Leads
The 12-lead ECG is recorded from 6 limb leads (frontal plane) and 6 precordial leads (horizontal plane):
Limb Leads (Frontal Plane)
| Lead | Type | View |
|---|---|---|
| I | Bipolar | Left arm (+ pole) vs. right arm |
| II | Bipolar | Left leg vs. right arm (most useful rhythm lead) |
| III | Bipolar | Left leg vs. left arm |
| aVR | Augmented unipolar | Right arm (global negative in normal) |
| aVL | Augmented unipolar | Left arm (lateral view) |
| aVF | Augmented unipolar | Left foot (inferior view) |
Precordial Leads (Horizontal Plane)
| Lead | Position |
|---|---|
| V1 | 4th intercostal space, right sternal border |
| V2 | 4th intercostal space, left sternal border |
| V3 | Between V2 and V4 |
| V4 | 5th intercostal space, midclavicular line |
| V5 | Anterior axillary line (same horizontal level as V4) |
| V6 | Midaxillary line (same horizontal level) |
Each lead is analogous to a different camera angle looking at the same cardiac electrical event. A wave of depolarization toward a lead's positive pole = upright deflection; away = negative deflection. — Harrison's
Paper Speed & Calibration
- Standard speed: 25 mm/s
- 1 small box (1 mm) = 40 ms (0.04 s)
- 5 small boxes (1 large box) = 200 ms (0.20 s)
- Amplitude: 1 mV = 10 mm at standard calibration
- Heart rate = 300 ÷ number of large boxes between R waves (or 1500 ÷ small boxes)
A Systematic Approach to Reading Any ECG
| Step | What to Assess | Normal |
|---|---|---|
| 1. Rate | Count R–R intervals | 60–100 bpm |
| 2. Rhythm | Regular? P before every QRS? | Sinus rhythm |
| 3. P wave | Morphology, axis | Upright II, inverted aVR |
| 4. PR interval | Duration | 120–200 ms |
| 5. QRS duration | Wide or narrow? | < 120 ms |
| 6. QRS axis | Direction in I and aVF | −30° to +90° |
| 7. ST segment | Elevation or depression? | Isoelectric |
| 8. T waves | Upright? Inverted? Peaked? | Concordant with QRS |
| 9. QT interval | Rate-corrected QTc | ≤ 450 ms (♂), ≤ 460 ms (♀) |
| 10. R-wave progression | V1 → V6 transition | rS → RS → qR by V3–V4 |
Normal ECG Example
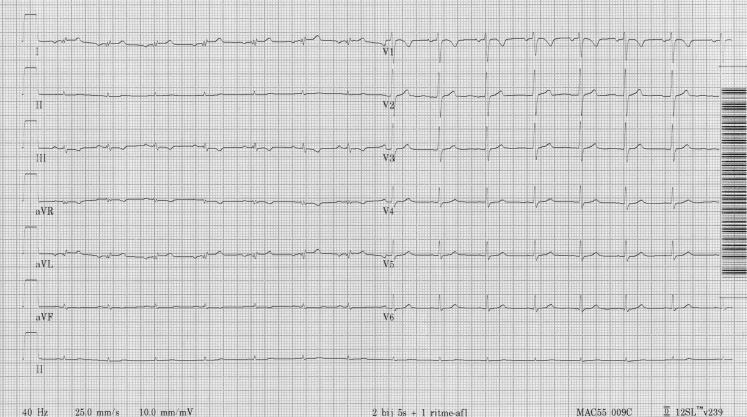
This tracing shows normal sinus rhythm: regular rate ~60–100 bpm, upright P waves preceding each narrow QRS, isoelectric ST segments, concordant T waves, and normal R-wave progression V1–V6.
Sources: Harrison's Principles of Internal Medicine 22E | Guyton and Hall Textbook of Medical Physiology | Medical Physiology (Boron & Boulpaep)
Want to go deeper on any specific area? For example: axis deviation, bundle branch blocks, ST changes (ischemia/infarction), arrhythmia recognition, or electrolyte effects on the ECG?
This is a shared conversation. Sign in to Orris to start your own chat.