
Hi, I am a 2nd yr BSc Cardiac Technology student wanted to prepar for my carrer as well as university exams also I wanted to do my higher studies on Msc physician assistant so I want your help for my preparation
What would you like to focus on first? · Which subjects are you currently studying or struggling with? · How would you prefer to learn/prepare?
Which subject areas are you covering in your 2nd year? · Which MSc Physician Assistant entrance exam are you targeting?
BSc Cardiac Technology 2nd year syllabus India subjects
MSc Physician Assistant entrance exam India eligibility syllabus 2025 2026
🫀 Your Complete Preparation Roadmap
BSc Cardiac Technology (2nd Year) + Career + MSc PA Entrance
📌 OVERVIEW: YOUR THREE GOALS AT A GLANCE
| Goal | Timeline | What It Needs |
|---|---|---|
| University Exams | Ongoing (each semester) | Subject mastery + MCQs + practicals |
| Career Readiness | Build now, apply after internship | Clinical skills + certifications + logs |
| MSc PA Entrance | After BSc completion | Pre-clinical sciences + GK + hospital experience |
📚 PART 1: SUBJECT-WISE STUDY PLAN (2nd Year)
1. 🫀 Cardiovascular Anatomy & Physiology
- Chambers, valves, great vessels - structure AND function
- Cardiac cycle (systole/diastole), pressure-volume loops
- Conduction system: SA node → AV node → Bundle of His → Purkinje fibers
- Frank-Starling law, preload, afterload, contractility
- Coronary circulation (LAD, LCx, RCA territories - critical for ECG)
- Draw the heart and label it repeatedly - anatomy sticks visually
- Link every anatomical structure to its physiological role
- Use Guyton & Hall (physiology) + Gray's Anatomy for Allied Health (anatomy)
2. ⚡ ECG Interpretation & Techniques
- Systematic ECG reading: Rate → Rhythm → Axis → P wave → PR interval → QRS → ST → T wave
- Normal values: PR 120-200ms, QRS <120ms, QTc <440ms (male) / <460ms (female)
- 12-lead electrode placement (must be perfect in practicals)
- Key arrhythmias: AFib, VTach, VFib, Heart block (1st/2nd/3rd degree), LBBB, RBBB
- ST changes: STEMI patterns by territory (anterior, inferior, lateral)
- ACS: STEMI vs NSTEMI vs Unstable Angina differentiation
- ECG Made Easy by John Hampton (best beginner-to-intermediate book)
- The Only EKG Book You'll Ever Need by Malcolm Thaler
- Practice with real ECG strips daily - even 5 ECGs/day adds up massively
3. 💊 Cardiac Pharmacology
| Drug Class | Key Drugs | Mechanism | Use |
|---|---|---|---|
| Beta blockers | Metoprolol, Atenolol, Carvedilol | Block β1 receptors → ↓HR, ↓BP | HTN, HF, post-MI, arrhythmias |
| ACE inhibitors | Ramipril, Enalapril | Block ACE → ↓Angiotensin II | HF, HTN, post-MI, CKD |
| ARBs | Losartan, Valsartan | Block AT1 receptor | Same as ACEi, ACEi intolerance |
| Statins | Atorvastatin, Rosuvastatin | Inhibit HMG-CoA reductase | Dyslipidemia, CAD prevention |
| Antiplatelets | Aspirin, Clopidogrel | COX-1 inhibition / P2Y12 block | ACS, post-PCI, post-stent |
| Anticoagulants | Heparin, Warfarin, NOACs | Various coagulation factors | DVT, AFib, PE, post-valve |
| Nitrates | GTN, ISDN | NO → vasodilation | Angina relief |
| Digoxin | Digoxin | Na/K ATPase inhibition | AFib rate control, HFrEF |
| Diuretics | Furosemide, Spironolactone | Loop/K-sparing | HF, HTN, edema |
| Antiarrhythmics | Amiodarone, Lidocaine | Vaughan-Williams classes | Arrhythmias |
4. 🔊 Echocardiography
- Physics of ultrasound: frequency, wavelength, Doppler effect
- 2D Echo views: Parasternal long axis (PLAX), Parasternal short axis (PSAX), Apical 4-chamber (A4C), Apical 2-chamber (A2C), Subcostal
- M-mode measurements: LV dimensions (LVEDD, LVESD), EF calculation
- Ejection Fraction (EF): Normal >55%; HFrEF <40%; HFmrEF 40-49%
- Basic valvular assessment: AS (peak gradient, AVA), MR (vena contracta), MS (MVA, PHT)
- Tissue Doppler, E/A ratio for diastolic function
- Echocardiography: A Practical Guide for Reporting by David Chambers
- YouTube channels: 123Sonography, EchoFirst (free, excellent visual learning)
5. 📊 Hemodynamics
- Cardiac Output = Heart Rate × Stroke Volume (normal CO: 4-8 L/min)
- Cardiac Index = CO / BSA (normal: 2.5-4.0 L/min/m²)
- Pressures to memorize (normal ranges):
- RA: 0-5 mmHg
- RV: 15-30 / 0-5 mmHg
- PA: 15-30 / 5-15 mmHg (mean <25)
- PCWP: 6-12 mmHg
- LV: 100-140 / 3-12 mmHg
- Aorta: 100-140 / 60-90 mmHg
- Fick principle for CO measurement
- Thermodilution method (Swan-Ganz catheter)
- Pulmonary hypertension classification (WHO groups)
6. 🩺 Cardiac Pathology (CAD, MI, HF, Valvular)
- Atherosclerosis pathogenesis: fatty streak → fibrous plaque → complicated plaque
- ACS spectrum: UA → NSTEMI → STEMI
- Troponin I/T kinetics (rises 3-4h, peaks 12-24h, normalizes 7-14 days)
- Killip classification for MI severity
- TIMI / GRACE risk scores
- HFrEF vs HFpEF vs HFmrEF definitions
- New York Heart Association (NYHA) Class I-IV
- Compensatory mechanisms (Frank-Starling, neurohormonal activation, hypertrophy)
- Treatment: GDMT = ACEi/ARB/ARNI + Beta blocker + MRA + SGLT2i (the "fantastic four")
- AS: Systolic murmur, Ejection click, narrow pulse pressure, Heaves - "SAD" (Syncope, Angina, Dyspnea)
- MR: Holosystolic murmur at apex radiating to axilla
- MS: Mid-diastolic rumble, Opening snap, Malar flush
- AR: Early diastolic murmur, collapsing pulse, wide pulse pressure
🏥 PART 2: CAREER PREPARATION
Skills to Build Right Now (During 2nd Year)
- ECG reading speed - Aim to read and report a 12-lead ECG in under 3 minutes
- Echo probe handling - Practice in lab; learn to acquire standard views confidently
- Cath lab familiarity - Understand radiation safety, sterile technique, contrast protocols
- Patient communication - Practice explaining procedures simply to patients
- Documentation - Write structured cardiac reports (ECG reports, echo reports)
Certifications to Target (During/After BSc)
- BLS (Basic Life Support) - Get this in 2nd year itself; AHA or Red Cross certified
- ACLS (Advanced Cardiac Life Support) - After BLS; critical for career advancement
- CardioSmart / Echocardiography certification - After BSc during internship
- Registered Cardiac Sonographer (RCS) or RDCS - Long-term international goal
Where Cardiac Technologists Work
- Cath labs (cardiac catheterization laboratories)
- ICUs / CCUs (Cardiac Care Units)
- OTs (for open-heart surgeries, pacemaker implants)
- Echocardiography labs
- Holter monitoring / Stress testing labs
- Electrophysiology labs
🎓 PART 3: MSc PHYSICIAN ASSISTANT PREPARATION
What MSc PA Programs Look For
- BSc in a healthcare field (Cardiac Technology qualifies)
- 50% or above aggregate
- Entrance exam (varies by university - AIIMS PA, CMC Vellore, SRM, Manipal, etc.)
- Interview + practical assessment at some institutes
MSc PA Entrance Exam - General Syllabus
- Anatomy (general + cardiovascular + respiratory)
- Physiology (cardiovascular, respiratory, renal, GI)
- Biochemistry (metabolism, enzymes, lab values)
- Pathology (inflammation, neoplasia, organ pathologies)
- Microbiology (basic bacteriology, common infections)
- Medicine: Common presentations (chest pain, dyspnea, edema, palpitations)
- Pharmacology: Mechanisms, drug interactions, ADRs
- Diagnostics: ECG, echo interpretation, lab interpretation
- Depending on the university
MSc PA Study Strategy (Start Now - 18 Month Plan)
- Every cardiac topic you study now = MSc entrance syllabus
- Rotate through multiple departments (not just cardio)
- Keep a clinical log / case diary (shows commitment at interviews)
- Attempt BLS/ACLS certification
- Solve previous years' papers from AIIMS, JIPMER PA exams
- Revise anatomy + physiology intensively
- Practice MCQ series (500+ MCQs/month)
📅 WEEKLY STUDY SCHEDULE (Template)
| Day | Focus Area | Activity |
|---|---|---|
| Monday | Anatomy / Physiology | Read + make notes (1.5 hr) |
| Tuesday | ECG / Arrhythmias | Theory + practice 5 ECG strips |
| Wednesday | Pharmacology | Drug class flashcards (Anki) |
| Thursday | Echocardiography | Concepts + YouTube visual learning |
| Friday | Pathology / Hemodynamics | Mechanism-based learning |
| Saturday | Mixed MCQs | 30-50 MCQs across all topics |
| Sunday | Revision + Weak areas | Review errors from the week |
📖 KEY BOOKS (Prioritized)
| Book | Subject | Priority |
|---|---|---|
| Guyton & Hall - Medical Physiology | Physiology | ⭐⭐⭐ Must-have |
| ECG Made Easy - John Hampton | ECG | ⭐⭐⭐ Must-have |
| Robbins Basic Pathology | Pathology | ⭐⭐⭐ Must-have |
| Katzung Basic & Clinical Pharmacology | Pharmacology | ⭐⭐⭐ Must-have |
| Gray's Anatomy for Students | Anatomy | ⭐⭐ Important |
| Echocardiography by David Chambers | Echo | ⭐⭐ Important |
| Harrison's Internal Medicine (select chapters) | Clinical | ⭐ Reference |
💡 TOP TIPS FOR YOU
- Connect every topic to ECG or Echo - This makes learning practical and memorable
- Use Anki flashcards for pharmacology drug facts - space repetition works
- Follow cardiology accounts on Instagram/X - @cardionerds, @ECGpedia for daily practice
- Keep a "clinical diary" now - write one interesting case per week from your practicals
- Start an MCQ habit from today - 20 MCQs/day adds 7,300 MCQs by end of the year
- Network with senior Cardiac Technologists - LinkedIn is great for this; they share job leads and exam tips
I don't want to prepare for MSC PA now I just gave my plan to you
- ✅ University exam preparation - subject-wise notes, explanations, MCQs
- ✅ Career skills - ECG, echo, cath lab, clinical knowledge
- "Explain the cardiac conduction system"
- "Give me 20 MCQs on ECG"
- "Explain heart failure mechanisms"
- "Notes on echocardiography views"
- "Pharmacology - anti-arrhythmic drugs"


This is the schedule I have prepared for university I A I give you the topic daily I just want you to give me a the complete notes for me from scratch with diagram, flow charts and table
- Phase 1 (Weeks 1-2) - Foundation: Heart Structure, Vessels, Vascular Pathology
- Phase 2 (Weeks 3-6) - Paper I: CAD, Valvular, Heart Failure, Arrhythmias, BLS
- Phase 3 (Weeks 7-10) - Paper II: Advanced ECG, TMT, Holter
- Phase 4 (Weeks 11-13) - Paper III: Echocardiography
Gross Anatomy of the Heart - chambers, valves, great vessels, pericardium + Sketch a 4-chamber cross-section with valves labelled
Start Day 1
📘 WEEK 1 - DAY 1
Gross Anatomy of the Heart: Chambers, Valves, Great Vessels & Pericardium
Source: Gray's Anatomy for Students | Fuster & Hurst's The Heart, 15th Ed
1. OVERVIEW - THE HEART AS A DOUBLE PUMP
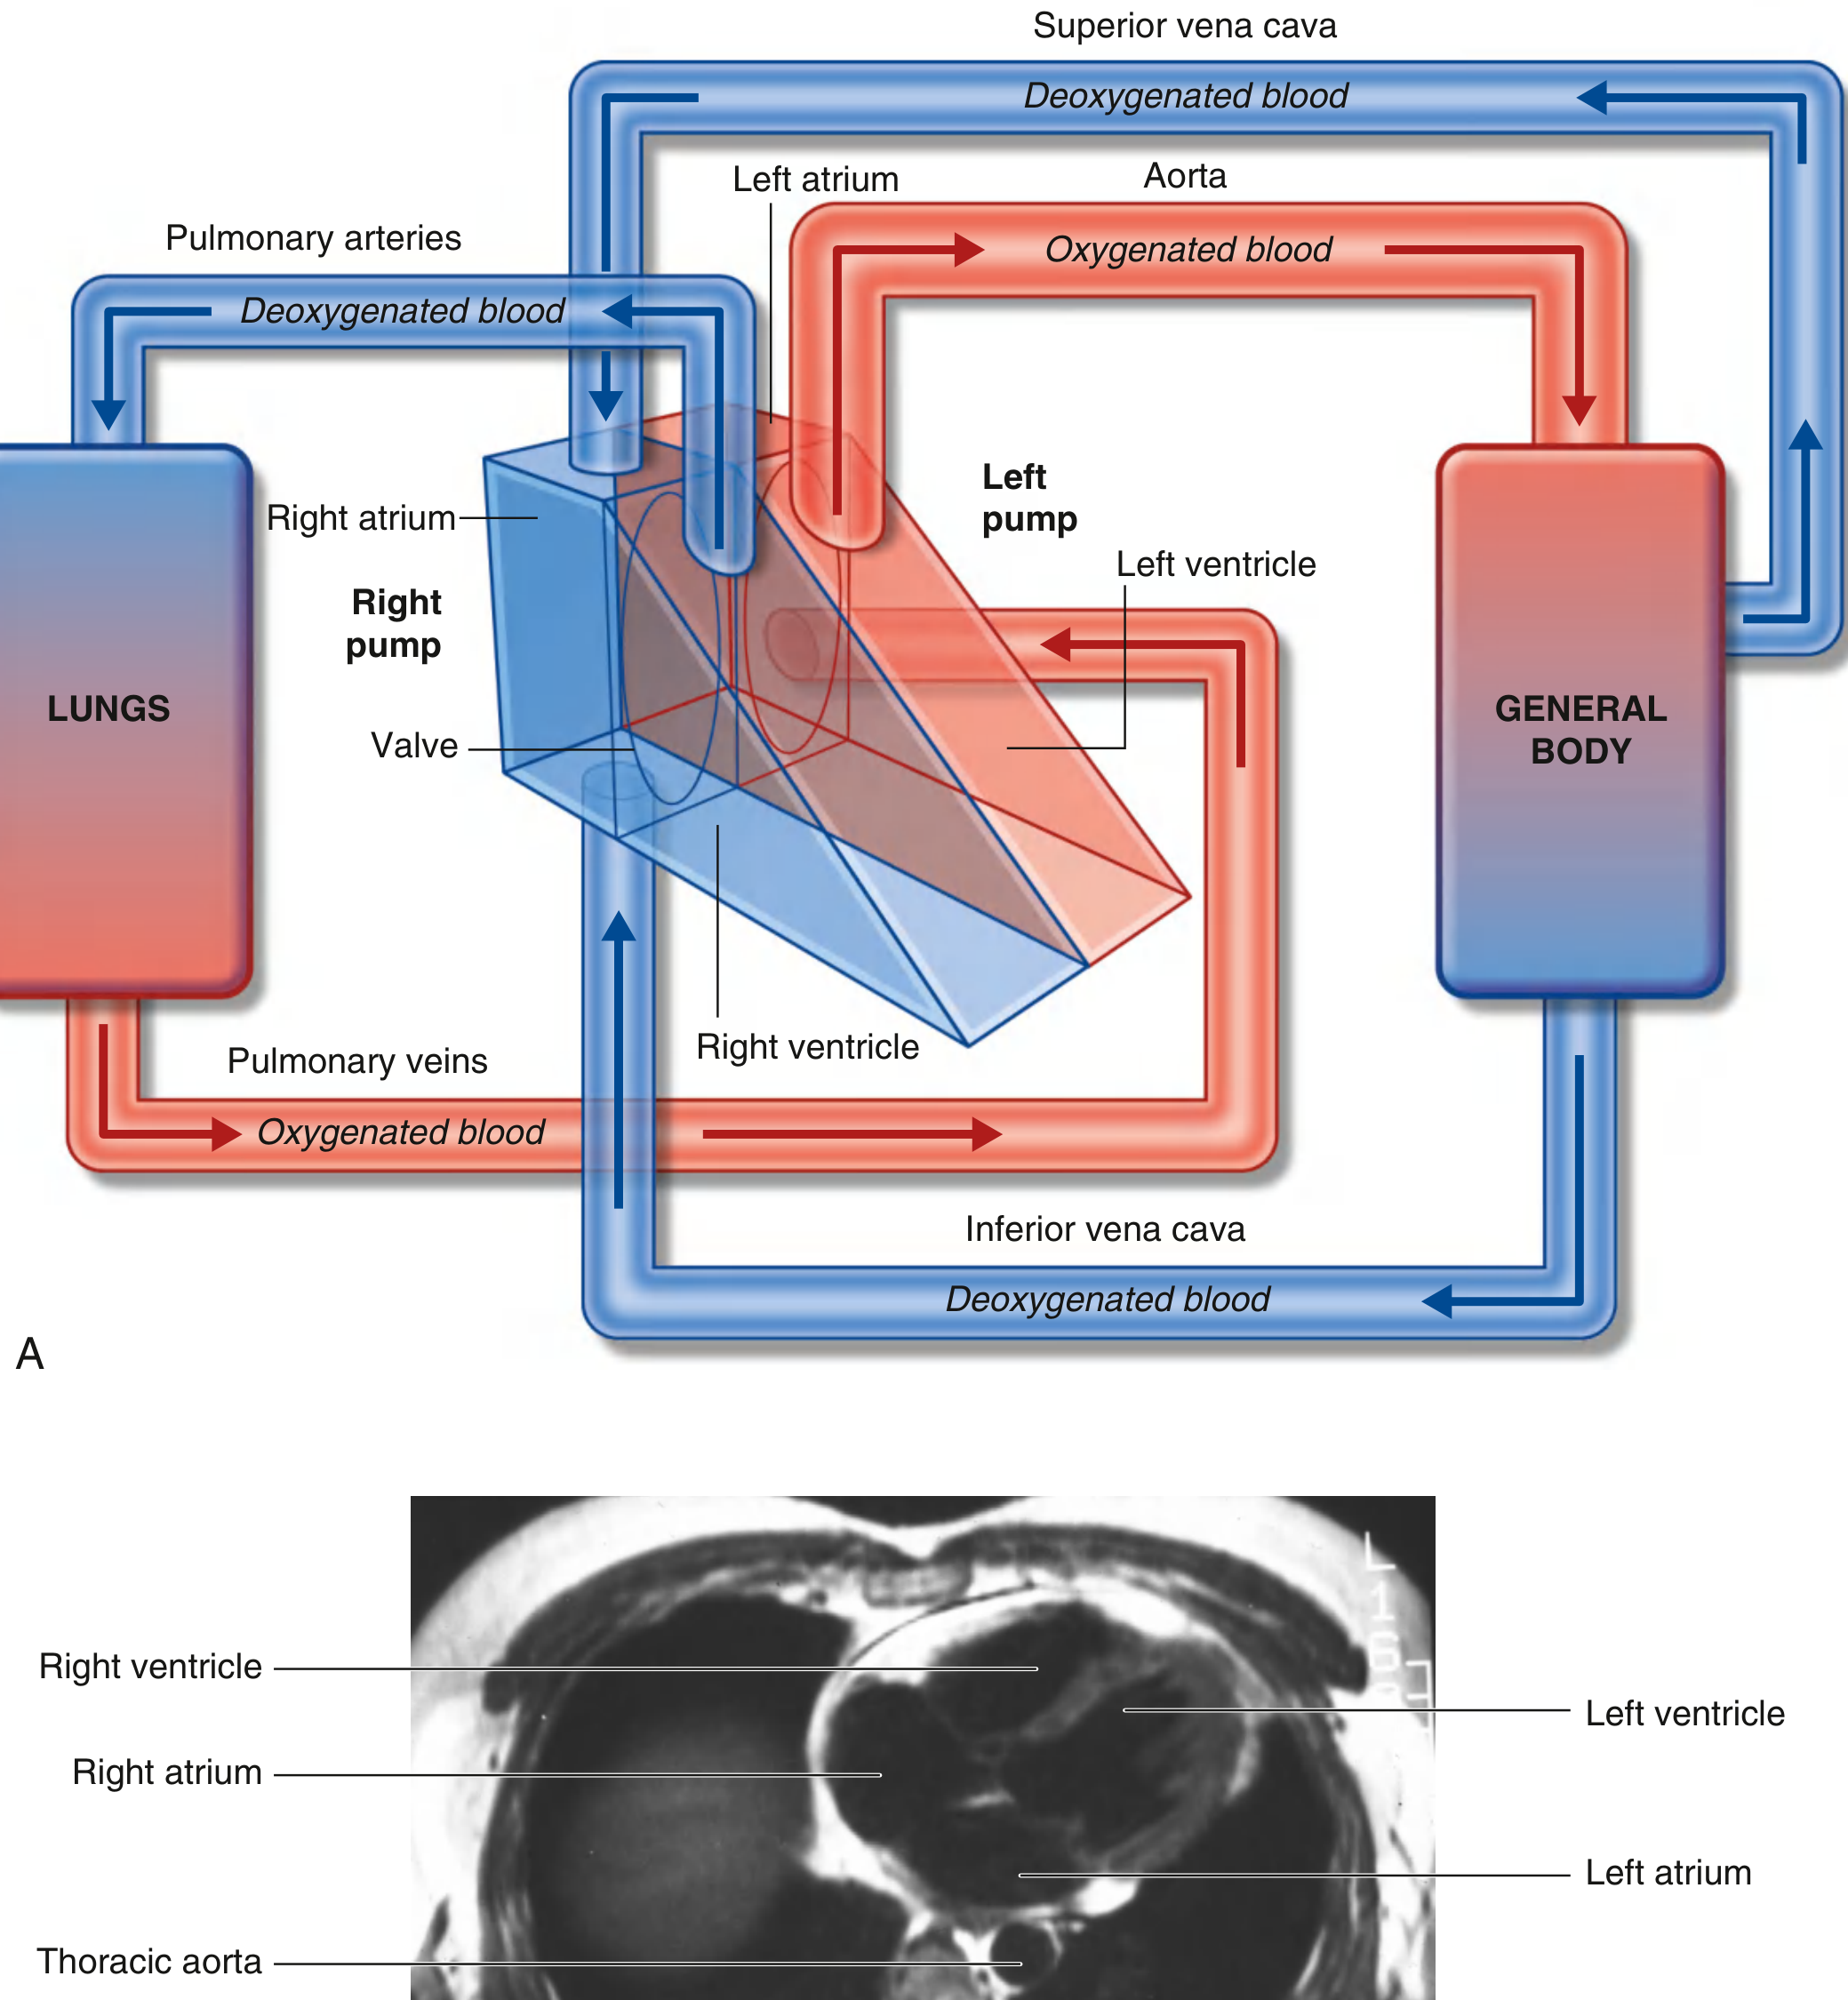
RIGHT PUMP LEFT PUMP
RA → (Tricuspid) → RV LA → (Mitral) → LV
↓ ↓
Pulmonary valve Aortic valve
↓ ↓
Pulmonary trunk Aorta
↓ ↓
LUNGS GENERAL BODY
2. POSITION & ORIENTATION
| Feature | Details |
|---|---|
| Shape | Pyramid resting on one side |
| Apex | Projects forward, downward, LEFT - formed by inferolateral LV |
| Apex location | Left 5th intercostal space, 8-9 cm from midsternal line |
| Base | Faces posteriorly - formed mostly by Left Atrium |
| Axis | Oblique - right to left, posterior to anterior |
Surfaces of the Heart
| Surface | Facing | Formed By |
|---|---|---|
| Anterior (sternocostal) | Anteriorly | Mostly RV + some RA (right) + LV (left) |
| Diaphragmatic (inferior) | Inferiorly (rests on diaphragm) | LV + small part RV |
| Left pulmonary | Left lung | LV + part of LA |
| Right pulmonary | Right lung | RA |
| Base (posterior) | Posteriorly | LA (mostly) + small part RA |
Borders (important for CXR reading)
| Border on CXR (PA view) | Structures |
|---|---|
| Right border | SVC + RA + IVC |
| Left border | Aortic arch + Pulmonary trunk + Left auricle + LV |
| Inferior border | RV + LV (at apex) |
3. THE FOUR CHAMBERS
🔵 RIGHT ATRIUM (RA)
- Forms the right border of the heart
- Receives blood from: SVC (upper body), IVC (lower body), Coronary sinus (heart wall)
- Key internal feature: Crista terminalis - muscular ridge dividing smooth (sinus venarum) from rough (pectinate muscles) portions
- Fossa ovalis - remnant of foramen ovale in interatrial septum (fetal shunt)
- Leads blood → RV through the Tricuspid valve (right AV orifice)
🔵 RIGHT VENTRICLE (RV)
- Wall thickness: 3-5 mm (thin - pumps to low-resistance pulmonary circulation)
- Key features: Trabeculae carneae (irregular muscle bundles), Papillary muscles, Chordae tendineae, Moderator band (septomarginal trabecula - carries part of right bundle branch)
- Outflow tract: Conus arteriosus (infundibulum) → leads to Pulmonary valve → Pulmonary trunk
- Pulmonary valve: 3 semilunar cusps - Left, Right, Anterior
🔴 LEFT ATRIUM (LA)
- Forms most of the base/posterior surface of the heart
- Receives blood from: 4 pulmonary veins (2 right + 2 left - carry oxygenated blood)
- Smooth posterior wall (derived from incorporated pulmonary veins)
- Rough anterior wall with musculi pectinati + left auricle
- Valve of foramen ovale - in interatrial septum (opposite fossa ovalis of RA)
- Leads blood → LV through Mitral valve (left AV orifice)
🔴 LEFT VENTRICLE (LV)
- Wall thickness: 8-12 mm (thicker - pumps against high systemic resistance)
- Forms apex of heart and left/diaphragmatic surface
- Circular cross-section (vs. crescent-shaped RV)
- Features: Trabeculae carneae, 2 papillary muscles (anterior + posterior), Chordae tendineae
- Outflow: Aortic vestibule → Aortic valve → Ascending aorta
4. THE FOUR VALVES
ATRIOVENTRICULAR (AV) VALVES SEMILUNAR VALVES
(prevent backflow during systole) (prevent backflow during diastole)
Tricuspid (Right) Pulmonary (Right)
- 3 cusps: Anterior, Posterior, - 3 semilunar cusps: Left, Right,
Septal Anterior
- Held by chordae tendineae - Pocket-like sinuses fill and close
from 3 papillary muscles valve after systole
Mitral/Bicuspid (Left) Aortic (Left)
- 2 cusps: Anterior (aortic) + - 3 semilunar cusps: Left, Right,
Posterior (mural) Posterior (non-coronary)
- Held by chordae from 2 papillary - Coronary arteries arise from left
muscles (anterior + posterior) and right aortic sinuses
Valve Summary Table
| Valve | Type | Location | Cusps | Function |
|---|---|---|---|---|
| Tricuspid | AV | Right AV orifice | 3 | Prevents RA backflow during RV systole |
| Pulmonary | Semilunar | RV outflow (infundibulum) | 3 | Prevents PA backflow during diastole |
| Mitral (Bicuspid) | AV | Left AV orifice | 2 | Prevents LA backflow during LV systole |
| Aortic | Semilunar | LV outflow (vestibule) | 3 | Prevents aortic backflow during diastole |
Memory trick: "Try Pulling My Aorta" = Tricuspid, Pulmonary, Mitral, Aortic (right to left, inflow to outflow)
5. GREAT VESSELS
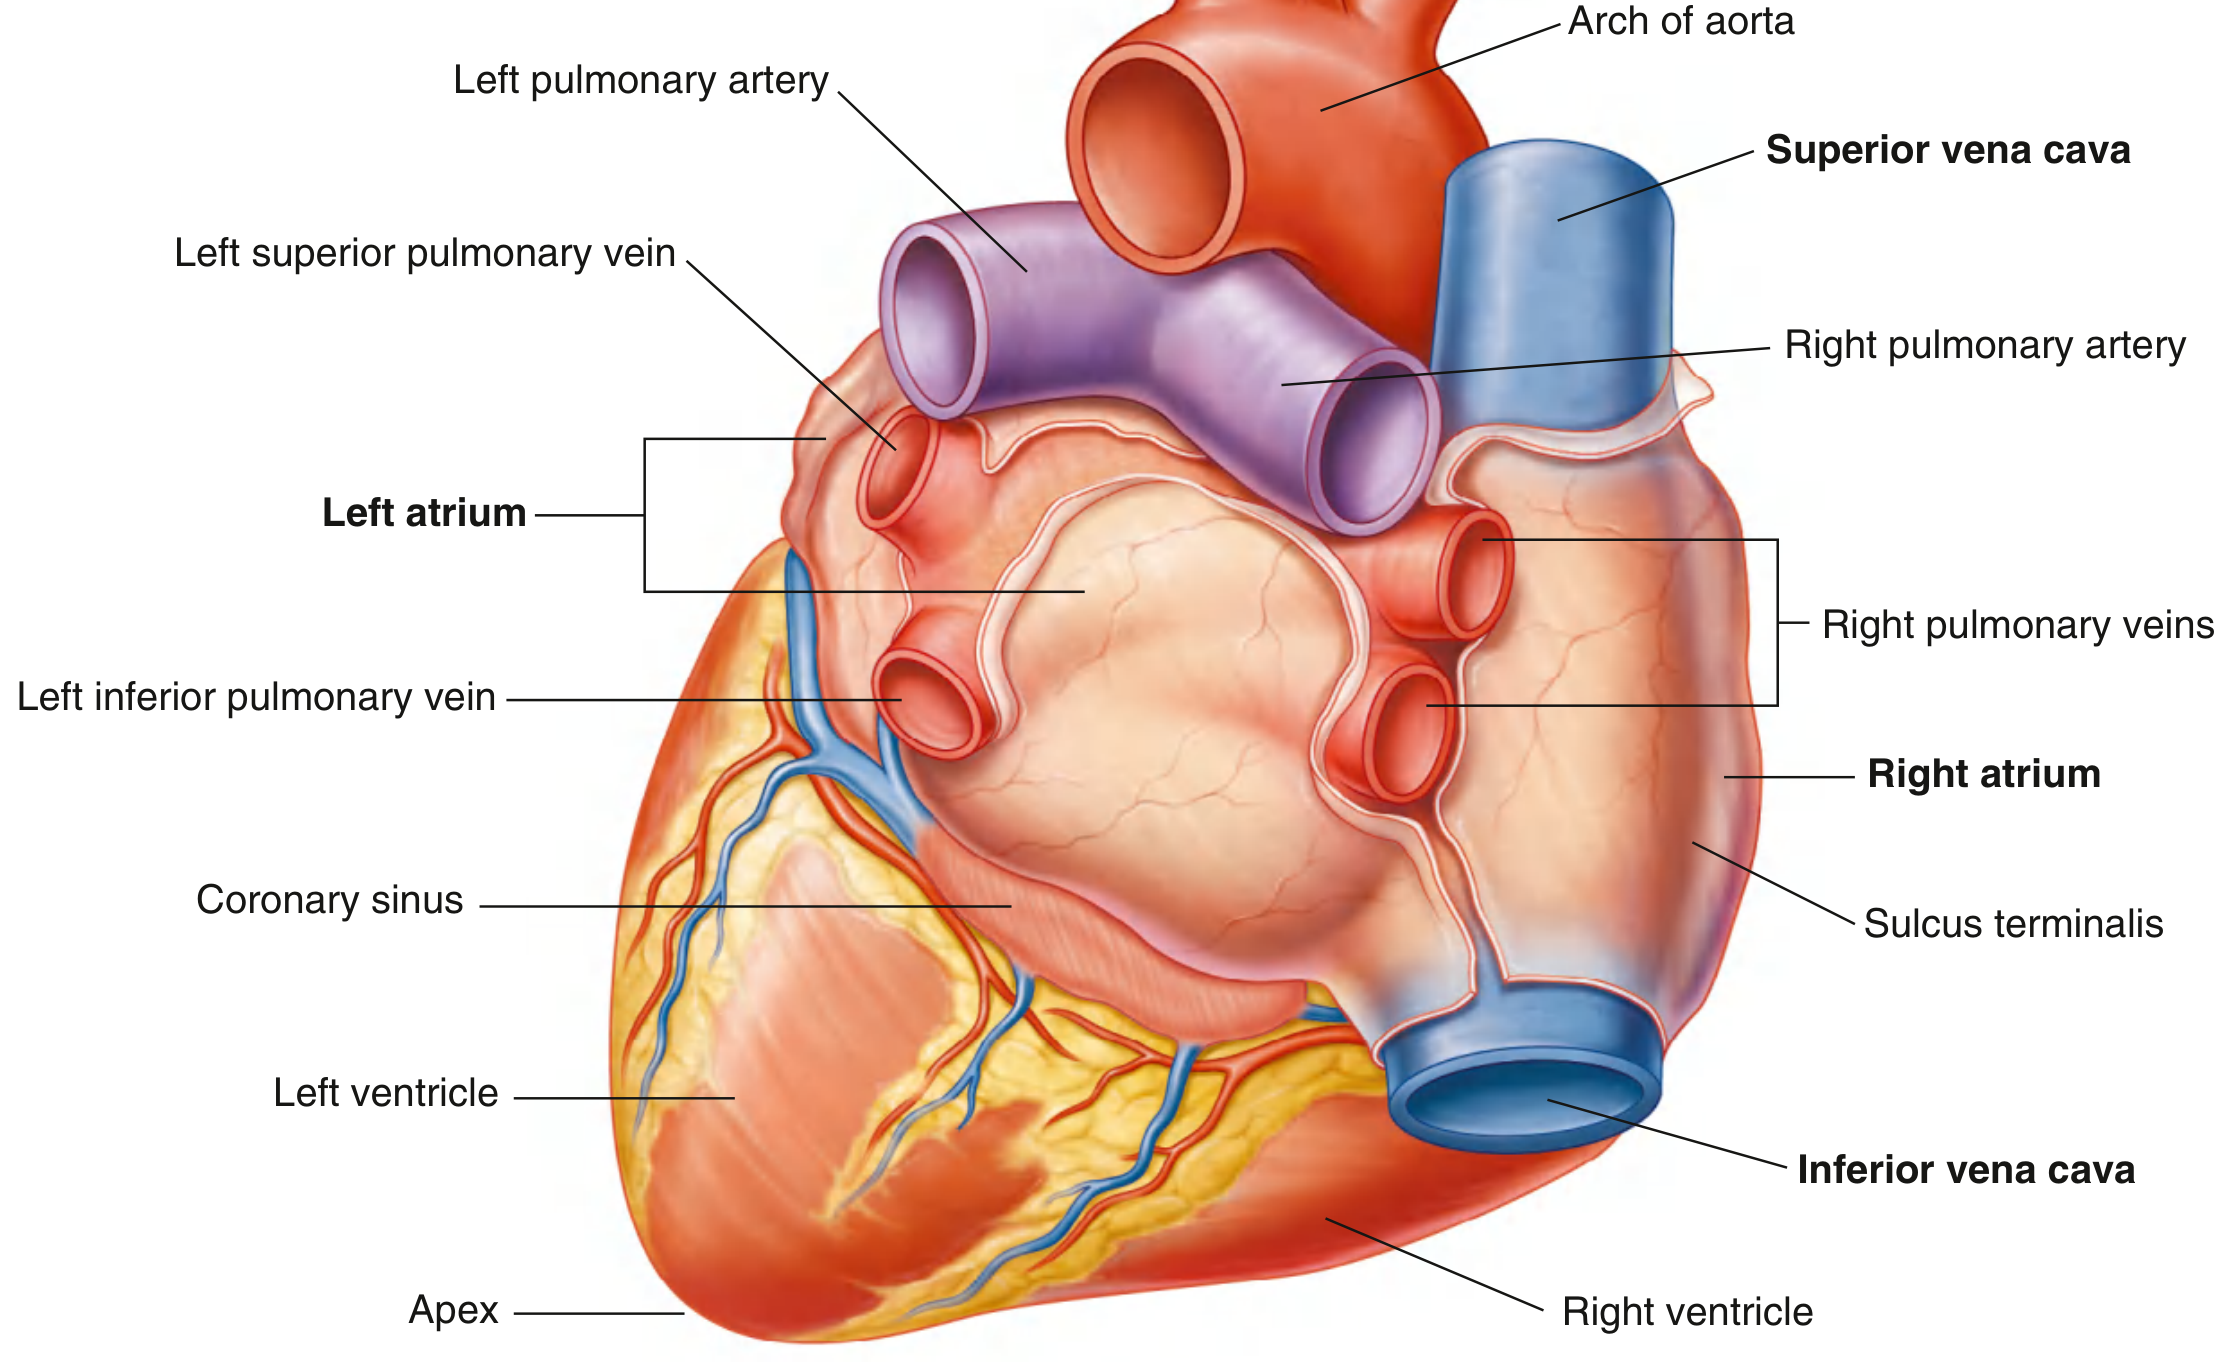
Vessels Entering the Heart (Veins)
| Vessel | Carries | Enters |
|---|---|---|
| Superior Vena Cava (SVC) | Deoxygenated blood from upper body (above diaphragm) | Upper posterior RA |
| Inferior Vena Cava (IVC) | Deoxygenated blood from lower body (below diaphragm) | Lower posterior RA |
| Coronary Sinus | Venous drainage from heart wall | Lower posterior RA |
| 4 Pulmonary Veins (2L + 2R) | Oxygenated blood from lungs | Posterior LA (2 on each side) |
Vessels Leaving the Heart (Arteries)
| Vessel | Carries | Leaves From |
|---|---|---|
| Pulmonary Trunk | Deoxygenated blood to lungs | RV (via pulmonary valve) |
| Ascending Aorta | Oxygenated blood to body | LV (via aortic valve) |
Aorta - Divisions
Ascending Aorta
↓ (gives off Left + Right Coronary Arteries)
Aortic Arch
↓ (gives off Brachiocephalic trunk → Right subclavian + Right common carotid)
↓ (gives off Left Common Carotid)
↓ (gives off Left Subclavian)
Descending Thoracic Aorta
↓ (passes through diaphragm at T12)
Abdominal Aorta
6. PERICARDIUM
PERICARDIUM (fibroserous sac surrounding the heart)
|
|-------- FIBROUS PERICARDIUM (outer layer)
| - Tough, inextensible
| - Attached to: Central tendon of diaphragm (below),
| Sternum (anteriorly), Great vessels (superiorly)
| - Function: Prevents overdistension, anchors heart
|
|-------- SEROUS PERICARDIUM (inner layer)
|
|---- PARIETAL LAYER - lines inner fibrous pericardium
|
|---- VISCERAL LAYER (EPICARDIUM) - covers heart surface
|
|---- PERICARDIAL CAVITY (between parietal + visceral)
- Contains 15-50 mL of serous fluid
- Acts as lubricant reducing friction
Pericardial Sinuses
| Sinus | Location | Clinical Relevance |
|---|---|---|
| Transverse sinus | Between great arteries (front) and great veins (behind) | Surgeons pass ligature around aorta + PA during bypass surgery |
| Oblique sinus | Behind LA, between pulmonary veins | Pericardial effusion collects here (blind pouch) |
Clinical Relevance: Cardiac Tamponade
7. DIAGRAM TO DRAW - 4-Chamber Cross-Section
AORTA PULMONARY TRUNK
| |
============|===============|============
| AORTIC VALVE PULM. VALVE |
| |
SVC ──┤ LEFT ATRIUM │ RIGHT ATRIUM ├── SVC
| (LA) │ (RA) |
| ──────────│────────── |
Pulm. | MITRAL VALVE│ TRICUSPID VALVE |
Veins─┤ │ ├── IVC
(x4) | LEFT VENTRICLE│RIGHT VENTRICLE|
| (LV) │ (RV) |
| THICK WALL │ THIN WALL |
| (8-12mm) │ (3-5mm) |
| │ |
| APEX (formed by LV) |
==========================================
KEY:
LA + LV = Left heart (RED = oxygenated)
RA + RV = Right heart (BLUE = deoxygenated)
│ = Interventricular / Interatrial septum
8. BLOOD FLOW THROUGH THE HEART - MASTER FLOWCHART
BODY (deoxygenated blood)
↓
SVC / IVC / Coronary Sinus
↓
RIGHT ATRIUM (RA)
↓ [Tricuspid Valve OPENS]
RIGHT VENTRICLE (RV)
↓ [Pulmonary Valve OPENS]
PULMONARY TRUNK → Left & Right Pulmonary Arteries
↓
LUNGS (gas exchange: CO₂ out, O₂ in)
↓
4 PULMONARY VEINS (oxygenated blood)
↓
LEFT ATRIUM (LA)
↓ [Mitral Valve OPENS]
LEFT VENTRICLE (LV)
↓ [Aortic Valve OPENS]
AORTA → Systemic Circulation
↓
BODY (oxygen delivered to tissues)
↓ (cycle repeats)
9. KEY FACTS FOR MCQs
| Question Type | Answer |
|---|---|
| Which chamber forms the base of the heart? | Left Atrium |
| Which chamber forms the apex? | Left Ventricle |
| Which valve has only 2 cusps? | Mitral (Bicuspid) valve |
| Which structure is the remnant of the foramen ovale? | Fossa ovalis (in RA) |
| Normal pericardial fluid volume? | 15-50 mL |
| Which surface of the heart faces the diaphragm? | Diaphragmatic (inferior) surface |
| Coronary sinus drains into which chamber? | Right Atrium |
| Pulmonary veins carry which type of blood? | Oxygenated (exception: veins carrying arterial blood) |
| LV wall thickness vs RV? | LV = 8-12 mm; RV = 3-5 mm |
| Which valve lies between LA and LV? | Mitral valve |
| Apex of heart - which intercostal space? | Left 5th intercostal space |
| Moderator band is found in which chamber? | Right Ventricle |
10. SELF-TEST (Do this before Day 2)
- Name the 4 chambers and what vessel enters/exits each
- Draw the 4-chamber cross-section from memory and label all valves
- Trace the path of one red blood cell from the IVC all the way back to the aorta
- What is the difference between fibrous and serous pericardium?
- Which 3 structures form the right border of the heart on CXR?
Hii
Coronary Arteries & Cardiac Conduction System (SA node → AV node → Bundle of His → Purkinje fibres)
- Flowchart of the conduction pathway
- Clinical link: Base for CAD, MI localisation & arrhythmias
Day 2
📘 WEEK 1 - DAY 2
Coronary Arteries & Cardiac Conduction System
Source: Gray's Anatomy for Students | Fuster & Hurst's The Heart, 15th Ed
PART A: CORONARY ARTERIES
1. Overview
- Right Coronary Artery (RCA) - from the right aortic sinus
- Left Coronary Artery (LCA) - from the left aortic sinus
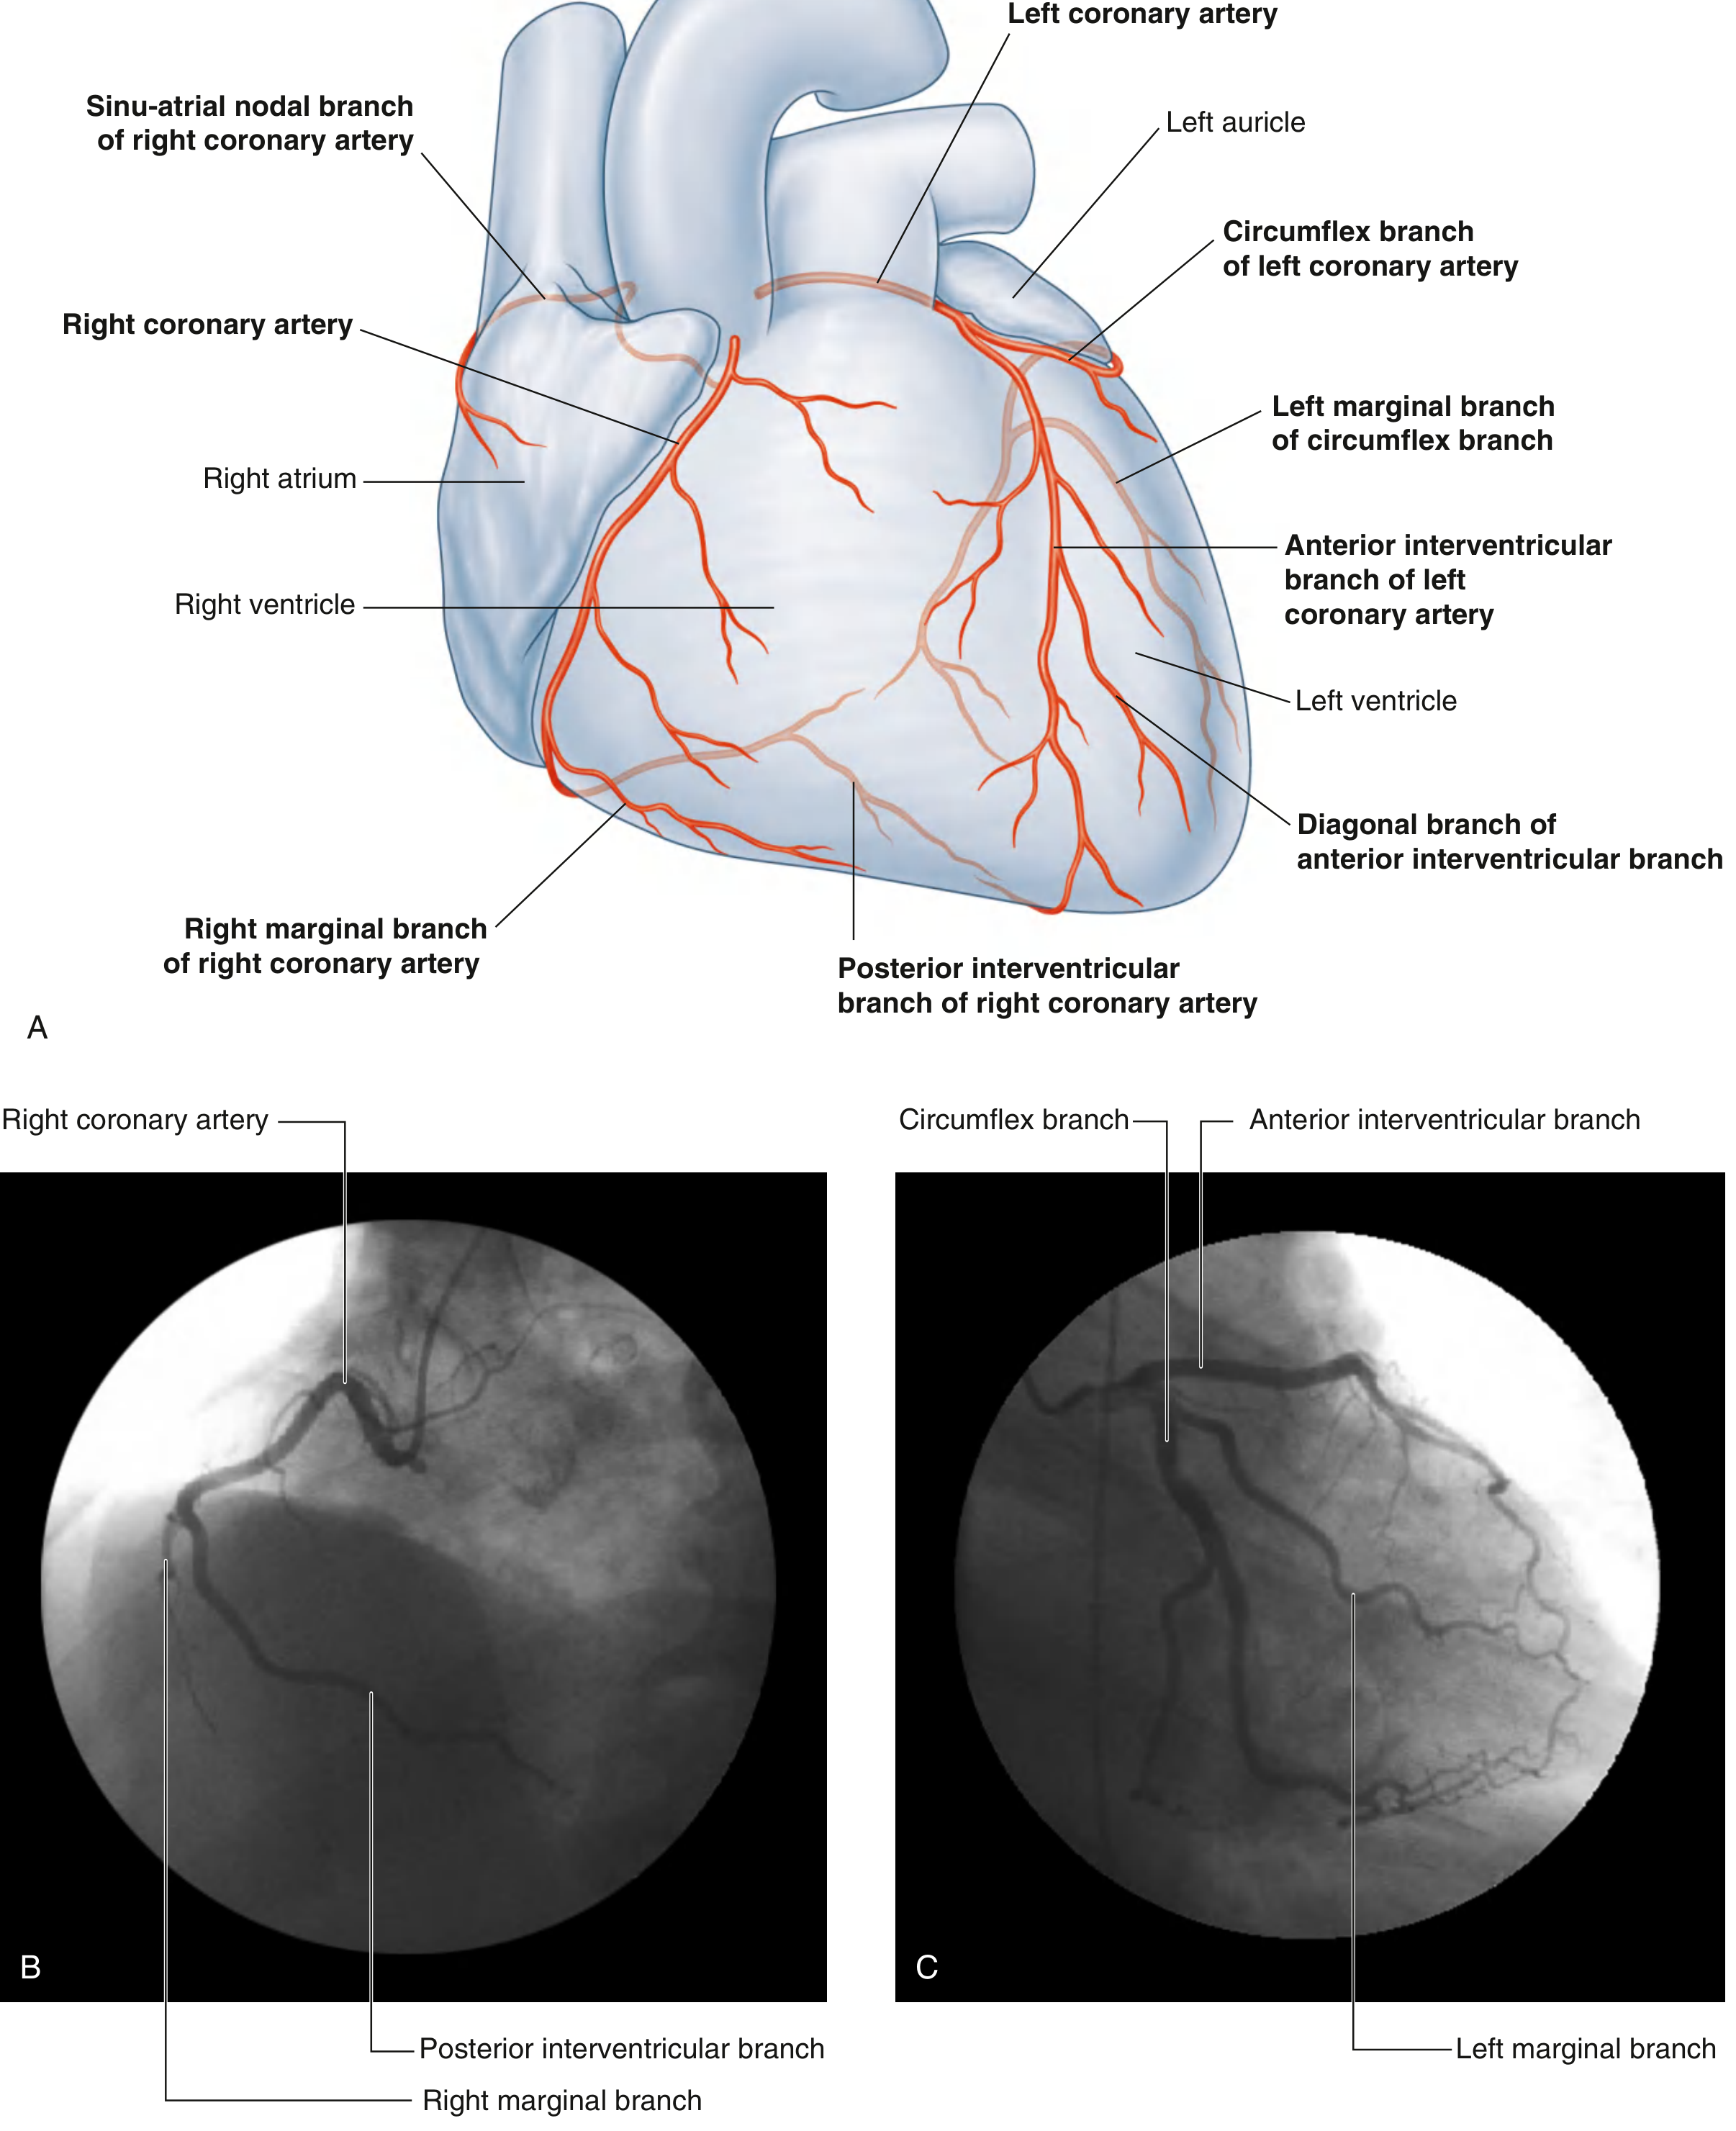
2. Right Coronary Artery (RCA)
| Branch | Supplies |
|---|---|
| SA nodal branch (early atrial branch) | Sinu-atrial (SA) node (in ~60% of people) |
| Right marginal branch | Anterior surface of RV toward apex |
| AV nodal branch | Atrioventricular (AV) node |
| Posterior Interventricular branch (PDA - Posterior Descending Artery) | Posterior IVS, posterior LV wall |
- Right atrium + Right ventricle
- SA node and AV node (in most people)
- Interatrial septum + part of LA
- Posterior 1/3 of interventricular septum
- Posterior part of LV
3. Left Coronary Artery (LCA)
LEFT CORONARY ARTERY (Left Main Stem)
|
_____|_____
| |
LAD LCx
(Anterior (Circumflex
Interventri- branch)
cular)
Branch 1: LAD (Left Anterior Descending) = Anterior Interventricular Artery
- Descends in anterior interventricular sulcus toward apex
- Gives off diagonal branches (cross anterior LV surface)
- Gives off septal perforators (supply anterior 2/3 of IVS)
- Supplies: Anterior LV wall, anterior 2/3 of IVS, apex, Bundle of His, bundle branches
- Called "Widow Maker" - most critical artery; LAD blockage = massive anterior MI
Branch 2: LCx (Circumflex branch)
- Courses left in coronary sulcus around to posterior/diaphragmatic surface
- Gives off Left Marginal Artery (supplies lateral LV wall)
- Supplies: Most of LA, lateral and posterior LV wall
- In ~15% of people (Left Dominant) = gives off PDA instead of RCA
4. Coronary Dominance - Very Exam Important!
| Dominance | Who gives off PDA? | Frequency |
|---|---|---|
| Right Dominant | RCA | ~70% (most common) |
| Co-dominant | Both RCA + LCx | ~15% |
| Left Dominant | LCx | ~15% |
Key point: Dominance is defined by which artery gives off the Posterior Descending Artery (PDA)
5. Coronary Artery → ECG Territory → MI Location
| Artery Blocked | Wall of LV Affected | ECG Leads Showing Changes |
|---|---|---|
| LAD | Anterior | V1, V2, V3, V4 |
| LCx | Lateral | I, aVL, V5, V6 |
| RCA | Inferior | II, III, aVF |
| RCA (proximal) | Inferior + Right Ventricle | II, III, aVF + V3R, V4R |
| LAD (proximal) | Anterior + Septal | V1-V4 + LBBB possible |
You will use this table every single day in the cath lab and when reading ECGs. Memorise it now!
6. Coronary Veins (Blood Returns to RA)
| Vein | Drains | Empties Into |
|---|---|---|
| Great cardiac vein | Anterior surface (alongside LAD) | Coronary sinus |
| Middle cardiac vein | Posterior surface (alongside PDA) | Coronary sinus |
| Small cardiac vein | Right side | Coronary sinus |
| Anterior cardiac veins | RV anterior surface | Directly into RA |
| Coronary Sinus | All the above | Right Atrium |
PART B: CARDIAC CONDUCTION SYSTEM
7. Overview
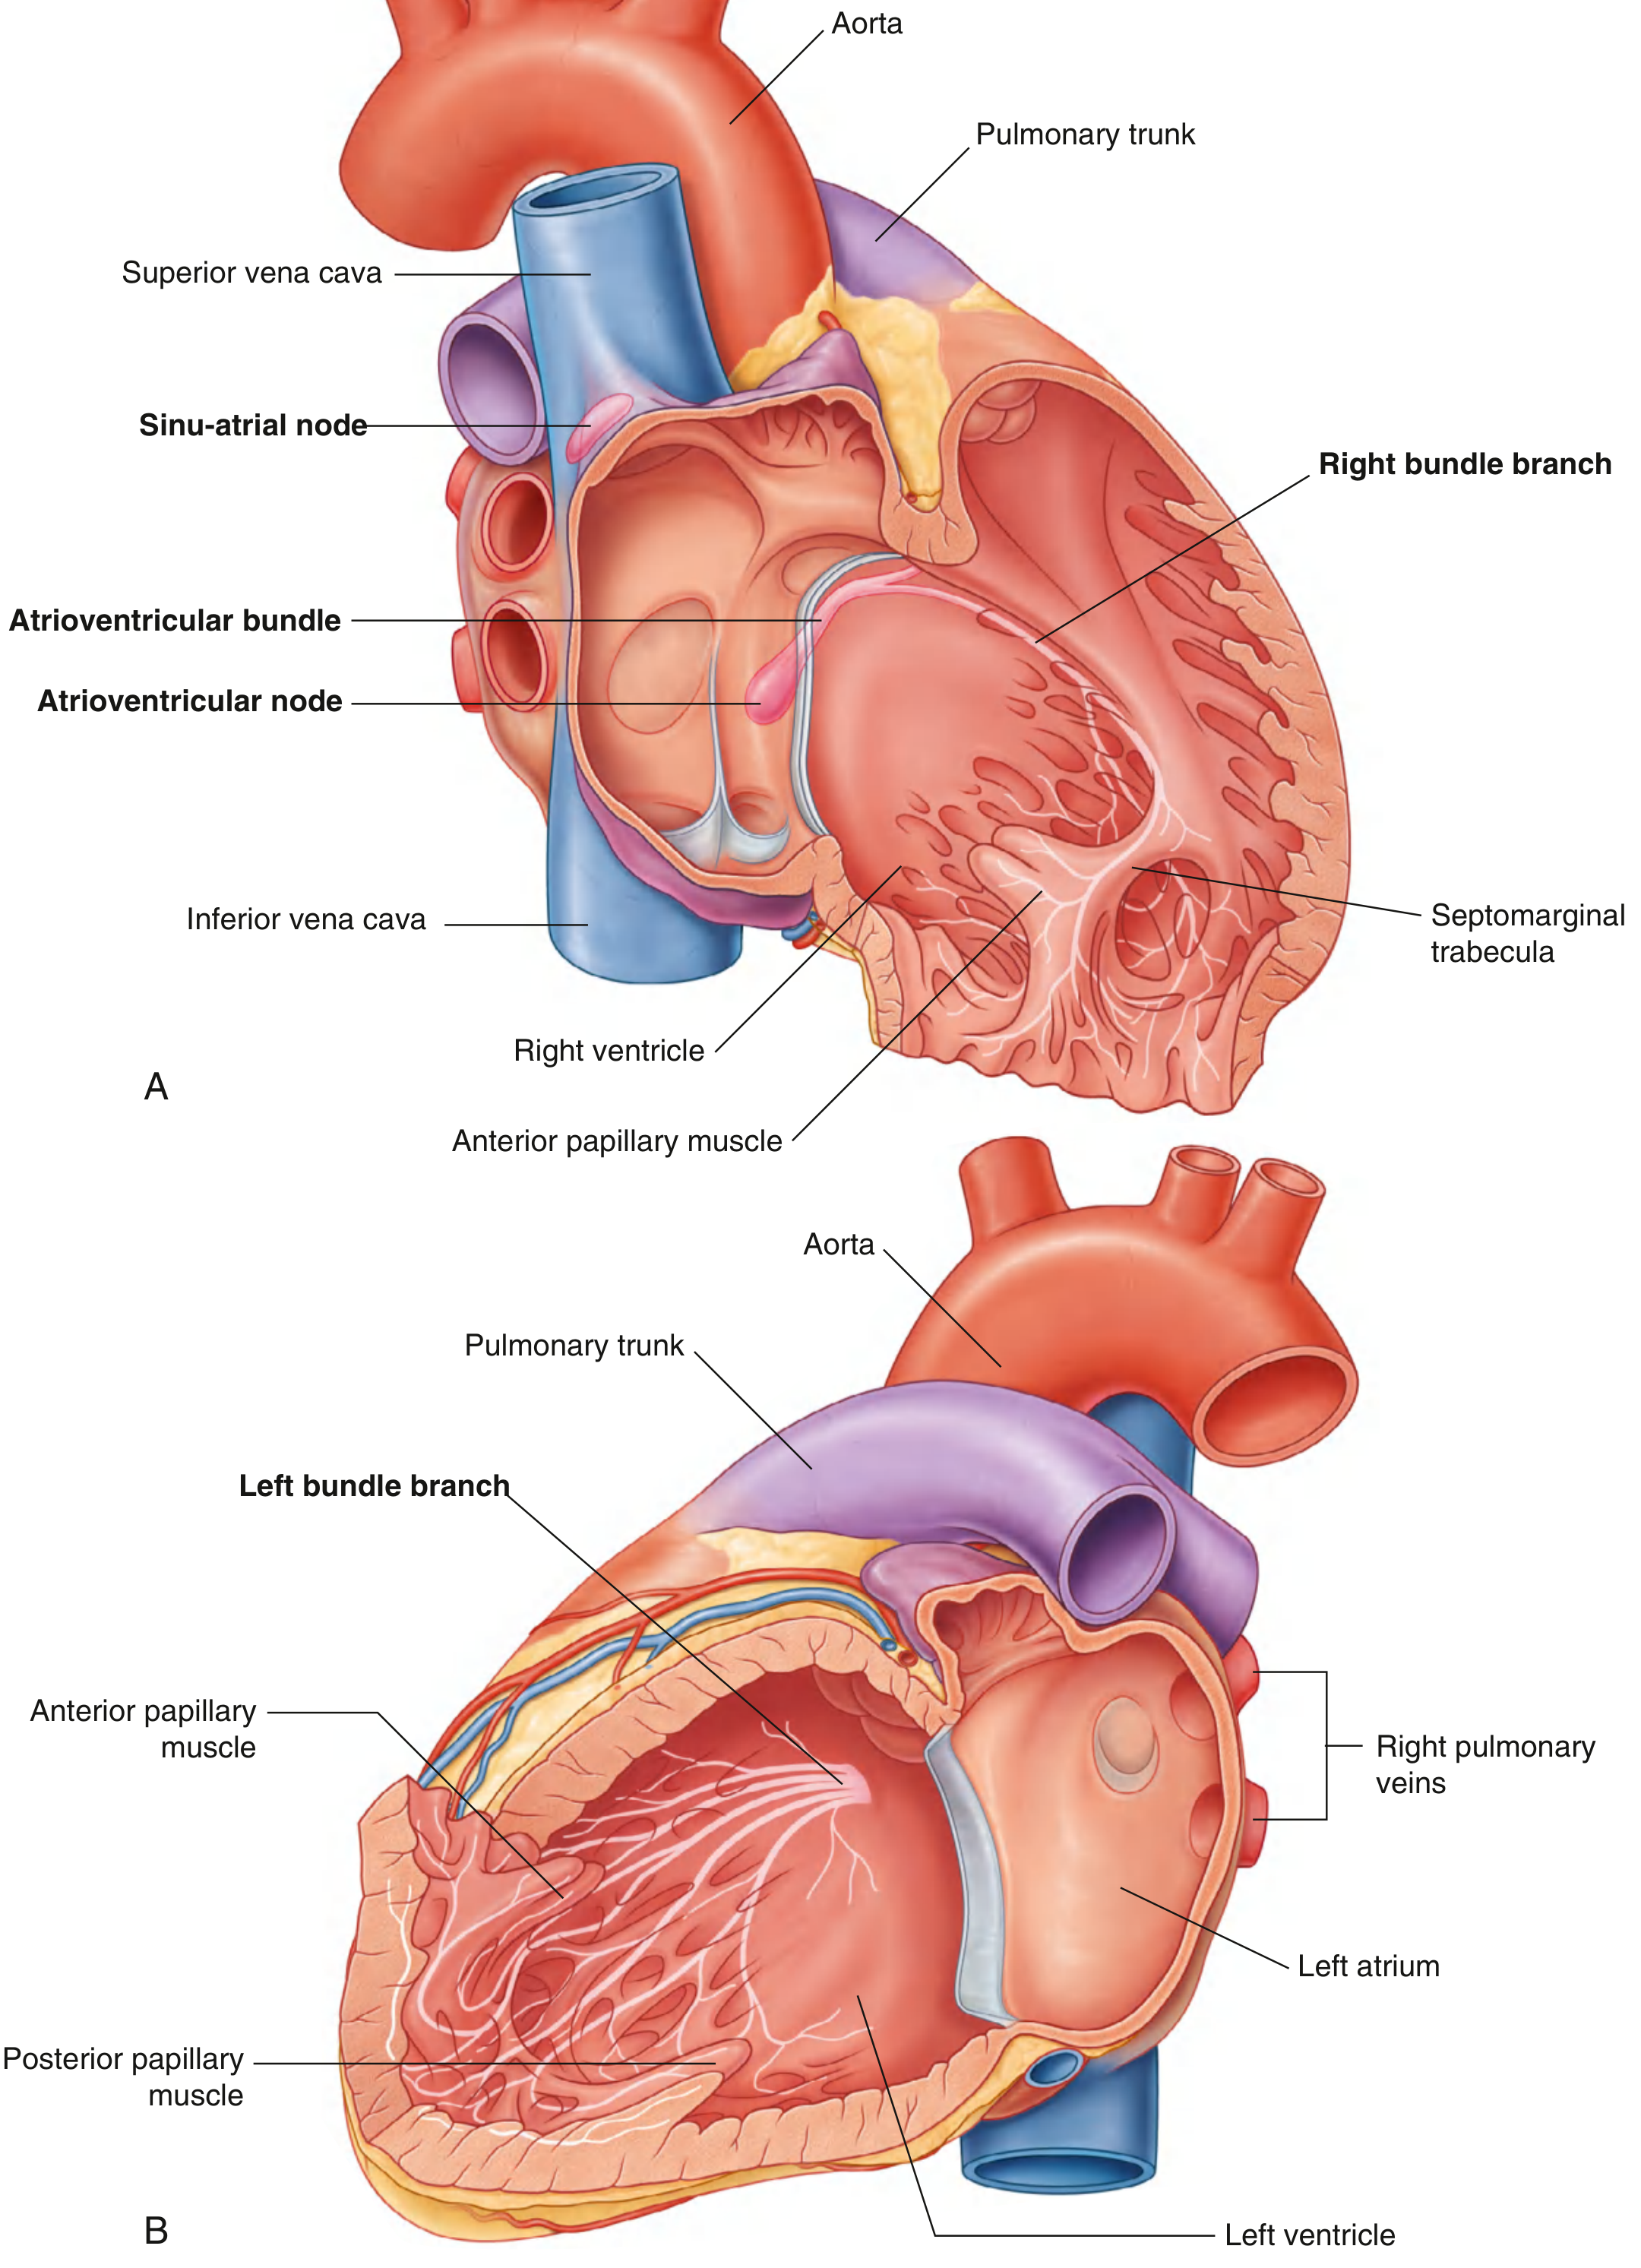
8. Components of the Conduction System
🔵 1. Sinu-Atrial (SA) Node - "The Pacemaker"
- Location: Superior end of crista terminalis, at junction of SVC and RA
- Intrinsic rate: 60-100 beats/min
- Function: Generates the primary electrical impulse → spreads across both atria → causes atrial contraction
- Blood supply: SA nodal branch of RCA (60%) or LCx (40%)
- ECG correlation: Produces the P wave
🔵 2. Atrioventricular (AV) Node - "The Gatekeeper"
- Location: Floor of RA, near opening of coronary sinus, close to septal cusp of tricuspid valve, within AV septum
- Intrinsic rate: 40-60 beats/min (backup pacemaker)
- Function: Receives impulse from SA node → delays it by 0.1 sec → allows atria to finish contracting before ventricles fire
- Blood supply: AV nodal branch of RCA (80%)
- ECG correlation: Produces the PR interval delay
🔵 3. Bundle of His (AV Bundle) - "The Bridge"
- Location: Lower border of membranous IVS → splits into Right and Left bundle branches
- Function: Only electrical connection between atria and ventricles (rest of AV junction is insulated by fibrous skeleton)
- Blood supply: Dual - LAD + RCA
🔵 4. Right Bundle Branch (RBB)
- Course: Down right side of IVS → enters septomarginal trabecula (moderator band) → reaches base of anterior papillary muscle → Purkinje fibres
- Function: Conducts impulse to RV myocardium
- Clinical: Blockage = Right Bundle Branch Block (RBBB) → RSR' pattern in V1
🔵 5. Left Bundle Branch (LBB) → splits into:
- Left Anterior Fascicle (LAF): Supplies anterosuperior LV
- Left Posterior Fascicle (LPF): Supplies posteroinferior LV (thicker, dual blood supply - more resistant to ischemia)
- Clinical: Blockage = Left Bundle Branch Block (LBBB) → broad notched R in V6
🔵 6. Purkinje Fibres - "The Sprinter"
- Location: Subendocardial plexus throughout ventricular walls
- Intrinsic rate: 20-40 beats/min (last resort pacemaker)
- Function: Rapidly conducts impulse to all ventricular myocardium → causes coordinated ventricular contraction from apex upward to outflow tracts
- ECG correlation: Produces QRS complex
9. MASTER CONDUCTION FLOWCHART (Draw This!)
SA NODE (60-100/min) - RIGHT ATRIUM
[Junction of SVC + RA, superior crista terminalis]
|
| Impulse spreads across both atria
| (via internodal pathways + Bachmann's bundle to LA)
↓
ATRIAL CONTRACTION → P wave on ECG
|
↓
AV NODE (40-60/min) - FLOOR OF RA
[Near coronary sinus opening, AV septum]
|
| DELAY = 0.1 second
| (allows atria to finish emptying into ventricles)
↓
PR INTERVAL on ECG (normal 120-200ms)
|
↓
BUNDLE OF HIS (AV Bundle)
[Lower border of membranous IVS]
|
|___________________________
| |
↓ ↓
RIGHT BUNDLE BRANCH LEFT BUNDLE BRANCH
(down right IVS → (splits into)
Moderator band → ├── Left Anterior Fascicle
Ant. papillary muscle) └── Left Posterior Fascicle
| |
↓ ↓
PURKINJE FIBRES (20-40/min) throughout both ventricular walls
|
| Simultaneous activation - apex to base
↓
VENTRICULAR CONTRACTION → QRS complex on ECG (normal <120ms)
|
↓
REPOLARISATION → T wave on ECG
10. Intrinsic Rates - Pacemaker Hierarchy Table
| Structure | Intrinsic Rate | Takes Over When... |
|---|---|---|
| SA Node | 60-100 /min | Normal sinus rhythm |
| AV Node | 40-60 /min | SA node fails (junctional escape rhythm) |
| Bundle of His | 30-40 /min | AV node fails |
| Purkinje / Ventricle | 20-40 /min | All above fail (idioventricular rhythm) |
Rule: The structure with the highest intrinsic rate normally controls the heart. The SA node always wins.
11. Autonomic Control of the Heart
| Sympathetic | Parasympathetic (Vagus) | |
|---|---|---|
| Neurotransmitter | Noradrenaline | Acetylcholine |
| Effect on HR | ↑ (Positive chronotropy) | ↓ (Negative chronotropy) |
| Effect on conduction | ↑ AV node speed | ↓ AV node speed (longer PR) |
| Effect on contractility | ↑ (Positive inotropy) | ↓ (Negative inotropy) |
| Effect on coronary arteries | Dilates | Constricts |
| Receptor | β1 adrenoceptors | M2 muscarinic receptors |
Clinical link: Beta blockers (e.g. metoprolol) block β1 → slow SA node → slow AV node → ↓HR. Used in arrhythmias, hypertension, post-MI.
12. Blood Supply to the Conduction System
| Node/Structure | Primary Blood Supply | Why It Matters |
|---|---|---|
| SA Node | RCA (60%) or LCx (40%) | RCA occlusion → SA node ischemia → Sinus bradycardia / Sick Sinus Syndrome |
| AV Node | RCA (80%) | Inferior MI (RCA) → AV block (prolonged PR, heart block) |
| Bundle of His | Dual: LAD + RCA | Protected by dual supply |
| Right Bundle Branch | LAD (septal perforators) | Anterior MI → RBBB |
| Left Bundle Branch | Dual: LAD + RCA | LBBB = sign of significant disease |
13. KEY FACTS FOR MCQs
| Question | Answer |
|---|---|
| Normal pacemaker of the heart? | SA node |
| Location of SA node? | Junction of SVC and RA (superior crista terminalis) |
| Location of AV node? | Floor of RA, near coronary sinus opening |
| Which is the only electrical connection between atria and ventricles? | Bundle of His |
| Which structure carries RBB to anterior papillary muscle? | Moderator band (septomarginal trabecula) |
| Intrinsic rate of SA node? | 60-100/min |
| Intrinsic rate of AV node? | 40-60/min |
| Intrinsic rate of Purkinje fibres? | 20-40/min |
| Which artery most commonly supplies AV node? | RCA (80%) |
| Which MI commonly causes AV block? | Inferior MI (RCA occlusion) |
| Most dangerous artery to block? | LAD ("Widow Maker") |
| Most common coronary dominance? | Right dominant (~70%) |
| Dominance is defined by which artery gives off? | PDA (Posterior Descending Artery) |
| Coronary arteries fill during? | Diastole |
14. DIAGRAM TO DRAW
AORTA
|
|-------- RCA (Right aortic sinus)
| |-- SA nodal branch
| |-- Right marginal branch
| |-- AV nodal branch
| └-- PDA (Posterior Descending Artery)
|
|-------- LCA (Left aortic sinus)
|
Left Main Stem
|
_____|_____
| |
LAD LCx
| |-- Left marginal branch
|-- Diagonal |-- (PDA in left dominant)
|-- Septal
perforators
15. SELF-TEST (Do Before Day 3)
- Name all branches of the RCA in order
- What is the difference between right dominant and left dominant coronary circulation?
- Trace an electrical impulse from the SA node to the point where the QRS complex is generated
- A patient has an inferior MI (RCA blocked) - which node's blood supply is at risk and what arrhythmia might develop?
- Why do coronary arteries fill during diastole and not systole?
Day 3
📘 WEEK 1 - DAY 3
Cardiac Cycle & Physiology: Systole/Diastole, Heart Sounds, Wiggers Diagram
Source: Guyton & Hall Medical Physiology | Costanzo Physiology 7th Ed | Gray's Anatomy for Students
1. WHAT IS THE CARDIAC CYCLE?
- At heart rate of 72 beats/min → one cardiac cycle = 0.833 seconds
- Systole (contraction) ≈ 0.3 sec
- Diastole (relaxation/filling) ≈ 0.5 sec
Key principle: The atria act as "primer pumps" - they contract just before the ventricles, topping up the ventricle with extra blood (last 20-30% of filling). The ventricles provide the main pumping power.
2. THE 7 PHASES OF THE CARDIAC CYCLE
PHASE A - Atrial Systole
| What happens | Atria contract, actively pushing remaining blood into ventricles (final 20-30% of ventricular filling) |
| ECG event | P wave (atrial depolarisation) |
| Valves | Mitral + Tricuspid = OPEN; Aortic + Pulmonary = CLOSED |
| LV pressure | Slight increase (blip from atrial kick) |
| LV volume | Increases to maximum = End-Diastolic Volume (EDV) = ~120-130 mL |
| Heart sound | S4 (not heard in normal adults; heard in LV hypertrophy - stiff ventricle) |
| Venous pulse | 'a' wave (atrial contraction reflected back) |
PHASE B - Isovolumetric Ventricular Contraction (IVC)
| What happens | Ventricles begin contracting; pressure rises rapidly BUT no blood leaves yet (all valves closed) |
| ECG event | QRS complex (ventricular depolarisation) |
| Valves | ALL VALVES CLOSED (most important phase - brief but critical) |
| LV pressure | Rises sharply |
| LV volume | Constant - "Iso" = same volume |
| Heart sound | S1 ("LUB") - closure of Mitral + Tricuspid valves |
Why isovolumetric? Mitral just closed (LV pressure > LA pressure), but Aortic hasn't opened yet (LV pressure still < Aortic pressure). So no blood moves. Volume stays fixed while pressure builds.
PHASE C - Rapid Ventricular Ejection
| What happens | LV pressure exceeds aortic pressure → Aortic valve OPENS → Blood rapidly ejected (~70% of stroke volume) |
| ECG event | ST segment |
| Valves | Aortic + Pulmonary = OPEN; Mitral + Tricuspid = CLOSED |
| LV pressure | Reaches maximum (peak systolic ~120 mmHg) |
| LV volume | Decreases rapidly |
| Aortic pressure | Rises sharply |
| Heart sound | None |
PHASE D - Reduced Ventricular Ejection
| What happens | Ventricles begin to repolarise; still contracting but weaker; blood still ejected but at slower rate |
| ECG event | T wave (ventricular repolarisation begins) |
| Valves | Aortic + Pulmonary still OPEN |
| LV pressure | Starts to fall |
| LV volume | Continues to decrease - reaches End-Systolic Volume (ESV) = ~50-60 mL |
| Aortic pressure | Begins to fall (blood running off into arteries faster than ejected) |
PHASE E - Isovolumetric Ventricular Relaxation (IVR)
| What happens | Ventricles relax; LV pressure drops below aortic → Aortic valve CLOSES. All valves closed again |
| ECG event | End of T wave |
| Valves | ALL VALVES CLOSED again |
| LV pressure | Falls rapidly |
| LV volume | Constant (no blood entering or leaving) |
| Aortic pressure | Shows dicrotic notch (incisura) = the "blip" when aortic valve closes |
| Heart sound | S2 ("DUB") - closure of Aortic + Pulmonary valves |
Dicrotic notch = small upward deflection on the aortic pressure curve, representing elastic recoil of the aorta when the aortic valve closes. Important landmark in arterial pressure waveform!
PHASE F - Rapid Ventricular Filling
| What happens | LV pressure falls below LA pressure → Mitral valve OPENS → Blood rushes in from atrium passively |
| ECG event | No ECG event (electrical silence - between T and next P) |
| Valves | Mitral + Tricuspid = OPEN; Aortic + Pulmonary = CLOSED |
| LV pressure | Remains low (ventricle is compliant/relaxed) |
| LV volume | Increases rapidly |
| Heart sound | S3 - normal in children; in adults = pathological (sign of volume overload / heart failure) |
PHASE G - Reduced Ventricular Filling (Diastasis)
| What happens | Passive filling continues slowly; pressure gradients equalise between atria and ventricles |
| ECG event | None (waiting for next P wave) |
| Valves | Mitral + Tricuspid still OPEN |
| LV volume | Slowly increases |
| Heart sound | None |
| Ends when | Next P wave fires → Atrial systole (Phase A) of the next cycle begins |
3. THE WIGGERS DIAGRAM - DRAW THIS
TIME → |---DIASTOLE----|--SYS--|--IVR--|-------DIASTOLE--------|
ECG: | P | PR | QRS | ST | T | | P |
PHASES: |--A--|--B----|---C---|--D---|--E--|---F---|-G-|--A--|
Atrial IVC Rapid Slow IVR Rapid Slow Next
Systole Ejec Ejec Fill Fill Cycle
LV 120 | ___peak___
PRESSURE | / \
(mmHg) 80 |___peak__/ Aortic \___dicrotic notch
0 |_____/LA\______________mitral opens_____
LV 130|___EDV
VOLUME | \stroke vol/
(mL) 50|_________\________/ESV____________________
HEART [S4] [S1-LUB] [S2-DUB] [S3]
SOUNDS A B E F
VALVES:
Mitral: OPEN|CLOSED|CLOSED|CLOSED|CLOSED|OPEN|OPEN|OPEN
Aortic: CL | CL | OPEN | OPEN | CL | CL | CL | CL
4. KEY VOLUMES & CALCULATIONS
| Parameter | Definition | Normal Value |
|---|---|---|
| EDV (End-Diastolic Volume) | Volume in LV just before systole begins | 120-130 mL |
| ESV (End-Systolic Volume) | Volume remaining in LV after systole | 50-60 mL |
| Stroke Volume (SV) | EDV - ESV = volume ejected per beat | 70 mL |
| Ejection Fraction (EF) | SV / EDV × 100 | ≥55% (normal) |
| Cardiac Output (CO) | SV × Heart Rate | 4-8 L/min |
| Cardiac Index | CO / Body Surface Area | 2.5-4.0 L/min/m² |
Ejection Fraction Classification (exam high-yield!)
| EF | Diagnosis |
|---|---|
| ≥55% | Normal |
| 40-54% | HFmrEF (mildly reduced) |
| <40% | HFrEF (reduced EF = systolic heart failure) |
| >75% | HFpEF may have preserved or hyperdynamic EF |
5. THE FOUR HEART SOUNDS
| Sound | Called | Cause | When | Normal? | Clinical Significance |
|---|---|---|---|---|---|
| S1 | "LUB" | Closure of Mitral + Tricuspid (AV valves) | Start of systole (Phase B) | ✅ Always | Loud S1 = MS; Soft S1 = MR, LBBB |
| S2 | "DUB" | Closure of Aortic + Pulmonary (Semilunar valves) | End of systole (Phase E) | ✅ Always | Fixed split S2 = ASD; Wide split = RBBB |
| S3 | Ventricular gallop | Rapid ventricular filling; blood hitting walls | Early diastole (Phase F) | ✅ Children only | In adults = Heart failure, MR, TR |
| S4 | Atrial gallop | Stiff ventricle resisting atrial kick | Late diastole (Phase A) | ❌ Never normal | LV hypertrophy, HTN, HOCM, severe AS |
Rhythm of Gallops
Normal: LUB - DUB (S1 - S2)
S3 gallop: LUB - DUB - da (S1 - S2 - S3) → "Kentucky" rhythm
S4 gallop: da - LUB - DUB (S4 - S1 - S2) → "Tennessee" rhythm
6. AUSCULTATION AREAS - WHERE TO LISTEN
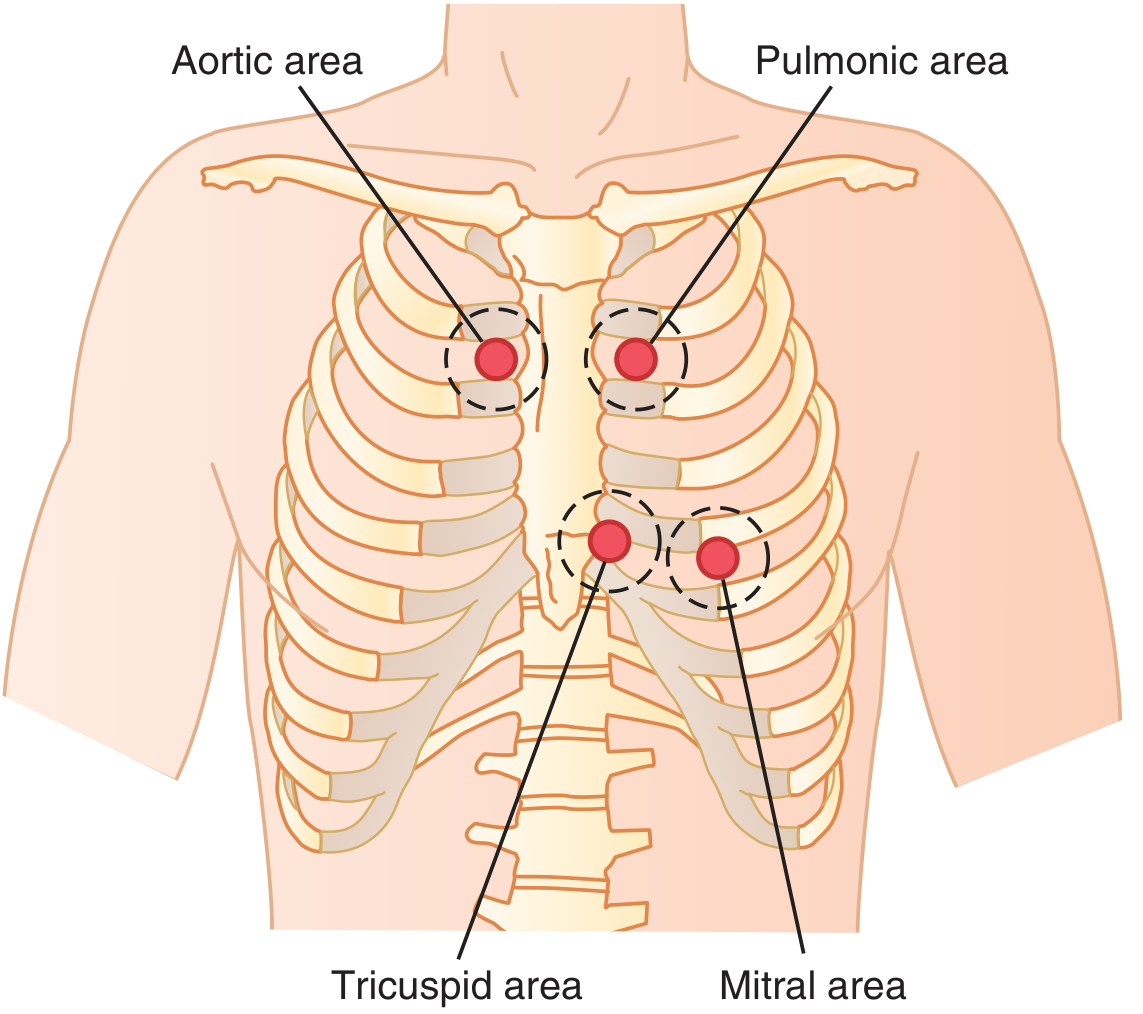
| Valve | Auscultation Area | Location |
|---|---|---|
| Aortic | Right 2nd intercostal space, sternal border | Upper right |
| Pulmonary | Left 2nd intercostal space, sternal border | Upper left |
| Tricuspid | Left lower sternal border (4th-5th ICS) | Lower left |
| Mitral | Apex - Left 5th ICS, midclavicular line | Apex / lower left |
Memory trick: "All Patients Take Medicine" = Aortic, Pulmonary, Tricuspid, Mitral (from right to left, top to bottom)
7. VENOUS PULSE WAVEFORM (JVP)
JVP waveform:
a c x v y
/\/\ \/\/\
| | | |
a wave = atrial contraction (Phase A)
c wave = tricuspid valve bulging back into RA (IVC)
x descent = atrial relaxation
v wave = venous filling of RA (while tricuspid is closed during systole)
y descent = tricuspid opens, RA empties into RV
| JVP Abnormality | Cause |
|---|---|
| Giant 'a' wave | Tricuspid stenosis, Complete heart block |
| Absent 'a' wave | Atrial fibrillation (no organised atrial contraction) |
| Giant 'v' wave | Tricuspid regurgitation |
| Kussmaul's sign (JVP rises on inspiration) | Constrictive pericarditis, RV failure |
8. SPLITTING OF S2
- A2 = Aortic valve closure (comes first, normally)
- P2 = Pulmonary valve closure (comes second, normally)
| Type | When | Cause |
|---|---|---|
| Physiological splitting | Inspiration only | Normal - inspiration → more RV filling → RV takes longer to empty → P2 delayed |
| Wide splitting | Both inspiration + expiration | RBBB, pulmonary hypertension, pulmonary stenosis |
| Fixed splitting | Doesn't change with breathing | ASD (equalised filling of both ventricles) |
| Paradoxical splitting | Expiration only (reversed!) | LBBB, severe AS, HCM |
9. CLINICAL LINKS (Exam + Career)
| Physiology Concept | Clinical Relevance |
|---|---|
| S4 gallop | LV hypertrophy from HTN - target organ damage |
| S3 gallop in adult | Heart failure - important bedside finding |
| Fixed split S2 | Atrial Septal Defect (ASD) |
| Absent 'a' wave in JVP | Atrial fibrillation |
| Dicrotic notch on arterial line | Marks aortic valve closure - seen in ICU monitoring |
| Low EF (<40%) | Systolic HF → needs beta blocker + ACEi + spironolactone |
| Tachycardia shortens diastole more than systole | Heart fills less → risk of inadequate coronary perfusion |
10. MASTER FLOWCHART - CARDIAC CYCLE SUMMARY
P WAVE fires (SA node)
↓
ATRIAL SYSTOLE
Mitral valve OPEN → final filling of LV
LV volume = EDV (120-130 mL)
[S4 if heard]
↓
QRS fires (ventricular depolarisation)
↓
ISOVOLUMETRIC CONTRACTION (IVC)
ALL VALVES CLOSED
LV pressure rises rapidly
[S1 = Mitral + Tricuspid close]
↓
LV pressure > Aortic pressure
↓
AORTIC VALVE OPENS
RAPID EJECTION → peak LV pressure ~120 mmHg
ST segment on ECG
↓
T WAVE (repolarisation begins)
↓
REDUCED EJECTION
LV pressure falls → ESV reached (50-60 mL)
Stroke Volume = EDV - ESV = 70 mL
↓
LV pressure < Aortic pressure
↓
AORTIC VALVE CLOSES
[Dicrotic notch on Aortic pressure trace]
[S2 = Aortic + Pulmonary close]
↓
ISOVOLUMETRIC RELAXATION (IVR)
ALL VALVES CLOSED
LV pressure falls rapidly
↓
LV pressure < LA pressure
↓
MITRAL VALVE OPENS
RAPID FILLING → LV volume rises fast
[S3 if heard]
↓
DIASTASIS (slow filling)
↓
Next P WAVE → cycle repeats
11. KEY FACTS FOR MCQs
| Question | Answer |
|---|---|
| Which phase has ALL valves closed (×2)? | IVC (Phase B) and IVR (Phase E) |
| S1 is caused by closure of which valves? | Mitral + Tricuspid (AV valves) |
| S2 is caused by closure of which valves? | Aortic + Pulmonary (Semilunar valves) |
| S3 in an adult is a sign of? | Heart failure (volume overload) |
| S4 is a sign of? | Stiff (hypertrophied) ventricle |
| Normal ejection fraction? | ≥55% |
| Normal stroke volume? | ~70 mL |
| Normal cardiac output? | 4-8 L/min |
| What is EDV? | Volume in LV just before systole (~120-130 mL) |
| What is ESV? | Volume remaining after systole (~50-60 mL) |
| EF formula? | (SV/EDV) × 100 = (EDV-ESV)/EDV × 100 |
| Dicrotic notch represents? | Closure of the aortic valve |
| Fixed split S2 is diagnostic of? | Atrial Septal Defect (ASD) |
| Absent 'a' wave in JVP means? | Atrial Fibrillation |
| Which phase does S1 occur in? | Beginning of systole (IVC / Phase B) |
| Which phase does S2 occur in? | End of systole (IVR / Phase E) |
12. SELF-TEST (Do Before Day 4)
- List all 7 phases of the cardiac cycle in order with their key valve event
- Draw the Wiggers diagram from memory - mark S1, S2, EDV, ESV, dicrotic notch
- A patient has an S3 gallop at the apex. What does this indicate?
- Why does the aortic valve close before the pulmonary valve?
- Calculate Stroke Volume and EF if EDV = 150 mL and ESV = 75 mL
- What is "physiological splitting" of S2 and when does it occur?
Day 4
📘 WEEK 1 - DAY 4
Hemodynamics: Preload, Afterload, Contractility, Frank-Starling Law & Cardiac Output
Source: Morgan & Mikhail's Clinical Anesthesiology 7th Ed | Harrison's Principles of Internal Medicine 22E | Guyton & Hall Medical Physiology
1. THE BIG PICTURE
STROKE VOLUME
|
|________ 1. PRELOAD (how full the heart is BEFORE it squeezes)
|
|________ 2. AFTERLOAD (how hard the heart must squeeze AGAINST)
|
|________ 3. CONTRACTILITY (how powerfully the heart squeezes)
2. PRELOAD
Definition
Preload = the stretch on the ventricular muscle fibres JUST BEFORE contraction = End-Diastolic Volume (EDV)
- It is the "fill" - how much blood is in the ventricle at the end of diastole
- Clinically measured as Left Ventricular End-Diastolic Pressure (LVEDP) or PCWP (Pulmonary Capillary Wedge Pressure)
What Increases Preload?
| Factor | How it raises preload |
|---|---|
| ↑ Blood volume (e.g., IV fluids, transfusion) | More blood returns to heart |
| Bradycardia (slow HR) | More time to fill in diastole |
| Venoconstriction | Squeezes blood from veins → RA |
| Lying flat (recumbent) | More venous return from legs |
| Atrial contraction (S4 at end) | Adds final 20-30% to EDV |
What Decreases Preload?
| Factor | How it lowers preload |
|---|---|
| Haemorrhage / dehydration | Less blood volume |
| Diuretics (Furosemide) | Reduce blood volume |
| Nitrates (GTN) | Vasodilate veins → blood pools in periphery → less returns |
| Tachycardia | Less time to fill in diastole |
| Cardiac tamponade | External compression prevents filling |
| PEEP ventilation | Raised intrathoracic pressure ↓ venous return |
3. AFTERLOAD
Definition
Afterload = the resistance the ventricle must overcome to EJECT blood = the "load" it faces AFTER it starts contracting
- For the LV: afterload ≈ Systemic Vascular Resistance (SVR) = aortic pressure / peripheral resistance
- For the RV: afterload ≈ Pulmonary Vascular Resistance (PVR)
- Clinically estimated by aortic pressure (blood pressure)
Key Rule:
↑ Afterload → ↓ Stroke Volume (heart works harder but ejects less)
↓ Afterload → ↑ Stroke Volume (heart ejects more easily)
What Increases Afterload?
| Factor | Example |
|---|---|
| Hypertension | Systemic HTN → LV afterload ↑ |
| Aortic stenosis | LV must generate huge pressure to open stenotic valve |
| Vasoconstriction (vasopressors) | Noradrenaline, phenylephrine |
| Pulmonary hypertension | RV afterload ↑ |
What Decreases Afterload?
| Factor | Drug example |
|---|---|
| Vasodilators | ACE inhibitors, ARBs, hydralazine, nitroprusside |
| Calcium channel blockers | Amlodipine, nifedipine |
| IABP (Intra-Aortic Balloon Pump) | Deflates before systole → ↓ LV afterload |
Clinical link: In heart failure, the heart is already struggling. If afterload is also high (e.g., untreated HTN), stroke volume drops further. That's why ACE inhibitors and ARBs (afterload reducers) are key drugs in heart failure!
4. CONTRACTILITY (Inotropy)
Definition
Contractility = the INTRINSIC ability of the heart muscle to generate force, INDEPENDENT of preload and afterload
- Also called inotropic state
- Reflects the strength of the actin-myosin cross-bridge interaction
- At the cellular level: depends on intracellular Ca²⁺ concentration during systole
What Increases Contractility?
| Factor | Mechanism |
|---|---|
| Sympathetic stimulation (Adrenaline, Noradrenaline) | β1 receptor → ↑ cAMP → ↑ Ca²⁺ influx |
| Digoxin | Inhibits Na/K ATPase → ↑ intracellular Ca²⁺ |
| Dobutamine / Dopamine | β1 agonists → ↑ cAMP |
| Milrinone | PDE inhibitor → ↑ cAMP |
| Tachycardia (Bowditch effect) | More beats → more Ca²⁺ loading |
| Increased preload (up to a point) | Frank-Starling effect |
What Decreases Contractility (Negative Inotropes)?
| Factor | Mechanism |
|---|---|
| Beta blockers (metoprolol, bisoprolol) | Block β1 → ↓ cAMP → ↓ Ca²⁺ |
| Calcium channel blockers (verapamil, diltiazem) | Block Ca²⁺ entry |
| Heart failure | Loss of myocytes, remodeling |
| Myocardial ischemia / MI | Dead muscle can't contract |
| Acidosis / Hypoxia | Impairs enzyme function |
| Volatile anaesthetic agents | Direct myocardial depression |
5. FRANK-STARLING LAW OF THE HEART
The Law (in plain English):
"The more the heart is filled (stretched), the harder it contracts and the more it ejects"
- Within physiological limits, ↑ EDV → ↑ Stroke Volume
The Cellular Mechanism:
- Increased stretch → sarcomere length increases toward optimal ~2.2 μm
- At this length: maximum actin-myosin overlap = maximum force generation
- Also: increased stretch → increased sensitivity of troponin C for Ca²⁺
- Beyond 2.2 μm: over-stretching → filaments lose overlap → force decreases
SARCOMERE STRETCH (↑ Preload)
↓
Optimal actin-myosin overlap at ~2.2 μm
↓
Maximum Ca²⁺-troponin C sensitivity
↓
Stronger cross-bridge formation
↓
↑ Force of contraction → ↑ Stroke Volume
Frank-Starling Curve:
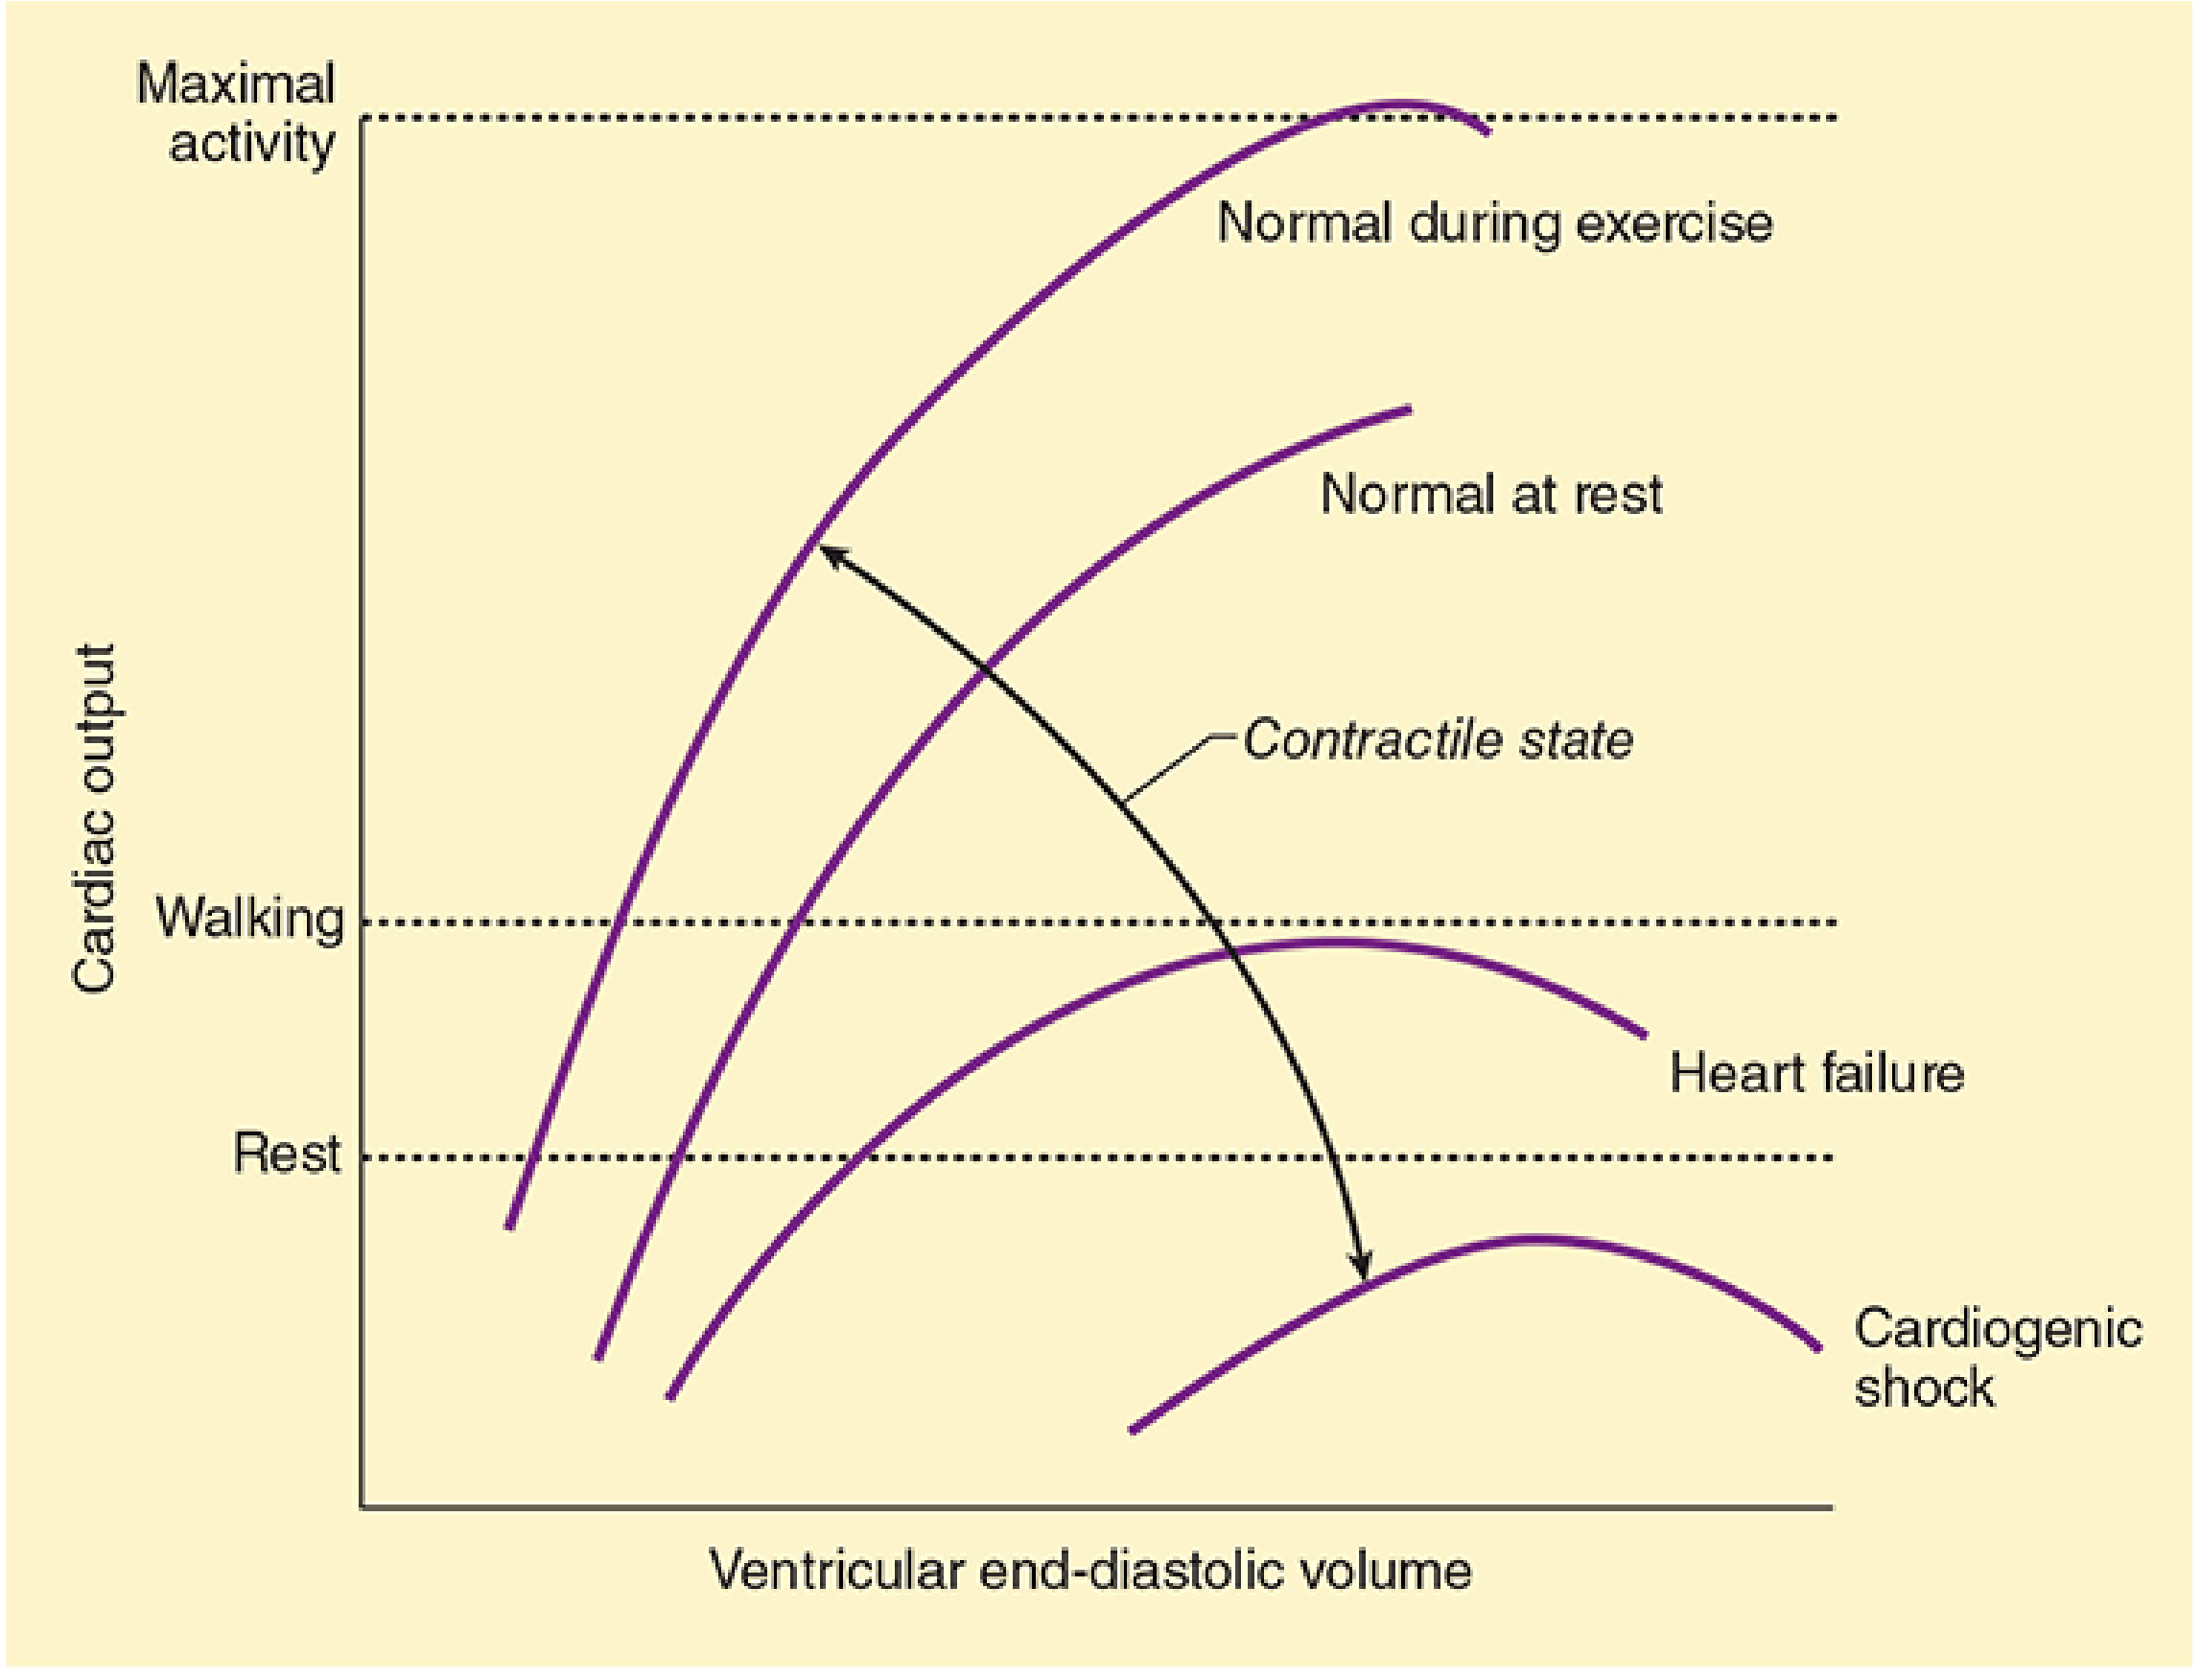
Reading the Frank-Starling Curve:
| Curve Position | State | Meaning |
|---|---|---|
| Upper left curve | Normal during exercise | High contractility - same EDV produces more output |
| Middle curve | Normal at rest | Baseline cardiac function |
| Lower curve | Heart failure | Reduced contractility - needs higher EDV to produce same output |
| Lowest curve | Cardiogenic shock | Severely impaired - curve flattened |
Key Points About the Curve:
MOVING ALONG THE CURVE (same curve, different position):
→ Changing Preload (EDV changes) → changes position ON the curve
→ Example: Giving IV fluids → ↑ EDV → moves RIGHT on same curve → ↑ CO
SHIFTING THE CURVE (entire curve moves up or down):
→ Changing Contractility → SHIFTS the whole curve
→ Positive inotropy (dobutamine) → curve shifts UP/LEFT
→ Negative inotropy (heart failure) → curve shifts DOWN/RIGHT
6. CARDIAC OUTPUT
Formula & Normal Values:
CARDIAC OUTPUT (CO) = Heart Rate (HR) × Stroke Volume (SV)
Normal CO = 70 beats/min × 70 mL/beat = ~4,900 mL/min ≈ 5 L/min
Normal range = 4-8 L/min
CARDIAC INDEX (CI) = CO ÷ Body Surface Area (BSA)
Normal CI = 2.5 - 4.0 L/min/m²
Fick Principle (for measuring CO):
CO = O₂ consumption (VO₂)
─────────────────────────────────────────
Arteriovenous O₂ difference (CaO₂ - CvO₂)
Normal VO₂ ≈ 250 mL/min
Normal (CaO₂ - CvO₂) ≈ 50 mL/L
So CO = 250/50 = 5 L/min ✓
7. MASTER FLOWCHART: PRELOAD → AFTERLOAD → CONTRACTILITY → CO
VENOUS RETURN (blood flowing back to heart)
↓
PRELOAD = EDV (how full the ventricle is at end-diastole)
↓
FRANK-STARLING (more stretch = more force)
↓
CONTRACTILITY (intrinsic muscle strength)
↓
STROKE VOLUME = EDV - ESV
↓
÷ Afterload (SVR)
(↑ afterload resists ejection → ↓ SV)
↓
STROKE VOLUME × HEART RATE
↓
CARDIAC OUTPUT (L/min)
↓
× Peripheral Vascular Resistance
↓
MEAN ARTERIAL PRESSURE (MAP)
8. PRESSURE-VOLUME (P-V) LOOP
LV 120| C (peak systole)
PRESSURE | /|
(mmHg) 80 | B------/ |
| | | D
40 | | \__|
| | E---F /
0 | A________/
|__________________________
50 70 130
LV VOLUME (mL)
ESV SV EDV
A = Mitral opens → diastolic filling (bottom flat line)
B = Mitral closes → IVC begins (LV pressure rises at constant volume)
C = Aortic opens → ejection (pressure rises, volume falls)
D = Aortic closes → IVR begins (pressure falls at constant volume)
How P-V Loop Changes:
| Change | Effect on P-V Loop |
|---|---|
| ↑ Preload (↑ EDV) | Loop widens to the RIGHT → bigger SV |
| ↑ Afterload (↑ SVR) | Loop gets TALLER and NARROWER → smaller SV |
| ↑ Contractility | Loop shifts LEFT → smaller ESV → bigger SV |
| Heart failure ↓ contractility | Loop shifts RIGHT → larger ESV → smaller SV |
9. PHARMACOLOGY LINK (Foundation for Anti-Failure Drugs)
| Drug | Acts On | Effect | Why Used in HF |
|---|---|---|---|
| Furosemide (loop diuretic) | ↓ Preload | Reduces blood volume → ↓ EDV → ↓ filling pressures | Relieves pulmonary congestion |
| Nitrates (GTN, ISDN) | ↓ Preload | Venodilate → blood pools in veins → ↓ venous return | Relieves pulmonary oedema, angina |
| ACE inhibitors (Ramipril) | ↓ Afterload | Dilate arteries → ↓ SVR → LV ejects more easily | ↑ SV, ↓ LV remodelling |
| ARBs (Losartan) | ↓ Afterload | Same as ACEi | ACEi intolerant patients |
| Dobutamine | ↑ Contractility | β1 agonist → ↑ cAMP → ↑ Ca²⁺ → stronger contraction | Acute decompensated HF |
| Digoxin | ↑ Contractility | ↑ Intracellular Ca²⁺ | Chronic HFrEF + AF rate control |
| Beta blockers (Carvedilol) | ↓ HR + remodelling | ↓ Sympathetic overdrive → ↓ remodelling (long-term benefit) | Chronic HF mortality ↓ |
10. KEY FORMULAS SUMMARY TABLE
| Formula | Normal Value |
|---|---|
| CO = HR × SV | 4-8 L/min |
| CI = CO / BSA | 2.5-4.0 L/min/m² |
| SV = EDV - ESV | ~70 mL |
| EF = (SV/EDV) × 100 | ≥55% |
| MAP = DBP + 1/3 (SBP - DBP) | 70-100 mmHg |
| SVR = (MAP - CVP) / CO × 80 | 800-1200 dynes·sec/cm⁵ |
| PVR = (MPAP - PCWP) / CO × 80 | 20-120 dynes·sec/cm⁵ |
11. KEY FACTS FOR MCQs
| Question | Answer |
|---|---|
| Preload is measured clinically by? | LVEDP or PCWP |
| What is the optimal sarcomere length for max contraction? | ~2.2 μm |
| Frank-Starling law: ↑ EDV leads to? | ↑ Stroke volume (up to a limit) |
| Moving ALONG the Frank-Starling curve means? | Change in preload |
| SHIFTING the Frank-Starling curve means? | Change in contractility |
| Drug that reduces preload? | Furosemide, Nitrates |
| Drug that reduces afterload? | ACE inhibitors, ARBs, Hydralazine |
| Drug that increases contractility? | Dobutamine, Digoxin, Adrenaline |
| Afterload for LV is clinically estimated by? | Systemic Vascular Resistance (SVR) |
| Afterload for RV is? | Pulmonary Vascular Resistance (PVR) |
| Normal cardiac output at rest? | 4-8 L/min |
| Normal cardiac index? | 2.5-4.0 L/min/m² |
| Fick principle measures? | Cardiac output |
| In heart failure: Frank-Starling curve shifts? | Downward and to the right |
| Dobutamine shifts Frank-Starling curve? | Upward and to the left |
12. SELF-TEST (Do Before Day 5)
- Define preload, afterload, and contractility in ONE sentence each
- Draw the Frank-Starling curve. Show how it shifts in heart failure vs. with dobutamine
- A patient with acute MI has low BP and low cardiac output. Which part of the Frank-Starling mechanism is failing?
- Why does giving a diuretic help a heart failure patient breathe better? (Use the preload concept)
- Calculate MAP if SBP = 120 mmHg and DBP = 80 mmHg
- Draw a P-V loop and label: EDV, ESV, SV, IVC, IVR, ejection phase
Day 5
📘 WEEK 1 - DAY 5
Blood Vessel Structure: Artery Wall Layers, Vascular Smooth Muscle & the Arterial/Venous System
Source: Histology: A Text and Atlas with Correlated Cell and Molecular Biology | Katzung's Basic & Clinical Pharmacology 16th Ed
1. OVERVIEW - THE VASCULAR SYSTEM
HEART
↓
AORTA (elastic artery - large)
↓
MUSCULAR ARTERIES (medium - e.g. coronary, femoral, brachial)
↓
ARTERIOLES (resistance vessels - control BP)
↓
CAPILLARIES (exchange vessels - gas/nutrient transfer)
↓
VENULES
↓
SMALL VEINS → MEDIUM VEINS → LARGE VEINS (capacitance vessels)
↓
SVC / IVC → HEART (RA)
2. THE THREE LAYERS OF ALL BLOOD VESSELS
LUMEN (blood flows here)
|
|── TUNICA INTIMA (innermost layer)
|
|── [Internal Elastic Membrane] ← separates intima from media
|
|── TUNICA MEDIA (middle layer)
|
|── [External Elastic Membrane] ← separates media from adventitia
|
|── TUNICA ADVENTITIA (outermost layer)
|
SURROUNDING CONNECTIVE TISSUE
3. TUNICA INTIMA (Innermost Layer)
Components:
| Component | Description | Function |
|---|---|---|
| Endothelial cells | Single layer of flat cells; long axis parallel to blood flow; joined by tight + gap junctions | Barrier, anti-thrombotic, vasoactive mediator production |
| Basal lamina | Thin ECM layer beneath endothelium | Structural support |
| Subendothelial connective tissue | Collagen + elastic fibres + some smooth muscle cells | Support |
| Internal Elastic Membrane (IEM) | Wavy, fenestrated elastic sheet (most prominent in muscular arteries) | Separates intima from media; has pores for diffusion |
Endothelial Cell Functions (exam high-yield!):
| Function | Mediator Released |
|---|---|
| Vasodilation | Nitric oxide (NO), Prostacyclin (PGI₂) |
| Vasoconstriction | Endothelin-1, Thromboxane A₂ |
| Anti-coagulation | Prostacyclin, Thrombomodulin, Heparan sulphate |
| Pro-coagulation (when injured) | von Willebrand factor (stored in Weibel-Palade bodies), Tissue factor |
| Inflammation | P-selectin (stored in Weibel-Palade bodies), ICAM-1, VCAM-1 |
| Growth regulation | PDGF, FGF (stimulate smooth muscle proliferation) |
Clinical link: Endothelial dysfunction (e.g., from smoking, HTN, diabetes) is the FIRST step in atherosclerosis. Damaged endothelium stops producing NO → vasoconstriction + plaque formation begins.
4. TUNICA MEDIA (Middle Layer)
Components:
| Component | Description |
|---|---|
| Vascular smooth muscle cells (VSMCs) | Arranged in circular (spiral) layers around the vessel |
| Elastic lamellae | Concentric fenestrated sheets of elastin (more in elastic arteries) |
| Collagen fibres | Type I and III; provide tensile strength |
| Ground substance | Proteoglycans; synthesized by VSMCs |
Key fact: In the media, fibroblasts are ABSENT - it is the vascular smooth muscle cells (not fibroblasts) that synthesize collagen, elastin, and ECM here.
External Elastic Membrane (EEM):
- Separates media from adventitia
- More distinct in muscular arteries
- Not well-defined in elastic arteries
5. TUNICA ADVENTITIA (Outermost Layer)
Components:
| Component | Description | Function |
|---|---|---|
| Collagen fibres (Type I) | Thick, dense bundles | Prevent over-distension during systole |
| Elastic fibres | Loose network (not lamellae) | Elastic recoil |
| Fibroblasts + Macrophages | Main cells here | ECM maintenance, immune surveillance |
| Vasa vasorum | Small arterioles/capillaries within the adventitia | Supply O₂/nutrients to outer wall of large vessels |
| Nervi vasorum (Nervi vascularis) | Unmyelinated sympathetic fibres | Release noradrenaline → vasoconstriction |
Vasa vasorum = "vessels of the vessels". Present in arteries with lumen >0.5 mm. High density of vasa vasorum is associated with severity of atherosclerotic plaque.
6. TYPES OF ARTERIES - COMPARISON TABLE
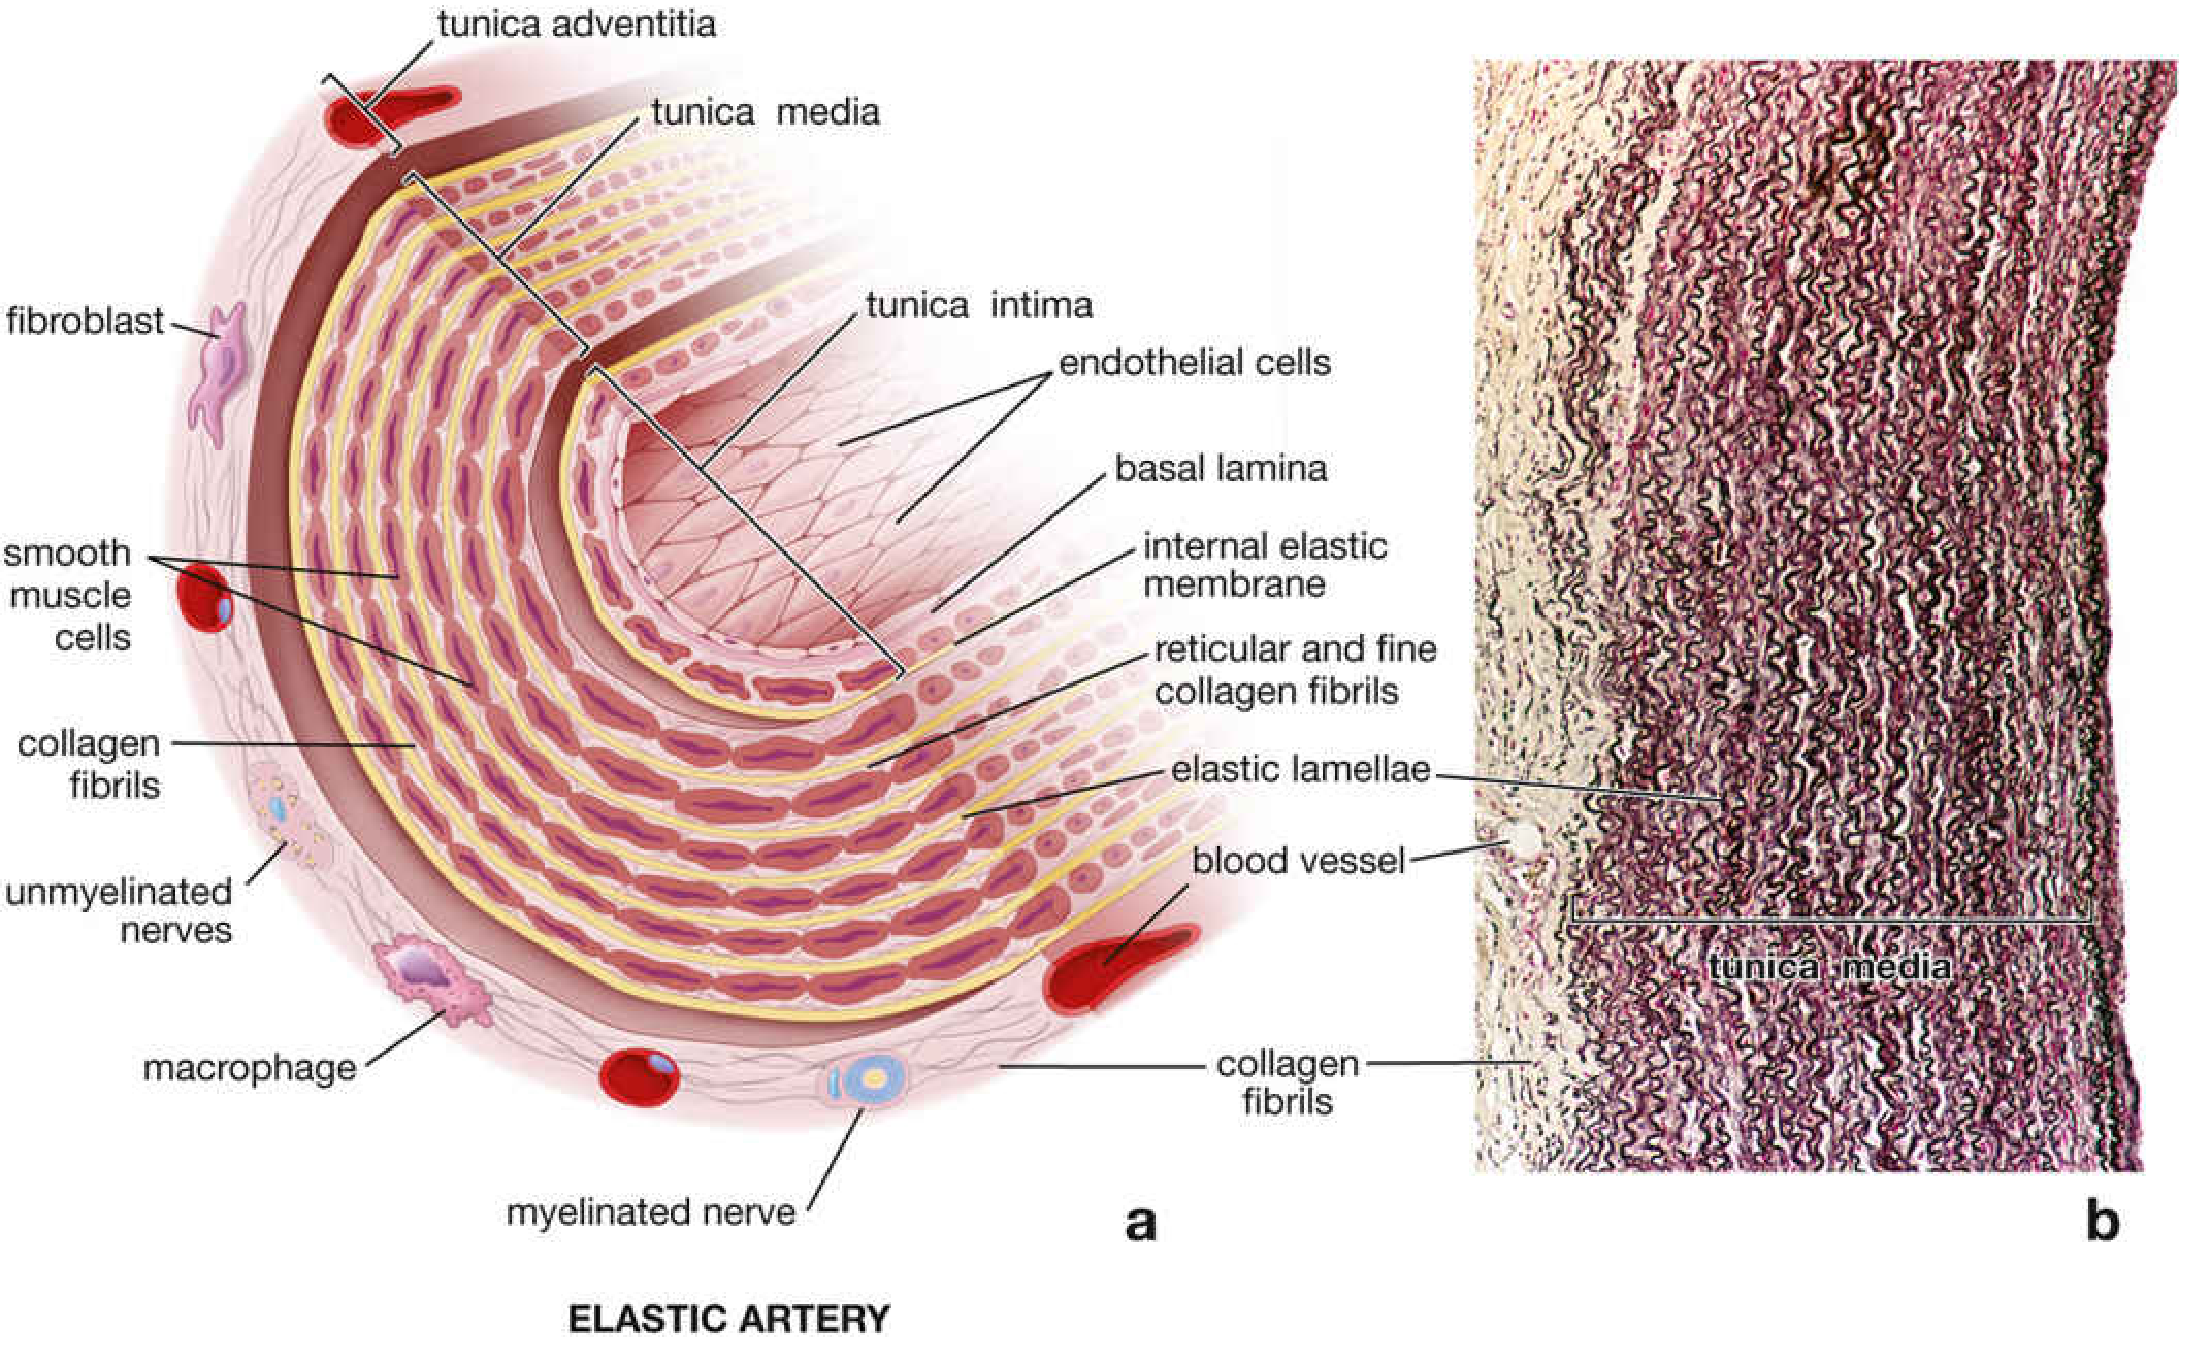
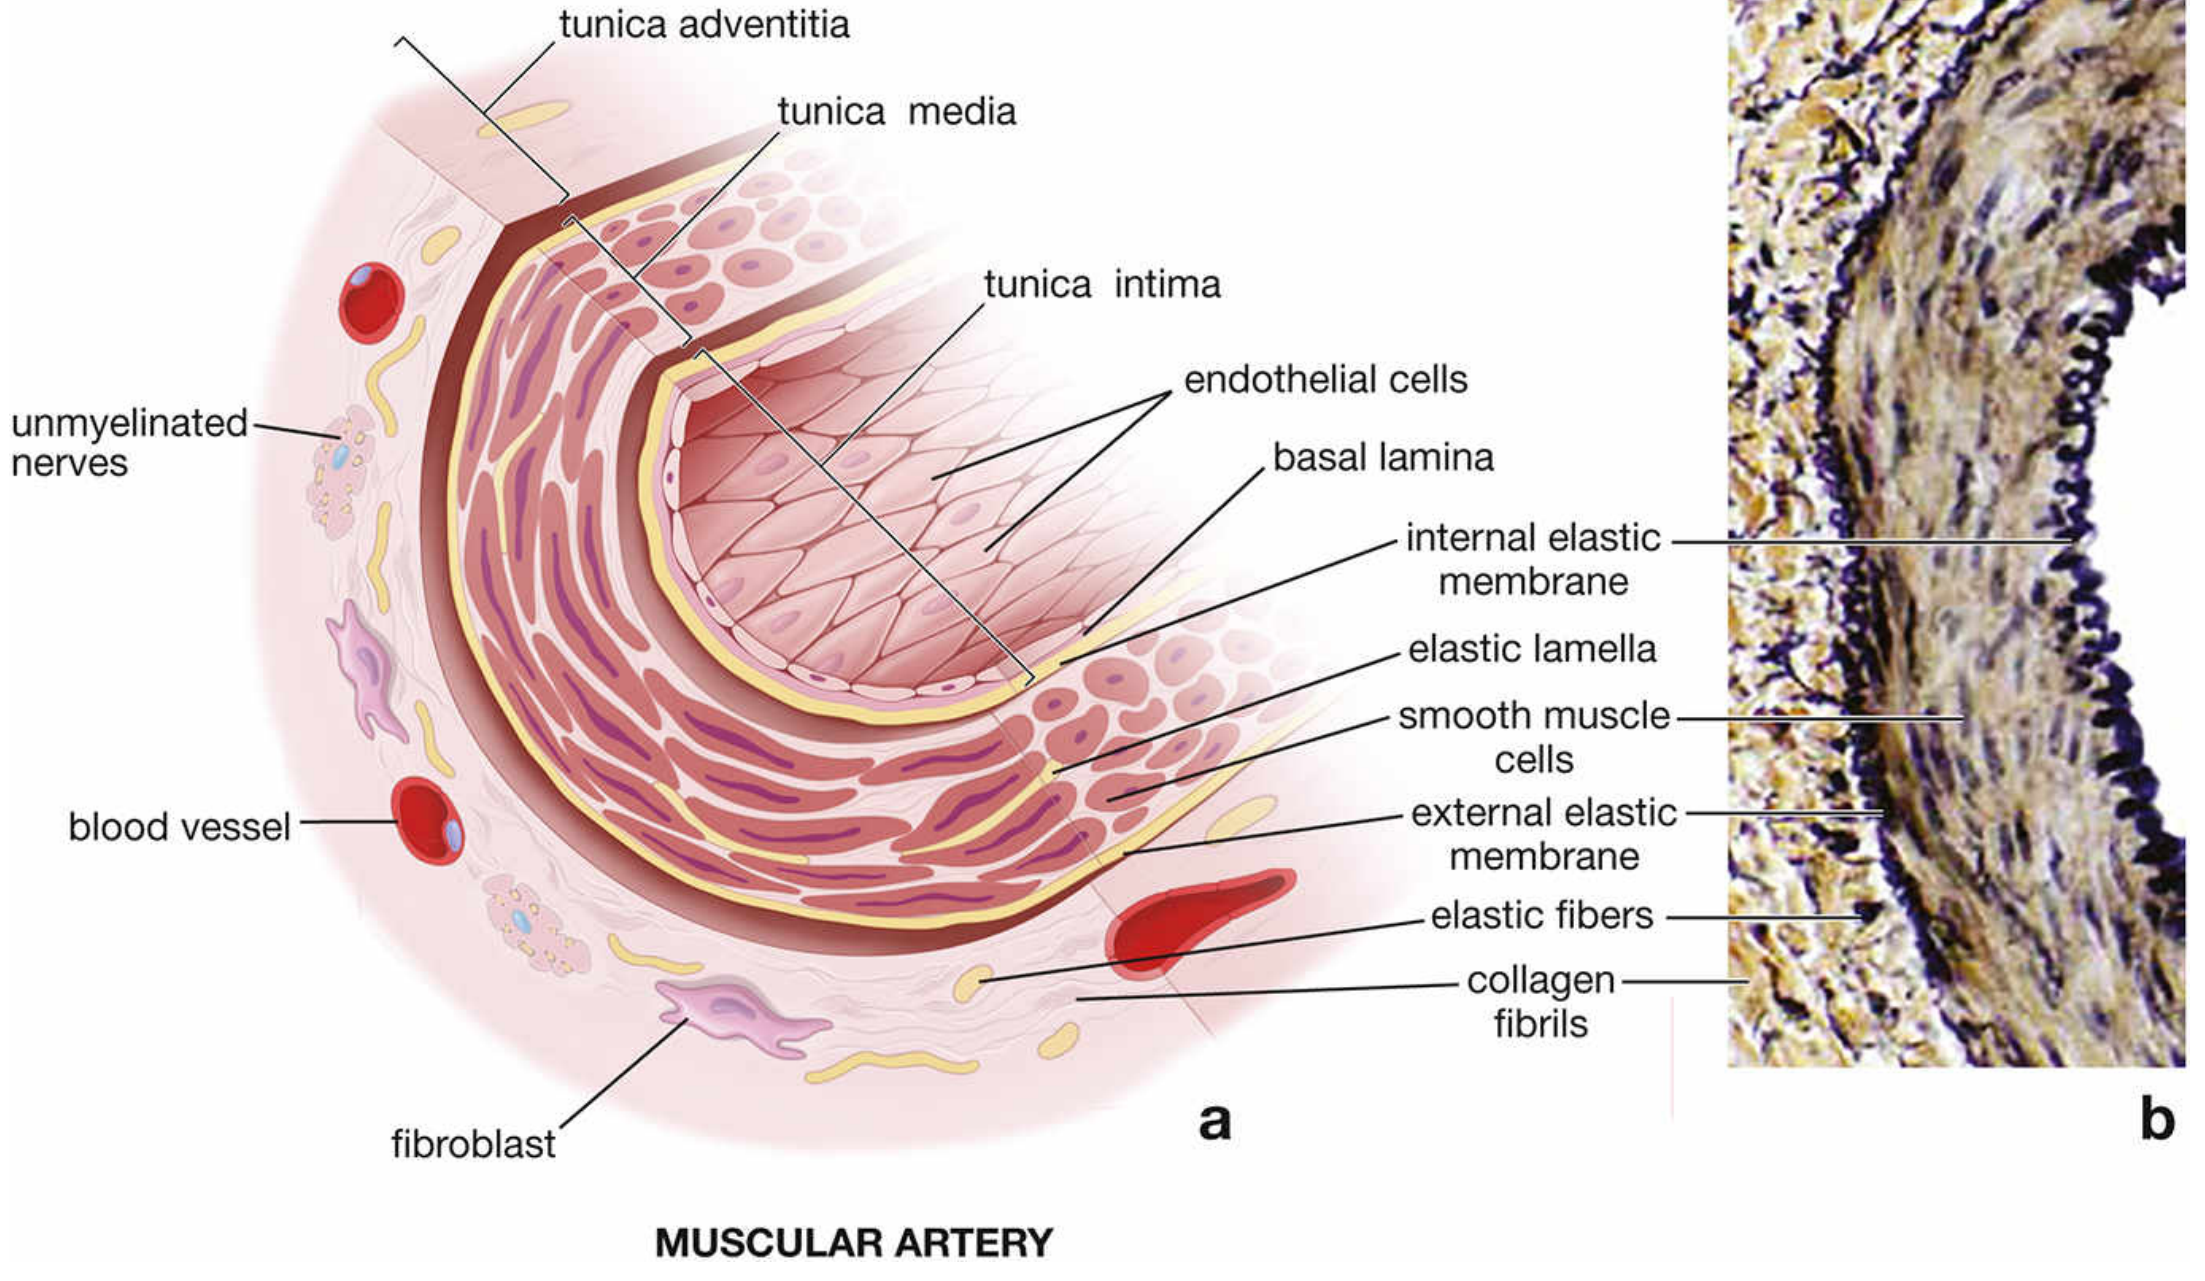
| Feature | Elastic Artery | Muscular Artery | Arteriole |
|---|---|---|---|
| Also called | Conducting artery | Distributing artery | Resistance vessel |
| Examples | Aorta, Pulmonary trunk, Carotids | Coronary, Femoral, Brachial, Radial | Pre-capillary vessels |
| Lumen size | Very large | Medium | Very small (<0.3 mm) |
| Tunica media | Many elastic lamellae + smooth muscle | Mostly smooth muscle; prominent IEM + EEM | 1-2 layers smooth muscle only |
| Tunica adventitia | Thin (< half of media) | Thick connective tissue | Very thin |
| IEM | Not well defined | Prominent - wavy, refractile | Present |
| EEM | Not prominent | Well defined | Absent |
| Main function | Windkessel effect (absorb pulse pressure) | Distribute blood to organs | Control peripheral resistance and blood flow |
The Windkessel Effect (Elastic Arteries):
During SYSTOLE:
Aorta receives blood → elastic walls STRETCH → absorb pulse pressure
During DIASTOLE:
Elastic walls RECOIL → continue to push blood forward even when heart relaxes
Result: Continuous (not pulsatile) blood flow to organs
Loss of elasticity with age → ↑ systolic BP (isolated systolic hypertension in elderly)
7. CAPILLARIES
Types:
| Type | Structure | Found In | Permeability |
|---|---|---|---|
| Continuous | Tight endothelium; tight junctions | Muscle, lung, brain (BBB), skin | Low (only small molecules) |
| Fenestrated | Endothelium with pores/fenestrae | Kidney glomerulus, intestinal villi, endocrine glands | Moderate (medium molecules) |
| Sinusoidal (Discontinuous) | Large gaps between cells; incomplete BM | Liver, spleen, bone marrow | High (large molecules + cells) |
8. VEINS - COMPARISON WITH ARTERIES
| Feature | Artery | Vein |
|---|---|---|
| Wall thickness | Thicker | Thinner |
| Tunica media | Thick (dominant in arteries) | Thin |
| Tunica adventitia | Thin | Dominant layer in veins |
| Lumen | Smaller, round | Larger, irregular/oval |
| Valves | Absent (except semilunar valves) | Present (prevent backflow, esp. in limbs) |
| Elastic tissue | Abundant | Less |
| Blood pressure | High (60-120 mmHg) | Low (0-10 mmHg) |
| Blood volume held | ~15% of total | ~65% of total (capacitance vessels) |
Veins as capacitance vessels: They hold 65% of total blood volume. Venodilator drugs (e.g., nitrates, GTN) pool blood in veins → ↓ preload → ↓ cardiac filling → ↓ pulmonary congestion in heart failure.
9. VASCULAR SMOOTH MUSCLE (VSM)
Key Features:
- Spindle-shaped cells with elongated nucleus
- Arranged in circular (low-pitch spiral) pattern → appear circular on cross-section
- Gap junctions between cells allow coordinated contraction
- VSMCs synthesize their own ECM: collagen, elastin, proteoglycans
- Can proliferate and migrate from media → intima in response to PDGF, FGF (critical in atherosclerosis)
How VSM Contracts (Pharmacology foundation):
VASOCONSTRICTION pathway:
Noradrenaline (from sympathetic nerves)
↓
α1-adrenoceptors on VSMCs
↓
Gq protein → ↑ IP3 → Ca²⁺ release from SR
↓
Ca²⁺ + Calmodulin → activates MLCK
↓
Myosin light chain phosphorylation
↓
Actin-Myosin cross-bridge → CONTRACTION → vasoconstriction
VASODILATION pathway:
NO (from endothelium) / Nitrates (drugs)
↓
Activates Guanylate Cyclase → ↑ cGMP
↓
cGMP → activates PKG → dephosphorylates myosin
↓
Actin-Myosin cross-bridge releases → RELAXATION → vasodilation
Regulators of Vascular Tone:
| Causes Vasoconstriction | Causes Vasodilation |
|---|---|
| Noradrenaline (α1 agonist) | Nitric Oxide (NO) from endothelium |
| Angiotensin II | Prostacyclin (PGI₂) |
| Endothelin-1 | Adenosine (metabolic autoregulation) |
| Vasopressin (ADH) | Bradykinin |
| Thromboxane A₂ | Atrial Natriuretic Peptide (ANP) |
| ↑ Ca²⁺ | ↑ cGMP / cAMP |
10. DIAGRAM TO DRAW - ARTERY WALL LAYERS
LUMEN
________________
| |
| ENDOTHELIUM | ← flat cells, long axis = blood flow
|________________|
| |
| subendothelial| ← connective tissue, collagen
| CT layer |
|________________|
| INTERNAL ELASTIC| ← wavy, fenestrated (prominent in muscular A)
| MEMBRANE |
|________________|
| TUNICA MEDIA | ← smooth muscle (circular) + elastic lamellae
| smooth muscle |
| elastic fibre |
|________________|
| EXTERNAL ELASTIC| ← distinct in muscular arteries
| MEMBRANE |
|________________|
| TUNICA ADVENTITIA| ← collagen, fibroblasts, vasa vasorum, nervi vasorum
|________________|
SURROUNDING TISSUE
11. PHARMACOLOGY LINK - Vasodilator Drugs & Their Targets
| Drug | Layer/Structure Targeted | Mechanism | Clinical Use |
|---|---|---|---|
| GTN / Nitrates | VSM (via cGMP) | ↑ NO → ↑ cGMP → smooth muscle relaxation | Angina, acute HF, acute pulmonary oedema |
| ACE inhibitors | Endothelium + VSM | Block AngII → less vasoconstriction + ↓ aldosterone | HTN, HF, post-MI |
| Calcium channel blockers (Amlodipine) | VSM | Block L-type Ca²⁺ channels → ↓ Ca²⁺ → relaxation | HTN, angina |
| Alpha blockers (Prazosin) | VSM (α1 receptors) | Block noradrenaline → prevent vasoconstriction | HTN, BPH |
| Hydralazine | Arteriolar VSM | Unknown - may ↑ cGMP + ↓ Ca²⁺ | HTN in pregnancy, severe HF |
| Sodium Nitroprusside | VSM (arterial + venous) | Releases NO directly → ↓↓ SVR | Hypertensive emergency |
12. KEY FACTS FOR MCQs
| Question | Answer |
|---|---|
| Which layer is the innermost layer of an artery? | Tunica intima |
| Which layer contains vascular smooth muscle? | Tunica media |
| Which layer contains vasa vasorum and nervi vasorum? | Tunica adventitia |
| Which elastic structure separates intima from media? | Internal Elastic Membrane (IEM) |
| Which layer is dominant in veins? | Tunica adventitia |
| What % of blood volume do veins hold? | ~65% |
| Fibroblasts are absent from which layer? | Tunica media |
| What organelle in endothelium stores vWF and P-selectin? | Weibel-Palade bodies |
| What does endothelium release to cause vasodilation? | Nitric oxide (NO) |
| What does endothelium release to cause vasoconstriction? | Endothelin-1 |
| Elastic arteries dampen pulsatile flow by? | Windkessel effect |
| Which type of artery best controls peripheral resistance? | Arterioles |
| Nitrates work by increasing which second messenger? | cGMP |
| Noradrenaline causes vasoconstriction via which receptor? | α1 adrenoceptors |
| Which capillary type has the highest permeability? | Sinusoidal (discontinuous) |
| Where are sinusoidal capillaries found? | Liver, spleen, bone marrow |
13. SELF-TEST (Do Before Day 6 Revision)
- Draw an artery wall cross-section from memory and label all three tunics
- What is the difference between elastic and muscular arteries in terms of tunica media composition?
- Why are arterioles called "resistance vessels"?
- A patient with endothelial damage (e.g., from diabetes) has less NO production. What happens to their blood pressure and why?
- Explain the Windkessel effect and why elderly patients develop isolated systolic hypertension
- Name TWO vasodilators and their specific mechanisms at the smooth muscle cell level
Day 6
📘 WEEK 1 - DAY 6
Weekly Revision + Self-Quiz
🎯 Today's Goal:
- Redraw both flowcharts from memory (no peeking!)
- Answer all MCQs
- Identify your weak spots before Week 2 begins
PART A: DRAW FROM MEMORY (Do These First - Before Reading Any Notes)
✏️ Task 1 - Redraw the Conduction Pathway Flowchart
- Location of each structure
- Intrinsic rate of each
- What ECG wave each produces
- Blood supply of SA node and AV node
✏️ Task 2 - Redraw the Wiggers Diagram
- All 7 phases (A through G)
- LV pressure curve with dicrotic notch
- LV volume curve (EDV → ESV)
- S1, S2, S3, S4 positions
- Valve opening/closing points
✏️ Task 3 - Redraw the Artery Wall
- All 3 tunics
- IEM and EEM
- Key cell types in each layer
- Vasa vasorum and nervi vasorum location
PART B: 50 MCQ SELF-QUIZ (Week 1 - All 5 Days)
🫀 SECTION 1: Heart Anatomy (Day 1) - 10 Questions
- a) Left ventricle
- b) Right atrium
- c) Left atrium ✅
- d) Right ventricle
- a) 3rd left ICS
- b) 4th left ICS
- c) 5th left ICS ✅
- d) 6th left ICS
- a) Crista terminalis
- b) Fossa ovalis ✅
- c) Moderator band
- d) Coronary sinus
- a) 3-5 mm
- b) 5-8 mm
- c) 8-12 mm ✅
- d) 12-15 mm
- a) Tricuspid
- b) Pulmonary
- c) Aortic
- d) Mitral ✅
- a) RV + RA + SVC
- b) SVC + RA + IVC ✅
- c) Aortic arch + RA + IVC
- d) SVC + RV + IVC
- a) Fibrous pericardium
- b) Parietal layer of serous pericardium
- c) Visceral layer of serous pericardium ✅
- d) Endocardium
- a) Left atrium
- b) Right ventricle
- c) Right atrium ✅
- d) Left ventricle
- a) Left ventricle
- b) Right atrium
- c) Left atrium
- d) Right ventricle ✅
- a) Deoxygenated
- b) Oxygenated ✅
- c) Mixed
- d) Depends on age
❤️ SECTION 2: Coronary Arteries & Conduction (Day 2) - 10 Questions
- a) RCA
- b) LCx
- c) LAD ✅
- d) PDA
- a) LAD
- b) LCx
- c) RCA ✅
- d) Left main stem
- a) LAD
- b) LCx
- c) Right marginal branch
- d) Posterior Descending Artery (PDA) ✅
- a) Floor of RA near coronary sinus
- b) Junction of SVC and RA ✅
- c) Membranous interventricular septum
- d) Apex of right ventricle
- a) 60-100/min
- b) 40-60/min ✅
- c) 20-40/min
- d) 100-120/min
- a) AV node
- b) SA node
- c) Bundle of His ✅
- d) Purkinje fibres
- a) Crista terminalis
- b) Pectinate muscles
- c) Septomarginal trabecula (Moderator band) ✅
- d) Fossa ovalis
- a) LAD (80%)
- b) LCx (80%)
- c) RCA (80%) ✅
- d) Left main stem
- a) Systole
- b) Isovolumetric contraction
- c) Diastole ✅
- d) Isovolumetric relaxation
- a) RCA
- b) LAD
- c) LCx ✅
- d) PDA
🔄 SECTION 3: Cardiac Cycle & Heart Sounds (Day 3) - 10 Questions
- a) Aortic + Pulmonary
- b) Mitral + Tricuspid ✅
- c) All four valves
- d) Only mitral valve
- a) Mitral valve opening
- b) Aortic valve opening
- c) Aortic valve closure ✅
- d) End of rapid ejection
- a) Isovolumetric contraction
- b) Rapid ejection
- c) Isovolumetric relaxation ✅
- d) Rapid filling
- a) Normal finding
- b) LV hypertrophy
- c) Heart failure / volume overload ✅
- d) Atrial fibrillation
- a) ≥40%
- b) ≥50%
- c) ≥55% ✅
- d) ≥65%
- a) 40%
- b) 50% ✅
- c) 60%
- d) 70%
(EF = (140-70)/140 × 100 = 50%)
- a) Tricuspid valve closure
- b) Venous filling of RA
- c) Atrial contraction ✅
- d) RV systole
- a) RBBB
- b) ASD ✅
- c) LBBB
- d) Pulmonary stenosis
- a) LV pressure > LA pressure
- b) LV pressure > Aortic pressure ✅
- c) LA pressure > LV pressure
- d) Aortic pressure > LV pressure
- a) P wave
- b) QRS complex ✅
- c) ST segment
- d) T wave
💪 SECTION 4: Hemodynamics (Day 4) - 10 Questions
- a) Resistance to blood flow in arteries
- b) Intrinsic strength of myocardium
- c) End-diastolic volume / ventricular filling ✅
- d) Aortic valve resistance
- a) Dobutamine
- b) Noradrenaline
- c) Furosemide ✅
- d) Digoxin
- a) PCWP
- b) Central venous pressure
- c) Systemic vascular resistance ✅
- d) Heart rate
- a) Decreased stroke volume
- b) No change in stroke volume
- c) Increased stroke volume ✅
- d) Decreased heart rate
- a) Increased preload
- b) Increased contractility ✅
- c) Increased afterload
- d) Decreased heart rate
- a) 1.5 μm
- b) 1.8 μm
- c) 2.2 μm ✅
- d) 2.8 μm
- a) 2-3 L/min
- b) 4-8 L/min ✅
- c) 8-12 L/min
- d) 1-2 L/min
- a) Upward and left
- b) Downward and right ✅
- c) No shift - only moves along the curve
- d) Upward and right
- a) Increasing contractility
- b) Decreasing heart rate
- c) Reducing afterload ✅
- d) Increasing preload
- a) 2.0 L/min/m²
- b) 3.0 L/min/m² ✅
- c) 4.0 L/min/m²
- d) 12 L/min/m²
(CI = 6/2 = 3.0 L/min/m²)
🩸 SECTION 5: Blood Vessel Structure (Day 5) - 10 Questions
- a) Tunica intima
- b) Tunica media ✅
- c) Tunica adventitia
- d) Subendothelial layer
- a) Media from adventitia
- b) Intima from media ✅
- c) Endothelium from subendothelial tissue
- d) Adventitia from surrounding tissue
- a) Tunica intima
- b) Tunica media
- c) Tunica adventitia ✅
- d) Endothelium
- a) Lysosomes
- b) Golgi apparatus
- c) Weibel-Palade bodies ✅
- d) Mitochondria
- a) Tunica intima
- b) Tunica media
- c) Tunica adventitia ✅
- d) Same as arteries
- a) 15%
- b) 30%
- c) 50%
- d) 65% ✅
- a) They have the thickest walls
- b) They have valves
- c) They control peripheral resistance and distribute blood flow ✅
- d) They have the most elastic tissue
- a) Blocking α1 receptors
- b) Activating guanylate cyclase → ↑ cGMP → smooth muscle relaxation ✅
- c) Blocking calcium channels
- d) Inhibiting ACE
- a) Arterioles
- b) Capillaries
- c) Elastic arteries ✅
- d) Veins
- a) Smooth muscle cells
- b) Endothelial cells (not present here anyway)
- c) Fibroblasts ✅
- d) Macrophages
PART C: SCORE YOUR RESULTS
| Score | What It Means | What To Do |
|---|---|---|
| 45-50 | Excellent - Week 1 mastered! | Move confidently to Week 2 |
| 38-44 | Good - minor gaps | Re-read weak sections tonight |
| 30-37 | Average - some concepts unclear | Revisit 2-3 days' notes today |
| Below 30 | Needs revision | Spend today going through all 5 days again |
PART D: TOPIC WEAKNESS TRACKER
| Day | Topic | My Score (out of 10) | Weak Points |
|---|---|---|---|
| Day 1 | Heart Anatomy | /10 | |
| Day 2 | Coronary + Conduction | /10 | |
| Day 3 | Cardiac Cycle + Heart Sounds | /10 | |
| Day 4 | Hemodynamics | /10 | |
| Day 5 | Blood Vessels | /10 |
PART E: MASTER MIND MAP (Draw This Tonight)
HEART ANATOMY (Day 1)
↓
4 Chambers + 4 Valves
↓
CORONARY ARTERIES (Day 2) CONDUCTION SYSTEM (Day 2)
RCA → inferior wall SA node → AV node → Bundle of His
LAD → anterior wall → Bundle branches → Purkinje
LCx → lateral wall → ECG: P → PR → QRS → T
↓ ↓
CARDIAC CYCLE (Day 3) HEMODYNAMICS (Day 4)
7 phases → S1/S2/S3/S4 Preload / Afterload / Contractility
EDV → SV → ESV → EF Frank-Starling curve
Wiggers diagram CO = HR × SV
↓
BLOOD VESSELS (Day 5)
Intima (endothelium → NO, vWF)
Media (smooth muscle → VSR)
Adventitia (vasa vasorum, nervi vasorum)
Elastic vs Muscular → Arterioles → Capillaries → Veins
↓
CLINICAL LINKS
HTN = ↑ afterload → LV hypertrophy
HF = ↓ contractility → Frank-Starling shifts down
Diuretics → ↓ preload
ACEi/ARBs → ↓ afterload
Endothelial damage → atherosclerosis starts
🗓️ LOOKING AHEAD - WEEK 2 PREVIEW
| Day | Topic |
|---|---|
| Day 7 | Hypertension & Hypotension - etiology, pathophysiology, classification |
| Day 8 | Atherosclerosis - mechanism, risk factors, complications |
| Day 9 | Raynaud's disease - pathophysiology, clinical features |
| Day 10 | Aneurysms - types, etiopathogenesis |
| Day 11 | Peripheral vascular disorders - clinical approach |
| Day 12 | Revision + Master mind-map |
Day 7
Day 7
renin angiotensin aldosterone system RAAS hypertension flowchart
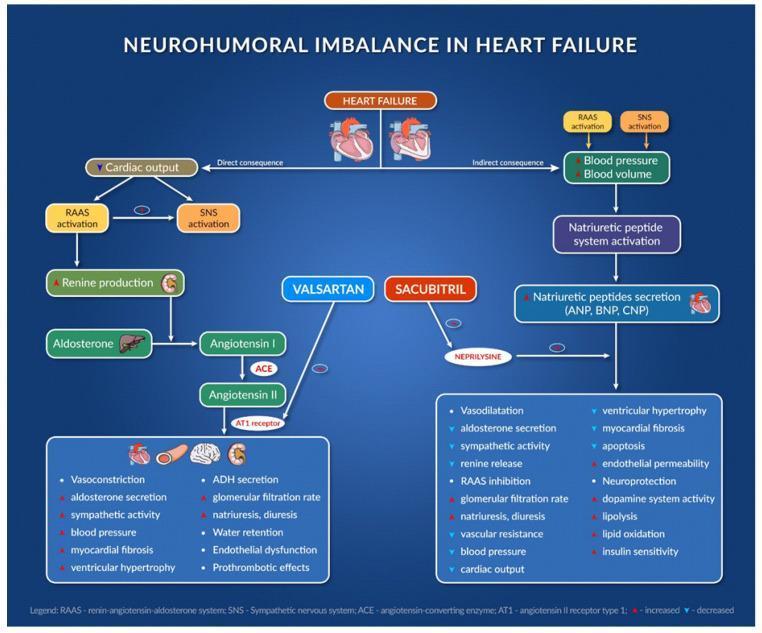
A complex pathophysiology diagram and pharmacological flowchart titled 'Neurohumoral Imbalance in Heart Failure'. It illustrates the interaction between the Renin-Angiotensin-Aldosterone System (RAAS), the Sympathetic Nervous System (SNS), and the Natriuretic Peptide (NP) system in the context of heart failure. The left side of the diagram outlines the RAAS cascade: Renin production leads to Angiotensin I, which is converted to Angiotensin II by ACE, ultimately binding to the AT1 receptor to cause deleterious effects like vasoconstriction, myocardial fibrosis, and water retention. The right side shows the NP system (ANP, BNP, CNP) which promotes diuresis and vasodilation. Centrally, the diagram depicts the pharmacological intervention of the ARNI class: Valsartan (an ARB) inhibiting the AT1 receptor, and Sacubitril (a neprilysin inhibitor) preventing the breakdown of natriuretic peptides. A comparison list at the bottom contrasts the pathological effects of uncontrolled RAAS/SNS activation against the beneficial physiological outcomes of ARNI therapy, including reduced ventricular hypertrophy, increased insulin sensitivity, and improved cardiac output. The diagram uses standard medical icons for the heart, kidneys, and liver to indicate anatomical sites of hormone production and action.
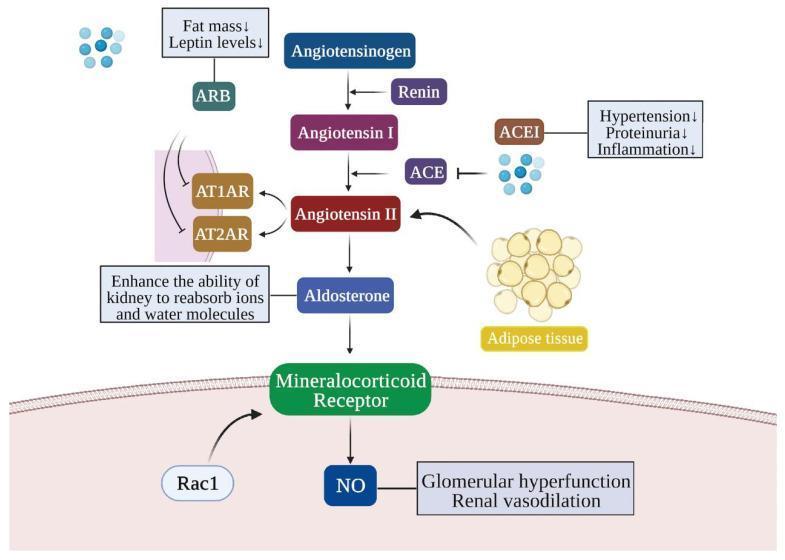
This pathophysiology diagram illustrates the Renin-Angiotensin-Aldosterone System (RAAS) pathway and its role in obesity-related kidney injury, highlighting pharmaceutical intervention points. The central pathway shows the enzymatic conversion of Angiotensinogen to Angiotensin I by Renin, and Angiotensin I to Angiotensin II via Angiotensin-Converting Enzyme (ACE). Angiotensin II acts on receptors AT1AR and AT2AR, facilitating kidney reabsorption of ions and water. The diagram specifically notes that adipose tissue contributes to increased Angiotensin II levels. Further down the cascade, Angiotensin II stimulates Aldosterone, which activates the Mineralocorticoid Receptor (supported by Rac1). This activation leads to the production of Nitric Oxide (NO), contributing to glomerular hyperfunction and renal vasodilation. Two major drug classes are highlighted: ACE Inhibitors (ACEI), which block the ACE enzyme to reduce hypertension, proteinuria, and inflammation; and Angiotensin Receptor Blockers (ARB), which inhibit AT1AR/AT2AR receptors and are associated with decreased fat mass and leptin levels.
📘 WEEK 2 - DAY 7
Hypertension & Hypotension: Etiology, Pathophysiology, Classification
Source: Fuster & Hurst's The Heart, 15th Ed | Harrison's Principles of Internal Medicine 22E | Brenner & Rector's The Kidney
1. WHAT IS BLOOD PRESSURE?
BP = Cardiac Output (CO) × Total Peripheral Resistance (TPR)
MAP = Diastolic BP + 1/3 (Systolic BP - Diastolic BP)
= DBP + 1/3 Pulse Pressure
Normal MAP = 70-100 mmHg
Normal BP = <120/80 mmHg
- RAAS (Renin-Angiotensin-Aldosterone System) - sodium retention + vasoconstriction
- Sympathetic Nervous System (SNS) - vasoconstriction + ↑ HR + ↑ contractility
- Kidney - controls blood volume via sodium/water excretion (pressure-natriuresis)
2. CLASSIFICATION OF HYPERTENSION
By JNC / ACC/AHA Guidelines (2017):
| Category | Systolic (mmHg) | Diastolic (mmHg) |
|---|---|---|
| Normal | <120 | AND <80 |
| Elevated (Prehypertension) | 120-129 | AND <80 |
| Stage 1 HTN | 130-139 | OR 80-89 |
| Stage 2 HTN | ≥140 | OR ≥90 |
| Hypertensive Crisis | >180 | AND/OR >120 |
Hypertensive Crisis - Two Types:
| Hypertensive Urgency | Hypertensive Emergency | |
|---|---|---|
| BP | >180/120 mmHg | >180/120 mmHg |
| Organ damage | No target organ damage | Yes - acute organ damage |
| Examples | Asymptomatic severe HTN | Hypertensive encephalopathy, Aortic dissection, Acute MI, Acute pulmonary oedema |
| Management | Oral antihypertensives; lower BP over 24-48 hrs | IV drugs (nitroprusside/labetalol); lower BP by 25% in first hour |
By Aetiology - Most Important Classification:
HYPERTENSION
|
|──── PRIMARY (Essential) HTN → >90-95% of cases
| - No identifiable single cause
| - Multifactorial
|
└──── SECONDARY HTN → <5-10% of cases
- Identifiable, potentially treatable cause
3. PRIMARY (ESSENTIAL) HYPERTENSION
Definition:
High BP with no identifiable single secondary cause - it is multifactorial.
Risk Factors / Contributing Causes:
| Category | Factors |
|---|---|
| Non-modifiable | Age, Family history/genetics, Race (higher in Africans), Male sex (before menopause) |
| Modifiable - major | Obesity/overweight (accounts for 65-75% of primary HTN risk!), Physical inactivity, High dietary sodium, Alcohol excess, Low potassium intake |
| Modifiable - other | Smoking, Dyslipidaemia, Diabetes, Stress |
Pathophysiology - How Primary HTN Develops (Multifactorial):
MULTIPLE CONTRIBUTING MECHANISMS:
1. INCREASED SYMPATHETIC ACTIVITY
Stress/obesity → ↑ SNS tone
↓
↑ Heart rate + ↑ contractility → ↑ CO
↑ Vasoconstriction → ↑ TPR
↑ Renal sodium reabsorption → ↑ volume
2. RAAS ACTIVATION
↑ Angiotensin II → ↑ TPR + ↑ aldosterone
↑ Aldosterone → ↑ Na⁺/H₂O retention → ↑ CO
3. RENAL SODIUM RETENTION
Impaired pressure-natriuresis
↑ Na⁺ retention → volume expansion → ↑ CO
(autoregulation then ↑ TPR to normalise flow)
4. VASCULAR REMODELLING (long-term)
Chronic ↑ BP → vessel wall thickening
Arteriolar hyalinosis → ↑ TPR becomes structural/irreversible
5. ENDOTHELIAL DYSFUNCTION
↓ Nitric oxide production → ↓ vasodilation
↑ Endothelin-1 → ↑ vasoconstriction
6. OBESITY-SPECIFIC PATHWAY
Excess fat → ↑ Leptin → hypothalamic MC4R activation
↓
↑ Renal sympathetic nerve activity → Na⁺ retention + ↑ CO
↑ RAAS activation (adipose tissue produces angiotensinogen)
↑ Aldosterone → Na⁺ retention
4. SECONDARY HYPERTENSION
Definition:
HTN caused by an identifiable and often correctable underlying condition.
Causes and Key Features:
| Cause | Mechanism | Clue / Hallmark |
|---|---|---|
| Renovascular disease (Renal artery stenosis) | ↓ renal perfusion → ↑ Renin → ↑ Ang II → ↑ BP | Abdominal bruit, young woman, refractory HTN, ↑ creatinine on ACEi |
| Primary Aldosteronism (Conn's syndrome) | ↑ Aldosterone → Na⁺ retention + K⁺ loss | Hypokalaemia + HTN, adrenal adenoma |
| Phaeochromocytoma | Catecholamine-secreting adrenal tumour → ↑ SVR | Episodic HTN + headache + sweating + palpitations ("Rule of 10s") |
| Cushing's syndrome | Excess cortisol → Na⁺ retention + ↑ SVR | Central obesity, moon face, striae, buffalo hump |
| Chronic kidney disease (CKD) | ↓ GFR → Na⁺/H₂O retention + ↑ RAAS | ↑ Creatinine, proteinuria |
| Hypothyroidism | ↓ HR + ↑ TPR (diastolic HTN) | Cold intolerance, fatigue, ↑ TSH |
| Hyperthyroidism | ↑ CO + ↓ TPR (systolic HTN) | Weight loss, palpitations, ↓ TSH |
| Coarctation of Aorta | Mechanical obstruction → ↑ BP in arms | HTN in arms + low BP in legs, rib notching on CXR |
| Obstructive Sleep Apnoea | Intermittent hypoxia → ↑ SNS + ↑ RAAS | Snoring, obese, refractory morning HTN |
| Pre-eclampsia | Pregnancy-induced HTN + proteinuria | After 20 weeks gestation, ↑ BP + proteinuria |
When to suspect Secondary HTN: Age <40, no family history, resistant to 3+ drugs, hypokalaemia, episodic symptoms, acute onset, renal impairment
5. THE RAAS PATHWAY - MASTER FLOWCHART (Diagram to Draw)
↓ Renal perfusion pressure
↓ Na⁺ delivery to macula densa
↑ Sympathetic stimulation (β1 receptors)
↓
JUXTAGLOMERULAR CELLS of kidney
↓ secrete
RENIN
↓ acts on
ANGIOTENSINOGEN (from liver)
↓ cleaves to
ANGIOTENSIN I (inactive decapeptide)
↓ ACE (from lung endothelium)
ANGIOTENSIN II (active octapeptide)
↓
┌────────────┬───────────────┬───────────────┐
↓ ↓ ↓ ↓
ADRENAL BLOOD KIDNEY BRAIN
CORTEX VESSELS TUBULES
↓ ↓ ↓ ↓
↑Aldosterone Vasoconstriction ↑Na⁺/H₂O ↑Thirst
↓ ↓ reabsorption ↑ADH
↑Na⁺/H₂O ↑ TPR ↑ Blood volume ↑
retention ↑ BP ↑ CO → ↑ BP ↑ BP
↓
NET RESULT: ↑ Blood Pressure
Drugs That Block RAAS:
| Drug Class | Where it Acts | Effect |
|---|---|---|
| ACE Inhibitors (Ramipril, Enalapril) | Block ACE → ↓ Ang II | ↓ Vasoconstriction + ↓ Aldosterone + ↑ Bradykinin (→ cough as SE) |
| ARBs (Losartan, Valsartan) | Block AT1 receptor | ↓ All Ang II effects; no bradykinin → no cough |
| Renin inhibitors (Aliskiren) | Block Renin directly | ↓ Ang I + II + Aldosterone |
| Aldosterone antagonists (Spironolactone) | Block mineralocorticoid receptor | ↓ Na⁺ retention + ↑ K⁺; used in resistant HTN + HF |
| Beta blockers (Atenolol, Bisoprolol) | Block β1 on JG cells → ↓ Renin release | ↓ RAAS activation + ↓ HR + ↓ CO |
6. BP REGULATION FLOWCHART (Diagram to Draw)
↑ Blood Pressure detected by
↓
BARORECEPTORS (carotid sinus + aortic arch)
↓
MEDULLARY CARDIOVASCULAR CENTRE (NTS)
↓
Sends signals:
┌──────────────────────────────┐
↓ ↓
↓ Sympathetic outflow ↑ Parasympathetic (Vagal)
↓ ↓
↓ HR, ↓ contractility, ↓ CO ↓ HR (SA node slowed)
↓ Vasoconstriction → ↓ TPR
↓
↓ MAP (pressure normalises)
↓
KIDNEY also responds:
↑ GFR + ↓ Na⁺ reabsorption → pressure natriuresis
→ ↓ blood volume → ↓ CO → ↓ BP
7. TARGET ORGAN DAMAGE FROM HYPERTENSION
| Organ | Damage | Clinical Sign |
|---|---|---|
| Cardiac | LV hypertrophy → HF; Coronary artery disease; Aortic dissection | S4 gallop, dyspnea, angina |
| Head (Brain) | Hypertensive encephalopathy; Haemorrhagic/ischaemic stroke; Lacunar infarcts | Headache, confusion, focal deficits |
| Eyes | Hypertensive retinopathy (AV nipping, flame haemorrhages, papilloedema) | Blurred vision, visual field loss |
| Small vessels (Kidney) | Nephrosclerosis → CKD; Proteinuria | ↑ Creatinine, ↓ GFR |
| Systemic vessels | Accelerated atherosclerosis; Aortic aneurysm; PAD | Claudication, absent pulses |
Keith-Wagener Classification of Hypertensive Retinopathy:
| Grade | Finding |
|---|---|
| Grade I | Silver/copper wiring of arterioles |
| Grade II | AV nipping (AV crossing changes) |
| Grade III | Flame haemorrhages + Cotton-wool spots |
| Grade IV | Papilloedema ← Malignant HTN |
8. HYPOTENSION
Definition: Systolic BP <90 mmHg or MAP <65 mmHg
Types and Causes:
| Type | Definition | Common Causes |
|---|---|---|
| Absolute hypotension | BP consistently low | Hypovolaemia, Addison's disease, hypothyroidism, sepsis |
| Orthostatic (Postural) hypotension | SBP drops ≥20 mmHg or DBP ≥10 mmHg within 3 min of standing | Dehydration, autonomic neuropathy (diabetes, Parkinson's), medications (alpha blockers, diuretics) |
| Neurally mediated (Vasovagal) | Sudden ↑ vagal tone → ↓ HR + ↓ BP → syncope | Emotional stress, pain, prolonged standing, Valsalva |
| Cardiogenic hypotension | Heart fails to pump adequate CO | Massive MI, severe HF, cardiac tamponade |
Physiological Response to Hypotension:
↓ BP → baroreceptors detect ↓ stretch
↓
↑ Sympathetic outflow (rapid, seconds)
↓
↑ HR + ↑ contractility + ↑ vasoconstriction
↓
Short-term BP restoration
+
↑ RAAS activation (hours to days)
↑ ADH (vasopressin) release
↑ Na⁺/H₂O retention → ↑ volume → ↑ CO
↓
Long-term BP restoration
9. ANTI-HYPERTENSIVE PHARMACOLOGY PREVIEW
| Drug Class | Primary Mechanism | BP Target |
|---|---|---|
| Diuretics (Thiazides: HCTZ) | ↓ Na⁺/H₂O → ↓ volume → ↓ CO; long-term: ↓ TPR | 1st line, esp. elderly |
| ACE inhibitors | ↓ Ang II → ↓ TPR + ↓ Aldosterone | 1st line, esp. DM/CKD/HF |
| ARBs | ↓ AT1 receptor → ↓ TPR + ↓ Aldosterone | ACEi intolerant |
| Calcium channel blockers (DHP: Amlodipine) | Block L-type Ca²⁺ in VSM → ↓ TPR | HTN + angina; elderly |
| Beta blockers (Metoprolol) | ↓ HR + ↓ CO + ↓ Renin | HTN + post-MI/HF/arrhythmia |
| Alpha blockers (Doxazosin) | Block α1 → ↓ vasoconstriction | HTN + BPH |
| Aldosterone antagonists (Spironolactone) | ↓ Na⁺ retention | Resistant HTN + HF |
| Vasodilators (Hydralazine) | Direct arteriolar dilation | HTN in pregnancy |
10. KEY FACTS FOR MCQs
| Question | Answer |
|---|---|
| Most common type of hypertension? | Primary / Essential (>90-95%) |
| Biggest single contributing factor to primary HTN? | Obesity (65-75% of risk) |
| HTN + hypokalaemia → suspect? | Primary Aldosteronism (Conn's syndrome) |
| Episodic HTN + headache + sweating → suspect? | Phaeochromocytoma |
| HTN in arms + low BP in legs → suspect? | Coarctation of Aorta |
| BP formula? | BP = CO × TPR |
| RAAS: what does ACE convert? | Ang I → Ang II |
| ACE inhibitor side effect (why)? | ↑ Bradykinin → dry cough |
| Grade IV hypertensive retinopathy = ? | Papilloedema = Malignant HTN |
| Orthostatic hypotension definition? | SBP drop ≥20 mmHg or DBP drop ≥10 mmHg on standing |
| Stage 2 HTN BP value? | ≥140/90 mmHg |
| Hypertensive emergency: how fast to lower BP? | By 25% in first hour (NOT all at once - risks cerebral ischaemia) |
| Long-term HTN → what cardiac change? | LV hypertrophy (↑ afterload → concentric hypertrophy) |
| Drug for HTN in pregnancy? | Methyldopa, Labetalol, Nifedipine (ACEi/ARBs CONTRAINDICATED) |
| Pressure natriuresis = ? | ↑ BP → ↑ Na⁺ excretion by kidney → ↓ volume → ↓ BP (negative feedback) |
11. SELF-TEST (Do Before Day 8)
- Draw the RAAS flowchart from memory - from ↓ renal perfusion to ↑ BP, marking where each drug class acts
- A 28-year-old woman has severe HTN with hypokalaemia. What is the likely diagnosis and what test confirms it?
- A patient develops a dry cough after starting Ramipril. Why? What do you switch to?
- Explain the difference between hypertensive urgency and emergency
- What are the 5 target organs damaged by chronic hypertension? (CHESS)
- Why does obesity cause hypertension? Name at least 3 mechanisms
Day 8
atherosclerosis plaque formation stages fatty streak fibrous plaque diagram
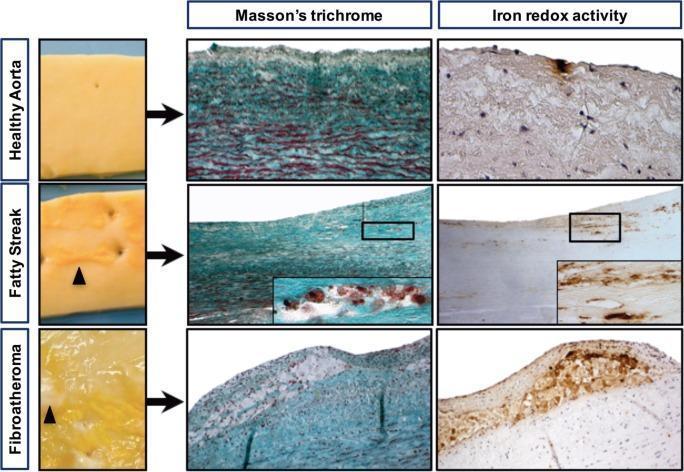
This composite educational graphic illustrates the progression of atherosclerosis in the human aorta through macroscopic photography and histopathology. The content is organized into three rows: Healthy Aorta, Fatty Streak, and Fibroatheroma. Macroscopic clinical photographs show the transition from a smooth luminal interface to subendothelial yellow deposits (black arrowheads) in the fatty streak, and finally a complex fibroatheroma characterized by yellow lipid deposits encased in a white fibrous capsule. Light microscopy columns utilize Masson’s trichrome staining and Iron redox activity staining (Perls reaction followed by DiAminoBenzidin polymerization). In the healthy aorta, minimal iron staining is present. The fatty streak shows intimal thickening with focal DAB-positive iron deposits associated with granular foam cells. The fibroatheroma displays a prominent lipid core and advanced plaque architecture, with intense brown DAB staining indicating significant accumulation of redox-active iron within the lesion. This comparison highlights the role of iron-dependent oxidative stress and foam cell formation in early-stage atheroma development.
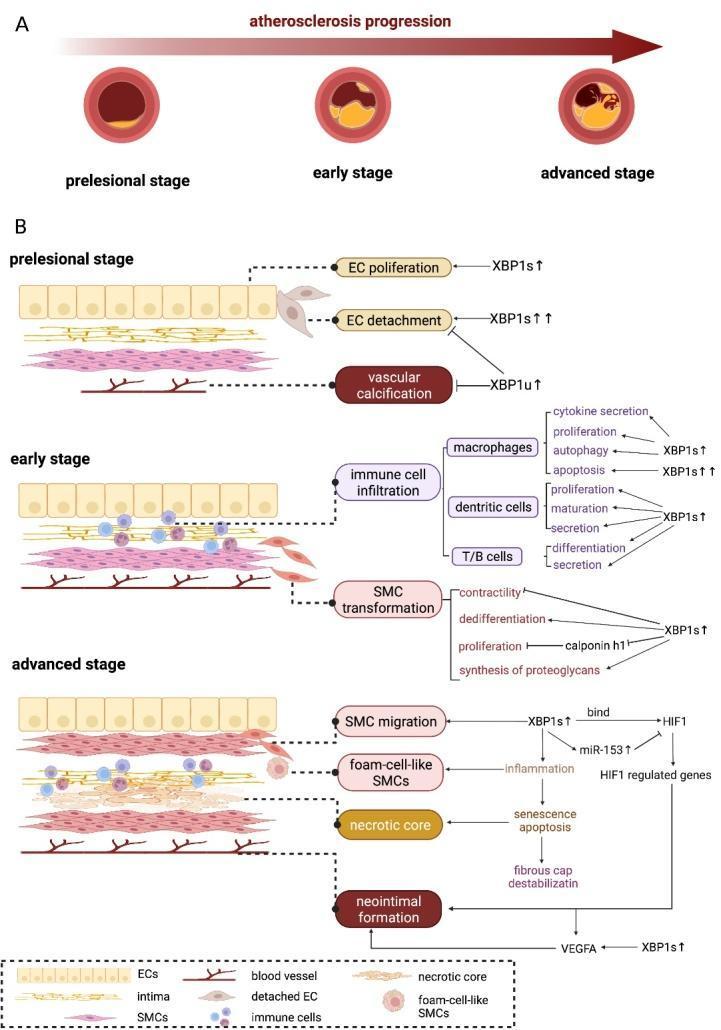
This medical pathophysiology diagram illustrates the progression of atherosclerosis across three stages—prelesional, early, and advanced—focusing on the regulatory role of X-box binding protein 1 (XBP1). Section A presents cross-sections of an artery showing luminal narrowing and plaque accumulation. Section B provides a high-resolution view of the vessel wall layers, including endothelial cells (ECs), the intima, and smooth muscle cells (SMCs). In the prelesional stage, XBP1 isoforms modulate EC proliferation and detachment. The early stage is characterized by immune cell infiltration (macrophages, dendritic cells, T/B cells) and SMC transformation, where XBP1s influences contractility, dedifferentiation, and proteoglycan synthesis. The advanced stage depicts significant pathology, including SMC migration, the formation of foam-cell-like SMCs, a necrotic core, and neointimal formation. Molecular pathways highlight XBP1s interacting with HIF1 and miR-153 to regulate angiogenesis (VEGFA) and fibrous cap destabilization via senescence and apoptosis. This infographic serves as a cardiovascular research and educational tool for understanding the cellular and molecular mechanisms of atherogenesis.
📘 WEEK 2 - DAY 8
Atherosclerosis: Mechanism, Risk Factors, Stages of Plaque Formation & Complications
Source: Robbins & Kumar Basic Pathology | Robbins, Cotran & Kumar Pathologic Basis of Disease | Basic Medical Biochemistry 6th Ed
1. WHAT IS ATHEROSCLEROSIS?
Atherosclerosis = a chronic inflammatory disease of medium and large arteries characterised by the formation of atheromas (plaques) within the intima of vessel walls, causing stenosis, thrombosis, and end-organ ischaemia.
- It is the leading cause of death in Western countries (responsible for ~half of all deaths)
- Underlies: Coronary artery disease (CAD), Stroke, Peripheral artery disease (PAD), Aortic aneurysm
Key Concept: "Response to Endothelial Injury" Theory
Atherosclerosis is best viewed as the vascular response to endothelial injury. Every step in atherogenesis is triggered by, and amplified by, endothelial dysfunction.
2. RISK FACTORS
Non-Modifiable (Constitutional):
| Factor | Explanation |
|---|---|
| Genetics / Family history | Most important independent risk factor; includes familial hypercholesterolaemia (defective LDL receptors) |
| Age | Clinically silent until middle age; MI risk ↑ 5-fold from age 40-60 |
| Male sex | Pre-menopausal women protected by oestrogen; after menopause, risk equalises or exceeds men |
| Race | Higher rates in certain populations |
Modifiable Risk Factors:
| Factor | Mechanism |
|---|---|
| Hyperlipidaemia (LDL↑, HDL↓) | Most important modifiable RF; LDL accumulates in intima → oxidised → foam cells |
| Hypertension | Mechanical endothelial injury + ↑ Ang II → endothelial dysfunction + SMC proliferation |
| Cigarette smoking | Oxidative damage to endothelium + ↑ CO → hypoxia + ↑ LDL oxidation |
| Diabetes mellitus | Advanced glycation end-products (AGEs) damage endothelium; dyslipidaemia; ↑ oxidative stress |
| Obesity | ↑ LDL, ↑ BP, ↑ insulin resistance, ↑ systemic inflammation |
| Physical inactivity | ↓ HDL, ↑ LDL, ↑ BP, ↑ obesity |
| Inflammation / elevated CRP | Chronic inflammation drives macrophage recruitment and plaque progression |
High-yield exam fact: Three risk factors together (hyperlipidaemia + hypertension + smoking) multiply risk by a factor of 7! Risk factors are roughly multiplicative, not additive.
3. PATHOGENESIS - STEP BY STEP MECHANISM
The Central Concept:
RISK FACTORS
(LDL↑, HTN, Smoking, DM, etc.)
↓
ENDOTHELIAL INJURY / DYSFUNCTION
↓
LDL accumulation in intima + Monocyte recruitment
↓
LDL oxidised → Foam cells formed → Fatty streak
↓
Smooth muscle migration + Fibrosis → Fibrous plaque
↓
Necrosis + Calcification + Inflammation → Advanced/Complicated plaque
Step-by-Step Detail:
STEP 1: Endothelial Injury & Dysfunction
- Risk factors injure or activate the endothelium
- Injured endothelium:
- ↓ Nitric oxide (NO) production → less vasodilation
- ↑ Expression of adhesion molecules (VCAM-1, ICAM-1, P-selectin, E-selectin)
- ↑ Permeability → LDL leaks into intima
- ↑ Procoagulant state (thrombin, PAI-1)
STEP 2: Lipoprotein Accumulation in the Intima
- LDL particles enter the subendothelial space through the damaged endothelium
- LDL is oxidised by oxygen free radicals (generated by macrophages and ECs) → oxidised LDL (ox-LDL)
- ox-LDL is toxic to endothelium and SMCs
- ox-LDL stimulates local release of growth factors, cytokines, and chemokines → amplifies inflammation
STEP 3: Monocyte Recruitment & Foam Cell Formation
- Endothelial adhesion molecules capture circulating monocytes from blood
- Monocytes migrate into the intima (diapedesis) → differentiate into macrophages
- Macrophages ingest ox-LDL via scavenger receptors (not the normal LDL receptor!)
- Unlike normal LDL uptake, scavenger receptors are NOT downregulated → macrophages keep eating LDL
- Macrophages become engorged with lipid → FOAM CELLS
- Accumulation of foam cells → FATTY STREAK (earliest visible lesion)
STEP 4: Smooth Muscle Cell (SMC) Migration & Proliferation
- Growth factors (PDGF, FGF, EGF) released by macrophages, endothelium, and platelets
- SMCs migrate from media → intima
- SMCs undergo phenotypic change - from contractile → synthetic phenotype
- Synthetic SMCs produce collagen, elastin, proteoglycans → building the fibrous cap
STEP 5: Plaque Growth - Fatty Streak → Fibrous Plaque → Advanced Plaque
- Continued lipid accumulation + SMC proliferation + ECM synthesis
- Dead foam cells release lipid → forms the necrotic lipid core
- Fibrous cap of SMCs + collagen forms over the lipid core
- Calcification, neovascularisation, and T-cell infiltration occur in advanced plaques
4. STAGES OF ATHEROSCLEROTIC PLAQUE FORMATION
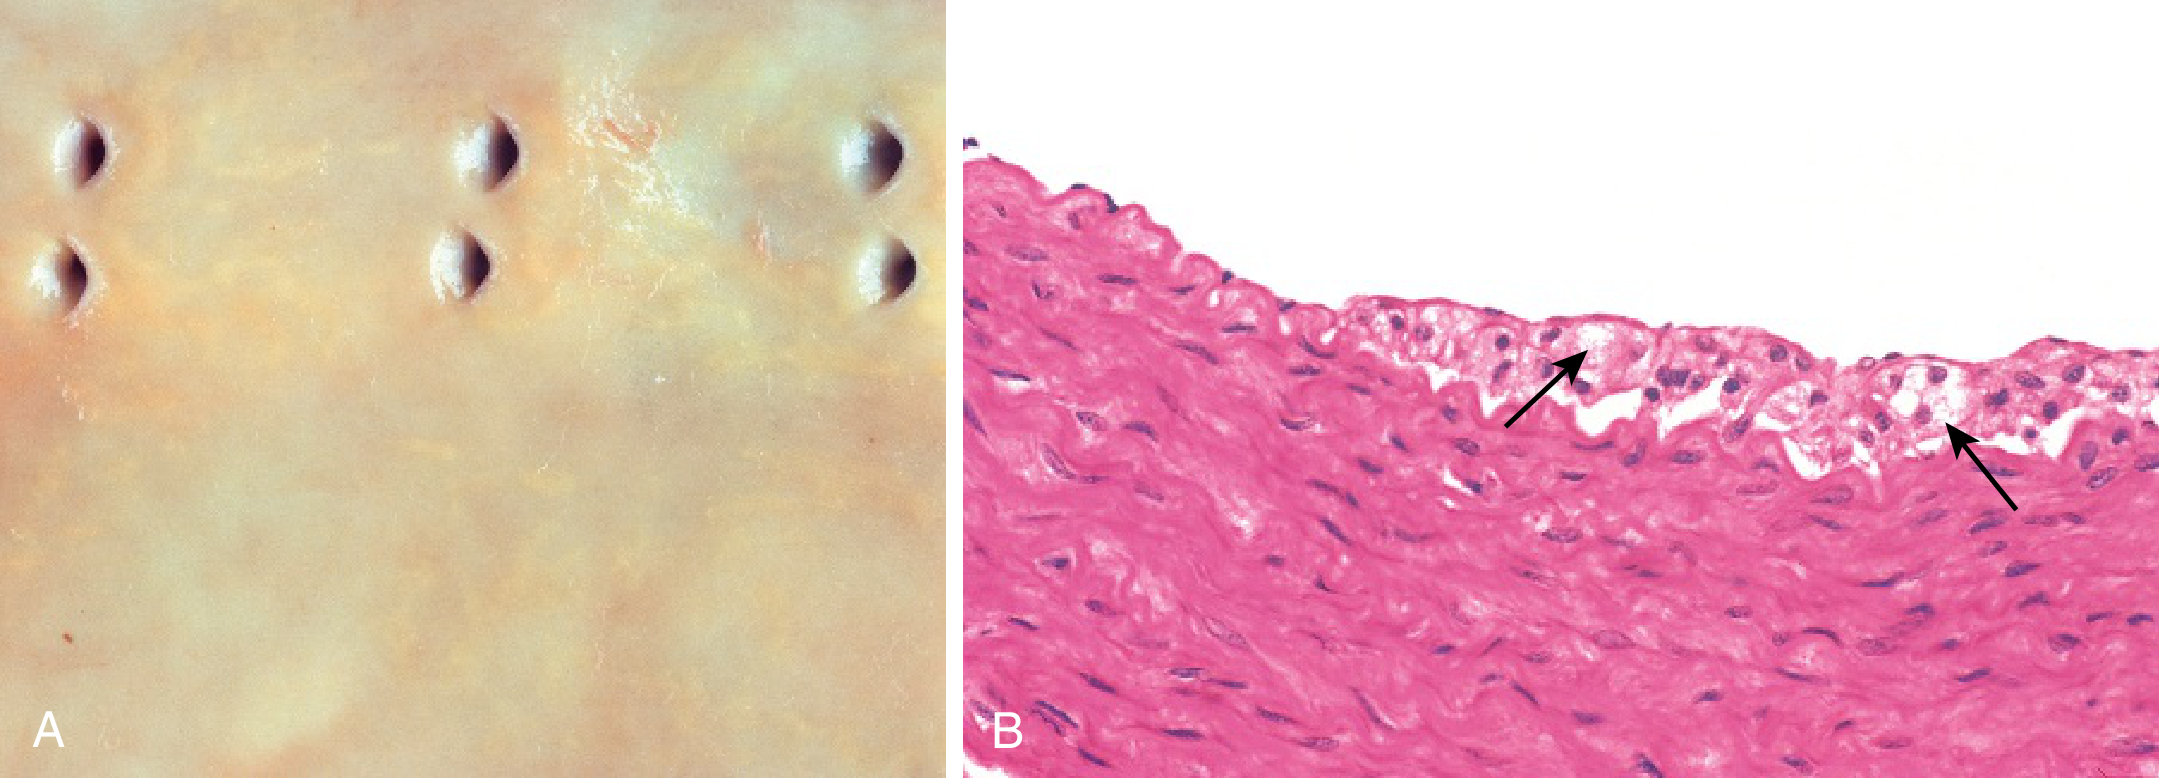
Diagram to Draw:
STAGE 1: NORMAL ARTERY
┌──────────────────────────────────────────┐
│ LUMEN │
│──────── Endothelium (intact)─────────────│
│ Intima (thin, normal) │
│──────── IEM ─────────────────────────────│
│ Media (smooth muscle) │
└──────────────────────────────────────────┘
STAGE 2: FATTY STREAK (earliest lesion - reversible)
┌──────────────────────────────────────────┐
│ LUMEN (not yet narrowed) │
│── Endothelium (dysfunctional) ───────────│
│ Intima: FOAM CELLS (lipid-laden │
│ macrophages) accumulate │
│ Yellow streaks visible on gross exam │
└──────────────────────────────────────────┘
Seen in aorta from age 10 onwards even in healthy children!
STAGE 3: FIBROUS PLAQUE (intermediate)
┌──────────────────────────────────────────┐
│ LUMEN (starting to narrow) │
│── Fibrous cap (SMCs + collagen) ─────────│
│ Intima: foam cells + SMCs + ECM │
│ Necrotic lipid core forming │
│ Macrophages, T cells at "shoulder" │
└──────────────────────────────────────────┘
STAGE 4: ADVANCED / COMPLICATED PLAQUE
┌──────────────────────────────────────────┐
│ LUMEN (significantly narrowed) │
│── Fibrous cap ───────────────────────────│
│ Lipid/necrotic core (cholesterol │
│ crystals, debris, foam cells) │
│ Calcification │
│ Neovascularisation (new vessels) │
│ Thinned media below plaque │
└──────────────────────────────────────────┘
Plaque Components Summary:
| Component | What it Contains |
|---|---|
| Fibrous cap | SMCs + dense collagen (Type I) + ECM |
| Necrotic core | Cholesterol crystals, cholesterol esters, foam cells, necrotic debris, fibrin |
| Shoulder region | Most inflammatory - macrophages, T cells, SMCs (vulnerable to rupture here!) |
| Neovascularisation | New small blood vessels growing into the plaque |
| Calcification | Dystrophic calcification (dead cell calcium deposition) |
5. PLAQUE VULNERABILITY - STABLE vs. VULNERABLE PLAQUE
| Feature | Stable Plaque | Vulnerable (Unstable) Plaque |
|---|---|---|
| Fibrous cap | Thick, strong | Thin, weak |
| Lipid core | Small | Large (>40% of plaque) |
| Inflammation | Low | High - many macrophages at shoulder |
| SMC content | High | Low (macrophages digest collagen) |
| Calcification | Often heavily calcified | Less calcification |
| Risk | Causes stable angina | Rupture → ACS (UA/NSTEMI/STEMI) |
| Lumen narrowing | Often severe (70-90%) | Often moderate (50-70%) - paradox! |
Critical exam concept: A vulnerable plaque may only cause 50-60% stenosis on angiogram, but is more dangerous than a stable plaque causing 80% stenosis - because it can suddenly rupture and cause complete occlusion (100%) by triggering thrombosis!
6. COMPLICATIONS OF ATHEROSCLEROSIS - MASTER TABLE
| Complication | Mechanism | Clinical Result |
|---|---|---|
| Stenosis (ischaemia) | Plaque enlarges → narrows lumen → ↓ blood flow | Stable angina, Claudication, TIA |
| Plaque rupture / fissure | Thin cap tears → exposes thrombogenic lipid core + collagen | ACS (Unstable Angina, NSTEMI, STEMI) |
| Thrombosis | Plaque rupture → platelet aggregation + coagulation cascade | Sudden occlusion → Myocardial infarction, Stroke |
| Embolism | Thrombus fragments break off | Distal embolisation → limb/organ ischaemia |
| Aneurysm formation | Ischaemia of media (vasa vasorum occluded) → media weakens → wall bulges | Aortic aneurysm (especially abdominal) |
| Calcification | Dystrophic calcification of plaque | "Eggshell" coronaries on CT; reduced arterial compliance |
7. VESSELS MOST COMMONLY AFFECTED
Most commonly affected (in order):
1. Abdominal aorta (especially near renal arteries)
2. Coronary arteries (especially proximal LAD)
3. Popliteal arteries
4. Descending thoracic aorta
5. Internal carotid arteries (near bifurcation)
6. Circle of Willis
Arteries usually SPARED:
- Upper limb vessels
- Mesenteric arteries (except at ostia)
- Renal arteries (except at ostia)
8. PHARMACOLOGY LINK - Statins and Antiplatelets
Statins (e.g. Atorvastatin, Rosuvastatin):
HMG-CoA + Acetyl-CoA → Mevalonate → ... → Cholesterol
Statins BLOCK HMG-CoA Reductase
↓
↓ Intracellular cholesterol synthesis
↓
↑ LDL receptors on hepatocytes (upregulated)
↓
↑ LDL uptake from blood → ↓ Blood LDL
↓
Less LDL in intima → less ox-LDL → less foam cell formation
→ Slows plaque progression + may cause regression
Statins also have pleiotropic effects: ↓ Inflammation, ↑ Endothelial NO, ↓ Platelet aggregation, stabilise plaque
Antiplatelets (e.g. Aspirin, Clopidogrel):
| Drug | Mechanism | Use |
|---|---|---|
| Aspirin | Irreversibly blocks COX-1 → ↓ Thromboxane A₂ → ↓ platelet aggregation | All patients with CAD/ACS; 75-100mg/day |
| Clopidogrel | Blocks P2Y12 (ADP receptor) on platelets → ↓ platelet aggregation | ACS, post-PCI stent (dual antiplatelet with aspirin = DAPT) |
| Ticagrelor | Reversible P2Y12 blocker (faster onset than clopidogrel) | ACS (preferred over clopidogrel in NSTEMI/STEMI) |
9. ATHEROSCLEROSIS PROGRESSION FLOWCHART (Draw This!)
RISK FACTORS (LDL↑, HTN, Smoking, DM, Obesity)
↓
ENDOTHELIAL INJURY / DYSFUNCTION
↓ NO production | ↑ Adhesion molecules (VCAM-1, ICAM-1)
↑ Permeability → LDL enters intima
↓
LDL OXIDATION (by macrophage/EC free radicals)
Oxidised LDL → TOXIC + INFLAMMATORY
↓
MONOCYTE ADHESION & RECRUITMENT
(via VCAM-1, MCP-1 chemoattractant)
↓
MONOCYTE → MACROPHAGE differentiation in intima
↓
MACROPHAGE ingests ox-LDL via SCAVENGER RECEPTORS
(NOT downregulated → unrestricted lipid uptake)
↓
FOAM CELLS → accumulate → FATTY STREAK
(visible from age 10, even in healthy children!)
↓
↑ PDGF, FGF, IL-1, TNF released
↓
SMC MIGRATION: Media → Intima
SMC PROLIFERATION + ECM synthesis (collagen, elastin)
↓
FIBROUS PLAQUE (Fibrous cap over growing lipid core)
↓
NECROSIS + CALCIFICATION + Neovascularisation
↓
ADVANCED / COMPLICATED PLAQUE
↓
┌─────────────────────────────────────┐
↓ ↓
STABLE PLAQUE VULNERABLE PLAQUE
(thick cap, small core) (thin cap, large core)
↓ ↓
Chronic ischaemia PLAQUE RUPTURE
(Stable angina, PAD) ↓
Thrombus formation
↓
ACS (UA / NSTEMI / STEMI)
Stroke / Limb ischaemia
10. KEY FACTS FOR MCQs
| Question | Answer |
|---|---|
| Atherosclerosis = response to? | Endothelial injury |
| Earliest visible lesion of atherosclerosis? | Fatty streak |
| Foam cells are derived from? | Lipid-laden macrophages (monocyte origin) |
| Which receptor do macrophages use to ingest ox-LDL? | Scavenger receptor (NOT LDL receptor) |
| Most dangerous area of a plaque anatomically? | Shoulder region (most macrophages, thinnest cap) |
| What makes a plaque "vulnerable"? | Thin fibrous cap + large lipid core + high inflammation |
| Three risk factors that multiply risk × 7? | Hyperlipidaemia + Hypertension + Smoking |
| Most common site of atherosclerosis? | Abdominal aorta |
| Statins work by blocking which enzyme? | HMG-CoA reductase |
| Aspirin mechanism in atherosclerosis? | Blocks COX-1 → ↓ TXA₂ → ↓ platelet aggregation |
| Clopidogrel blocks which receptor? | P2Y12 (ADP receptor) on platelets |
| Cholesterol clefts in plaque are seen where? | Necrotic core (cholesterol crystals washed out in processing) |
| Fatty streaks seen in which age group? | From age 10 onwards - even in normal children! |
| Complication of atherosclerosis in abdominal aorta? | Aortic aneurysm |
| What is DAPT? | Dual antiplatelet therapy = Aspirin + Clopidogrel/Ticagrelor |
11. SELF-TEST (Do Before Day 9)
- Draw the atherosclerosis progression flowchart from memory - from risk factor → fatty streak → ACS
- What is the difference between a stable plaque and a vulnerable plaque? Which is more dangerous and why?
- A patient with familial hypercholesterolaemia has an MI at age 22. Which genetic defect is responsible?
- Why do macrophages keep ingesting LDL even when they are already full of lipid?
- Name the 3 principal components of an advanced atheromatous plaque
- Why does Aspirin help in ACS? What is its specific biochemical mechanism?
Day 9
Raynaud phenomenon triphasic color change fingers white blue red
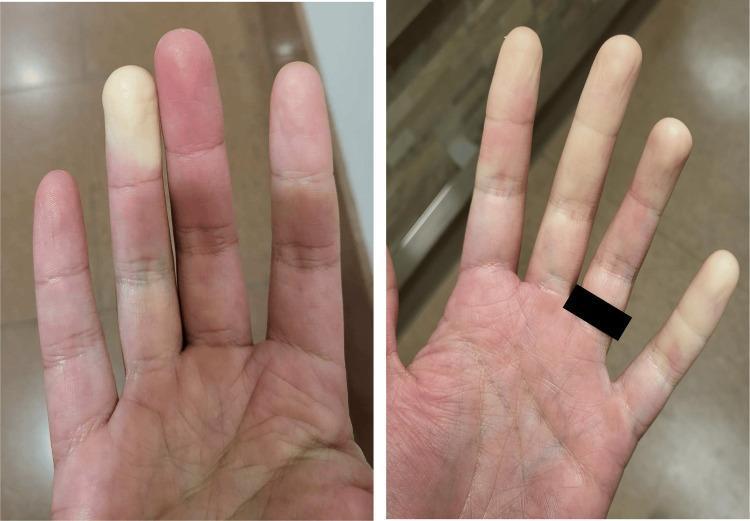
Clinical photograph of a patient's hands demonstrating the characteristic triphasic color changes associated with Raynaud’s phenomenon. The left image shows significant pallor (white phase) in the index finger, representing digital vasospasm and ischemia, contrasted against the erythema (red phase) of the adjacent middle finger, suggesting reperfusion. The right image shows more diffuse, patchy pallor across several digits including the index and ring fingers. These visual findings are hallmark clinical signs of Raynaud’s phenomenon, which may occur as a primary condition or secondary to autoimmune connective tissue diseases. In this clinical context, the findings are associated with a patient positive for anti-centromere antibodies and diagnosed with an autoimmune hepatitis (AIH) and primary biliary cholangitis (PBC) overlap syndrome. The image serves as an educational example of episodic vasospastic disorders and their physical manifestations in the distal extremities.
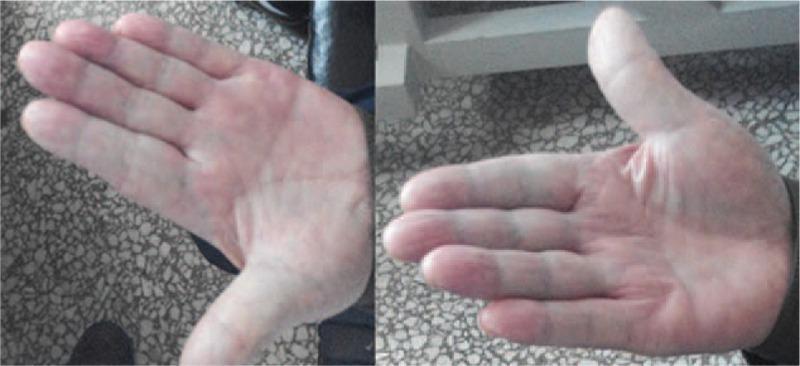
Clinical photograph showing two views of a patient's hands (palmar aspect) exhibiting the classic triphasic color changes associated with Raynaud's phenomenon. The image demonstrates a mottled appearance characterized by distinct zones of pallor (ischemic white), cyanosis (deoxygenated blue/purple), and reactive hyperemia (erythematous red). These vascular changes are most prominent across the digits and distal palmar surfaces. The skin texture appears intact without visible digital ulcers, gangrene, or sclerodactyly. In the clinical context of lung adenocarcinoma, these findings are representative of paraneoplastic Raynaud's phenomenon, a secondary form of the condition. This visual serves as an educational example of peripheral vasospastic disorders and their manifestations in systemic malignancy. The image highlights the importance of assessing hand coloration as a diagnostic indicator of underlying microvascular dysfunction.
Day 9
Raynaud phenomenon triphasic color change fingers white blue red vasospasm
Clinical photograph of a patient's hands demonstrating the characteristic triphasic color changes associated with Raynaud’s phenomenon. The left image shows significant pallor (white phase) in the index finger, representing digital vasospasm and ischemia, contrasted against the erythema (red phase) of the adjacent middle finger, suggesting reperfusion. The right image shows more diffuse, patchy pallor across several digits including the index and ring fingers. These visual findings are hallmark clinical signs of Raynaud’s phenomenon, which may occur as a primary condition or secondary to autoimmune connective tissue diseases. In this clinical context, the findings are associated with a patient positive for anti-centromere antibodies and diagnosed with an autoimmune hepatitis (AIH) and primary biliary cholangitis (PBC) overlap syndrome. The image serves as an educational example of episodic vasospastic disorders and their physical manifestations in the distal extremities.
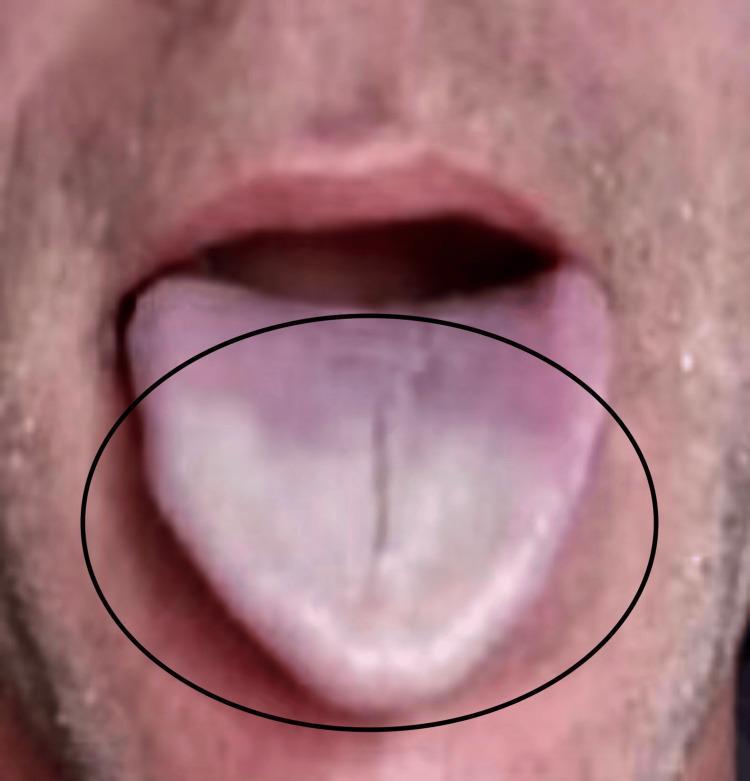
This clinical photograph displays a patient's protruding tongue, highlighting a rare intraoral manifestation of Raynaud's phenomenon. The image captures a sharp demarcation of color change: the distal one-third (the tip and lateral margins) exhibits a pale, blanching white appearance indicative of vasospastic ischemia. In contrast, the proximal portion of the tongue shows a dusky, purplish-blue cyanotic hue. The surface morphology is relatively smooth with a prominent midline longitudinal fissure visible within the ischemic zone. This visual demonstrates the classic triphasic or biphasic color changes associated with vasospasm—pallor followed by cyanosis—applied here to the lingual vasculature. This educational resource is highly relevant for rheumatology and internal medicine, illustrating that Raynaud's phenomenon can occur in atypical anatomical locations beyond the digits, often triggered by cold exposure or emotional stress.
📘 WEEK 2 - DAY 9
Raynaud's Disease & Phenomenon: Pathophysiology, Primary vs. Secondary, Clinical Features & Management
Sources: Robbins & Kumar Basic Pathology | Goldman-Cecil Medicine | Andrews' Diseases of the Skin | Fitzpatrick's Dermatology | Miller's Review of Orthopaedics
1. OVERVIEW & DEFINITIONS
Think of it as: the blood vessels in your fingers "overreact" to cold and clamp shut completely, instead of just narrowing a little.
Two Types - Key Distinction:
| Primary (Raynaud's Disease) | Secondary (Raynaud's Phenomenon) | |
|---|---|---|
| Underlying cause | None - idiopathic vasospasm | Caused by another disease |
| Also called | Raynaud's Disease | Raynaud's Phenomenon |
| Severity | Benign, reversible | More severe, progressive |
| Tissue damage | Rare (gangrene <1%) | Ulcers, necrosis, gangrene common |
| Common in | Young women <40 yrs | Any age, any sex (but still female predominant) |
2. CLINICAL PHOTOGRAPH - Raynaud's Phenomenon
3. TRIPHASIC COLOUR CHANGE (Draw This!)
TRIGGER: Cold exposure / Emotional stress
↓
┌─────────────────────────────────────────────────────────────────┐
│ PHASE 1: WHITE (Pallor) │
│ Vasospasm → complete arterial constriction │
│ Blood flow = near zero → digits turn WHITE │
│ Ischaemia → cold, numb, "dead" fingers │
│ Mechanism: ↑ Sympathetic tone → α₂-adrenoceptor activation │
│ → smooth muscle contraction │
├─────────────────────────────────────────────────────────────────┤
│ PHASE 2: BLUE (Cyanosis) │
│ Arterial vasospasm persists + postcapillary venular │
│ constriction → stagnant blood → deoxygenation │
│ Digits turn BLUE/PURPLE │
│ Pain and paraesthesias develop │
├─────────────────────────────────────────────────────────────────┤
│ PHASE 3: RED (Rubor/Reactive Hyperaemia) │
│ Vasospasm releases (on rewarming) │
│ Sudden rush of oxygenated blood → vasodilation │
│ Digits turn RED (hyperaemic) │
│ Throbbing pain, tingling, burning sensation │
└─────────────────────────────────────────────────────────────────┘
Exam note: All 3 phases are NOT always seen - pallor (white) alone may be the only finding. The thumb is often SPARED.
4. PATHOPHYSIOLOGY
A. Vascular Wall Abnormality
- Small digital arteries have structural abnormalities in secondary RP (intimal thickening, fibrosis)
- Imbalance between vasoconstrictors and vasodilators:
- ↑ Endothelin-1 (ET-1) - potent vasoconstrictor (elevated especially in scleroderma-associated RP)
- ↓ Nitric oxide (NO) - vasodilator
- ↑ Thromboxane A₂ - vasoconstrictor + platelet aggregator
- ↓ Prostacyclin (PGI₂) - vasodilator
B. Neural Control Abnormality
- Exaggerated sympathetic response to cold (central + peripheral)
- Overactivation of α₂-adrenoceptors on vascular smooth muscle → intense vasoconstriction
- Cold directly upregulates α₂C-adrenoceptors (moved to cell surface by cold)
- Emotional stress activates sympathetic nervous system → triggers attacks even without cold
C. Intravascular Factors
- Platelet activation → release of TXA₂, serotonin → further vasoconstriction
- Oxidative stress → ↓ NO bioavailability
- Elevated homocysteine (detected in both primary and secondary RP)
Simplified Mechanism:
TRIGGER (Cold / Stress)
↓
↑ Sympathetic nervous system activity
↓
α₂-adrenoceptor activation on digital artery smooth muscle
↓
↑ [Ca²⁺] inside vascular smooth muscle cells
↓
Smooth muscle CONTRACTION → Digital artery VASOSPASM
↓
↓ Blood flow → Ischaemia
↓
WHITE → BLUE → RED (on rewarming)
5. PRIMARY RAYNAUD'S DISEASE - Detailed Features
| Feature | Detail |
|---|---|
| Prevalence | 3-5% general population; up to 5-15% in young women |
| Typical patient | Young woman <40 years |
| Distribution | Bilateral and symmetric |
| Digits most affected | Middle and ring fingers; thumb usually spared |
| Gangrene/ulcers | Rare (<1%) |
| Capillaroscopy | Normal nailfold capillaries |
| Autoantibodies (ANA) | Negative or very low titre (≤1:40) |
| Prognosis | Benign; stable over years |
| Family history | 30-50% have first-degree relative with same condition |
| Diagnosis | Exclusion - no associated disease found |
Diagnostic Criteria for Primary Raynaud's Disease:
- Episodic vasospasm with triphasic colour change
- Bilateral involvement
- Normal nailfold capillaroscopy
- Negative/low-titre ANA
- No features of connective tissue disease (no sclerodactyly, no calcinosis, no ulcers)
- No underlying cause identified
6. SECONDARY RAYNAUD'S PHENOMENON - Causes
Causes (By Category):
SECONDARY RAYNAUD'S PHENOMENON
├── RHEUMATOLOGIC (most common cause overall)
│ ├── Systemic Sclerosis/Scleroderma ← MOST COMMON (>50% of cases)
│ ├── Systemic Lupus Erythematosus (SLE)
│ ├── Rheumatoid Arthritis
│ ├── Sjögren's Syndrome
│ └── Mixed Connective Tissue Disease (MCTD)
│
├── OBSTRUCTIVE ARTERIAL DISEASE
│ ├── Atherosclerosis
│ ├── Thromboangiitis Obliterans (Buerger's disease)
│ └── Arterial embolism
│
├── OCCUPATIONAL / ENVIRONMENTAL
│ ├── Hand-arm vibration syndrome (jackhammer workers, miners)
│ ├── Hypothenar hammer syndrome
│ └── Frostbite (previous cold injury)
│
├── DRUGS
│ ├── β-blockers ← common culprit in cardiac patients!
│ ├── Ergotamines
│ ├── Cocaine, Amphetamines
│ ├── Clonidine
│ └── Oral contraceptives
│
├── ENDOCRINE
│ └── Hypothyroidism
│
└── HAEMATOLOGIC
├── Polycythaemia vera
├── Cryoglobulinaemia
└── Cold agglutinins
Exam high-yield: β-blockers (used in hypertension, heart failure, and post-MI) can cause or worsen Raynaud's phenomenon. A cardiac tech must know this!
7. PRIMARY vs. SECONDARY - COMPARISON TABLE
| Clinical Feature | Primary (Disease) | Secondary (Phenomenon) |
|---|---|---|
| Sex | Female predominant | Female or male |
| Age of onset | <40 years | ≥40 years (or any age) |
| Sides affected | Bilateral | Unilateral or bilateral |
| Ischaemic ulcers/gangrene | Absent (rare) | Present - common |
| Underlying disease | None | Present |
| Systemic symptoms | Absent | Often present |
| Capillaroscopy | Normal | Abnormal (dilated, tortuous capillaries; "skip" areas) |
| ANA | Negative | Often positive |
| Blood chemistry | Normal | Often abnormal |
| Progression | Stable | Progressive |
| Allen test | Normal | May be abnormal |
8. DIAGNOSIS
Key Investigations:
| Test | Purpose |
|---|---|
| Nailfold capillaroscopy | Gold standard to distinguish primary vs. secondary; abnormal in scleroderma (giant capillaries, avascular areas) |
| ANA (antinuclear antibody) | If positive → suggests underlying CTD |
| Anti-centromere antibody | Associated with limited scleroderma (CREST syndrome) |
| Anti-Scl-70 (anti-topoisomerase-1) | Associated with diffuse scleroderma |
| FBC, ESR, CRP | Baseline; elevated in secondary causes |
| TFTs (thyroid function tests) | Rule out hypothyroidism |
| Serum protein electrophoresis | Rule out myeloma, cryoglobulinaemia |
| Doppler ultrasound / Laser Doppler | Assess digital blood flow |
| Digital thermography | Skin temperature measurement; aids early diagnosis |
9. MANAGEMENT
Non-Pharmacological (First Step for All Patients):
LIFESTYLE MODIFICATIONS (applies to BOTH Primary and Secondary RP)
1. AVOID COLD EXPOSURE
- Wear warm gloves, socks, layers
- Avoid cold drinks/foods
- Keep core body temperature warm (vasospasm can be triggered
by OVERALL body cooling, not just local cold!)
2. STOP SMOKING (absolutely contraindicated)
- Nicotine is a powerful vasoconstrictor
3. AVOID EMOTIONAL STRESS
- Relaxation techniques, biofeedback
4. AVOID TRIGGERING DRUGS
- Stop β-blockers if possible; switch to CCBs or ARBs
- Avoid ergotamines, cocaine
5. TRAUMA AVOIDANCE
- Protect fingertips
6. "WINDMILL" MANOEUVRE
- Swing arm in a wide circle from shoulder during an attack
- Centrifugal force drives blood into the fingers
Pharmacological Treatment (Step Ladder):
| Step | Drug | Mechanism | Notes |
|---|---|---|---|
| 1st Line | Nifedipine (CCB) - extended release | Blocks L-type Ca²⁺ channels in VSM → ↓ [Ca²⁺] → vasodilation | ~2/3 of patients respond; reduces attacks by ~1.7/week vs. placebo |
| 1st Line | Amlodipine (CCB) - prolonged release | Same as nifedipine; longer half-life | Often preferred for once-daily dosing |
| 2nd Line | Sildenafil / Tadalafil (PDE-5 inhibitors) | Block PDE-5 → ↑ cGMP → smooth muscle relaxation → vasodilation | Reduces attack frequency and severity; aids digital ulcer healing |
| 2nd Line | Losartan (ARB) | Blocks AT₁ receptor → ↓ vasoconstriction | Shown to be MORE effective than nifedipine in one RCT |
| 3rd Line | Bosentan (endothelin receptor antagonist) | Blocks ET-1 (ETA + ETB receptors) → prevents ET-1-driven vasoconstriction | Especially for scleroderma-associated RP; reduces new digital ulcers |
| 3rd Line | Iloprost (IV prostacyclin analogue) | Mimics PGI₂ → potent vasodilation + ↓ platelet aggregation | For severe scleroderma-associated RP; only slightly better than nifedipine but more expensive |
| Adjunct | SSRIs (Fluoxetine) | Reduce sympathetic overactivation; some antiplatelet effects | For refractory cases |
| NOT recommended | ACE inhibitors | Failed to show benefit in RCTs | Do not use |
| NOT recommended | Standard topical nitroglycerine | Minimal efficacy, systemic side effects | Topical MQX-503 form shows some promise in RCTs |
Cardiac tech exam link: Know why CCBs work here - the same mechanism (Ca²⁺ channel blockade on smooth muscle) used in hypertension and angina also relieves vasospasm in Raynaud's!
Surgical Options (Refractory Cases):
| Procedure | Indication | Notes |
|---|---|---|
| Botulinum toxin injection (digital sympathectomy equivalent) | Severe refractory RP with digital ulcers | Inject around neurovascular bundle in palm; 75-100% improvement; lasts months-years |
| Local digital sympathectomy | Chronic ulcerated digits | Avoids amputation; effective |
| Cervical / thoracic sympathectomy | Severe, generalised RP | Initial good relief, but symptoms often recur after 12-18 months; digital ulcers still greatly reduced; compensatory hyperhidrosis is a common side effect |
| Fat grafting | Pilot data; severe RP | Fat transferred to hand; limited evidence |
10. RAYNAUD'S + SCLERODERMA (Special Connection)
Raynaud's phenomenon is the most common first symptom of scleroderma (systemic sclerosis) - occurring in >90% of SSc patients!
SCLERODERMA + RAYNAUD'S
↓
↑ Endothelin-1 → sustained vasospasm + vessel wall fibrosis
↓
Structural damage: intimal thickening, fibrosis of digital vessels
↓
Persistent ischaemia (not just episodic)
↓
Digital ulcers → pitted scars → gangrene
↓
"Sclerodactyly" = tight, shiny, thinned skin of fingers
Nail capillaroscopy: Giant dilated loops + avascular "skip" areas
11. PATHOPHYSIOLOGY SUMMARY FLOWCHART (Exam Drawing)
COLD / EMOTIONAL STRESS
↓
↑ Sympathetic nervous system
↓
α₂-adrenoceptor activation
↑ Endothelin-1 ↑ Thromboxane A₂
↓ Nitric Oxide ↓ Prostacyclin
↓
DIGITAL ARTERY VASOSPASM
↓
┌──────────────────────────────┐
│ PRIMARY RP │ │ SECONDARY RP │
│ - Young woman │ │ - Older / any sex │
│ - Functional vasospasm │ │ - Structural vessel damage │
│ - Reversible, benign │ │ - Progressive, ulcers │
│ - Normal capillaroscopy │ │ - Abnormal capillaroscopy │
└──────────────────────────────┘ └──────────────────────────────┘
↓
TRIPHASIC COLOUR CHANGE
White → Blue → Red
↓
MANAGEMENT LADDER:
Lifestyle → CCBs → PDE-5i / ARBs → Bosentan / Iloprost → Surgery
12. KEY FACTS FOR MCQs
| Question | Answer |
|---|---|
| Raynaud's phenomenon = response to? | Cold exposure and/or emotional stress |
| Triphasic colour change sequence? | White → Blue → Red (Pallor → Cyanosis → Rubor) |
| Which phase is due to vasospasm? | White (pallor) phase |
| Which phase is due to deoxygenation of stagnant blood? | Blue (cyanosis) phase |
| Which phase is reactive hyperaemia? | Red (rubor) phase |
| Which finger is often SPARED? | The thumb |
| Most common cause of secondary RP? | Scleroderma (systemic sclerosis) |
| RP is the presenting feature of which disease in >90% of cases? | Systemic sclerosis (scleroderma) |
| First-line drug treatment? | Calcium channel blockers (Nifedipine / Amlodipine) |
| Mechanism of CCBs in Raynaud's? | Block Ca²⁺ channels → ↓ VSM contraction → vasodilation |
| Second-line drug? | Sildenafil (PDE-5 inhibitor) or Losartan (ARB) |
| Drug to AVOID in Raynaud's? | β-blockers (cause/worsen vasospasm) |
| ACE inhibitors in Raynaud's? | NOT recommended (failed in RCTs) |
| Drug used for scleroderma-RP to reduce new digital ulcers? | Bosentan (endothelin receptor antagonist) |
| Gold standard test to distinguish primary from secondary RP? | Nailfold capillaroscopy |
| "Windmill manoeuvre" is? | Swinging arm in circle from shoulder to drive blood into fingers during an attack |
| Complication of thoracic sympathectomy? | Compensatory hyperhidrosis |
13. SELF-TEST (Do Before Day 10)
- Draw the triphasic colour change flowchart with the mechanism at each phase
- A 25-year-old woman presents with bilateral cold-triggered white-then-blue-then-red finger discolouration. ANA is negative, capillaroscopy is normal. What is your diagnosis and first treatment choice?
- A 52-year-old woman with scleroderma develops severe Raynaud's with digital ulcers not responding to nifedipine. What two second-line agents would you consider?
- A cardiac patient on metoprolol complains of new onset cold-triggered finger colour changes. What is the likely cause and what drug change would you suggest?
- What is the structural difference between primary and secondary Raynaud's at the level of the blood vessel?
- Name five secondary causes of Raynaud's phenomenon
Day 10
aortic dissection Stanford DeBakey classification type A type B diagram
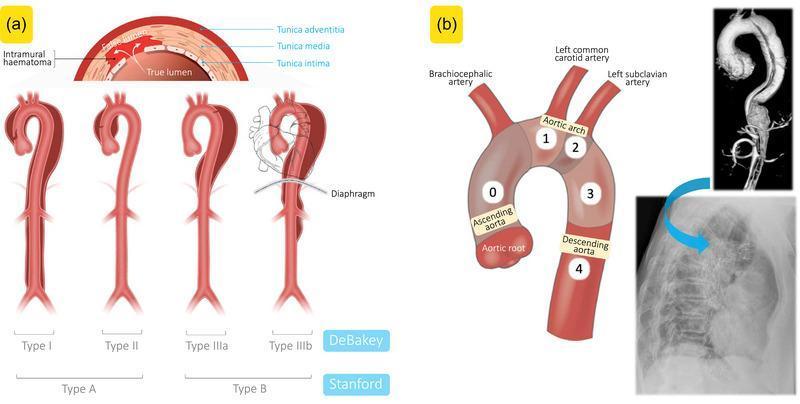
Educational medical composite illustrating the classification and diagnostic imaging of aortic dissections. Panel (a) presents a pathophysiology diagram showing an intimal tear and the formation of true and false lumens, alongside the DeBakey and Stanford classification systems. DeBakey Type I involves the ascending aorta, arch, and descending aorta; Type II is confined to the ascending aorta (both Stanford Type A). Type IIIa is limited to the descending thoracic aorta above the diaphragm, while Type IIIb extends below the diaphragm (both Stanford Type B). Panel (b) features an anatomical diagram of the aortic arch divided into surgical zones 0-4, identifying the brachiocephalic, left common carotid, and left subclavian arteries. Included diagnostic images show a 3D magnetic resonance angiography (MRA) reconstruction of a Type B aortic dissection and a corresponding lateral chest X-ray illustrating endovascular repair with a stent graft. This resource is designed for cardiovascular medical education, specifically for teaching the anatomical extent and management triage of acute aortic syndromes.
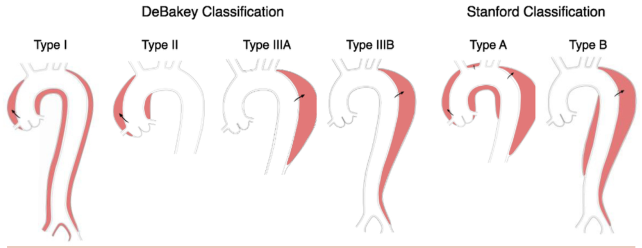
Summary : This illustration compares the DeBakey and Stanford classification systems for aortic dissection, showing the anatomical extent of each type using schematic diagrams of the aorta. illustration: # DeBakey Classification : • Type I: Dissection originates in the ascending aorta and extends beyond the aortic arch, often into the descending aorta. • Type II: Dissection is confined to the ascending aorta only. • Type IIIA: Dissection originates in the descending aorta and is limited to the thoracic aorta above the diaphragm. • Type IIIB: Dissection originates in the descending aorta and extends below the diaphragm. # Stanford Classification : • Type A: Involves the ascending aorta, regardless of the site of origin; includes DeBakey Types I and II. • Type B: Involves only the descending aorta, without involvement of the ascending aorta; includes DeBakey Type III. # Visual Encodings : • Red shading highlights the affected segments of the aorta for each classification type. • Black arrows indicate the origin or extent of the dissection in each schematic. • The aorta is depicted as a simplified white tube with major branches at the top. # Layout : • DeBakey types (I, II, IIIA, IIIB) are shown in sequence from left to right, followed by Stanford types (A, B) on the right. • Each type is labeled above its corresponding schematic. # Analysis : • The DeBakey system subdivides dissections based on both origin and extent, while the Stanford system groups them by involvement of the ascending aorta. • Stanford Type A encompasses more anatomical territory (all cases with ascending aorta involvement), while Type B is restricted to the descending aorta. • The visual comparison clarifies how DeBakey Types I and II map to Stanford Type A, and DeBakey Type III maps to Stanford Type B.
📘 WEEK 2 - DAY 10
Aneurysms: Types, Pathogenesis, Clinical Features & Management
Sources: Robbins & Kumar Basic Pathology | Goldman-Cecil Medicine | S Das Manual of Clinical Surgery 13th Ed | Robbins, Cotran & Kumar Pathologic Basis of Disease
1. DEFINITION
Aneurysm = A localised, abnormal permanent dilation of a blood vessel (or the heart) caused by weakening of the vessel wall.
- From Greek: aneurysma = "a widening"
- Key concept: the wall is structurally weakened - the vessel cannot withstand normal blood pressure
2. CLASSIFICATION OF ANEURYSMS
By Wall Structure - The Most Important Distinction:
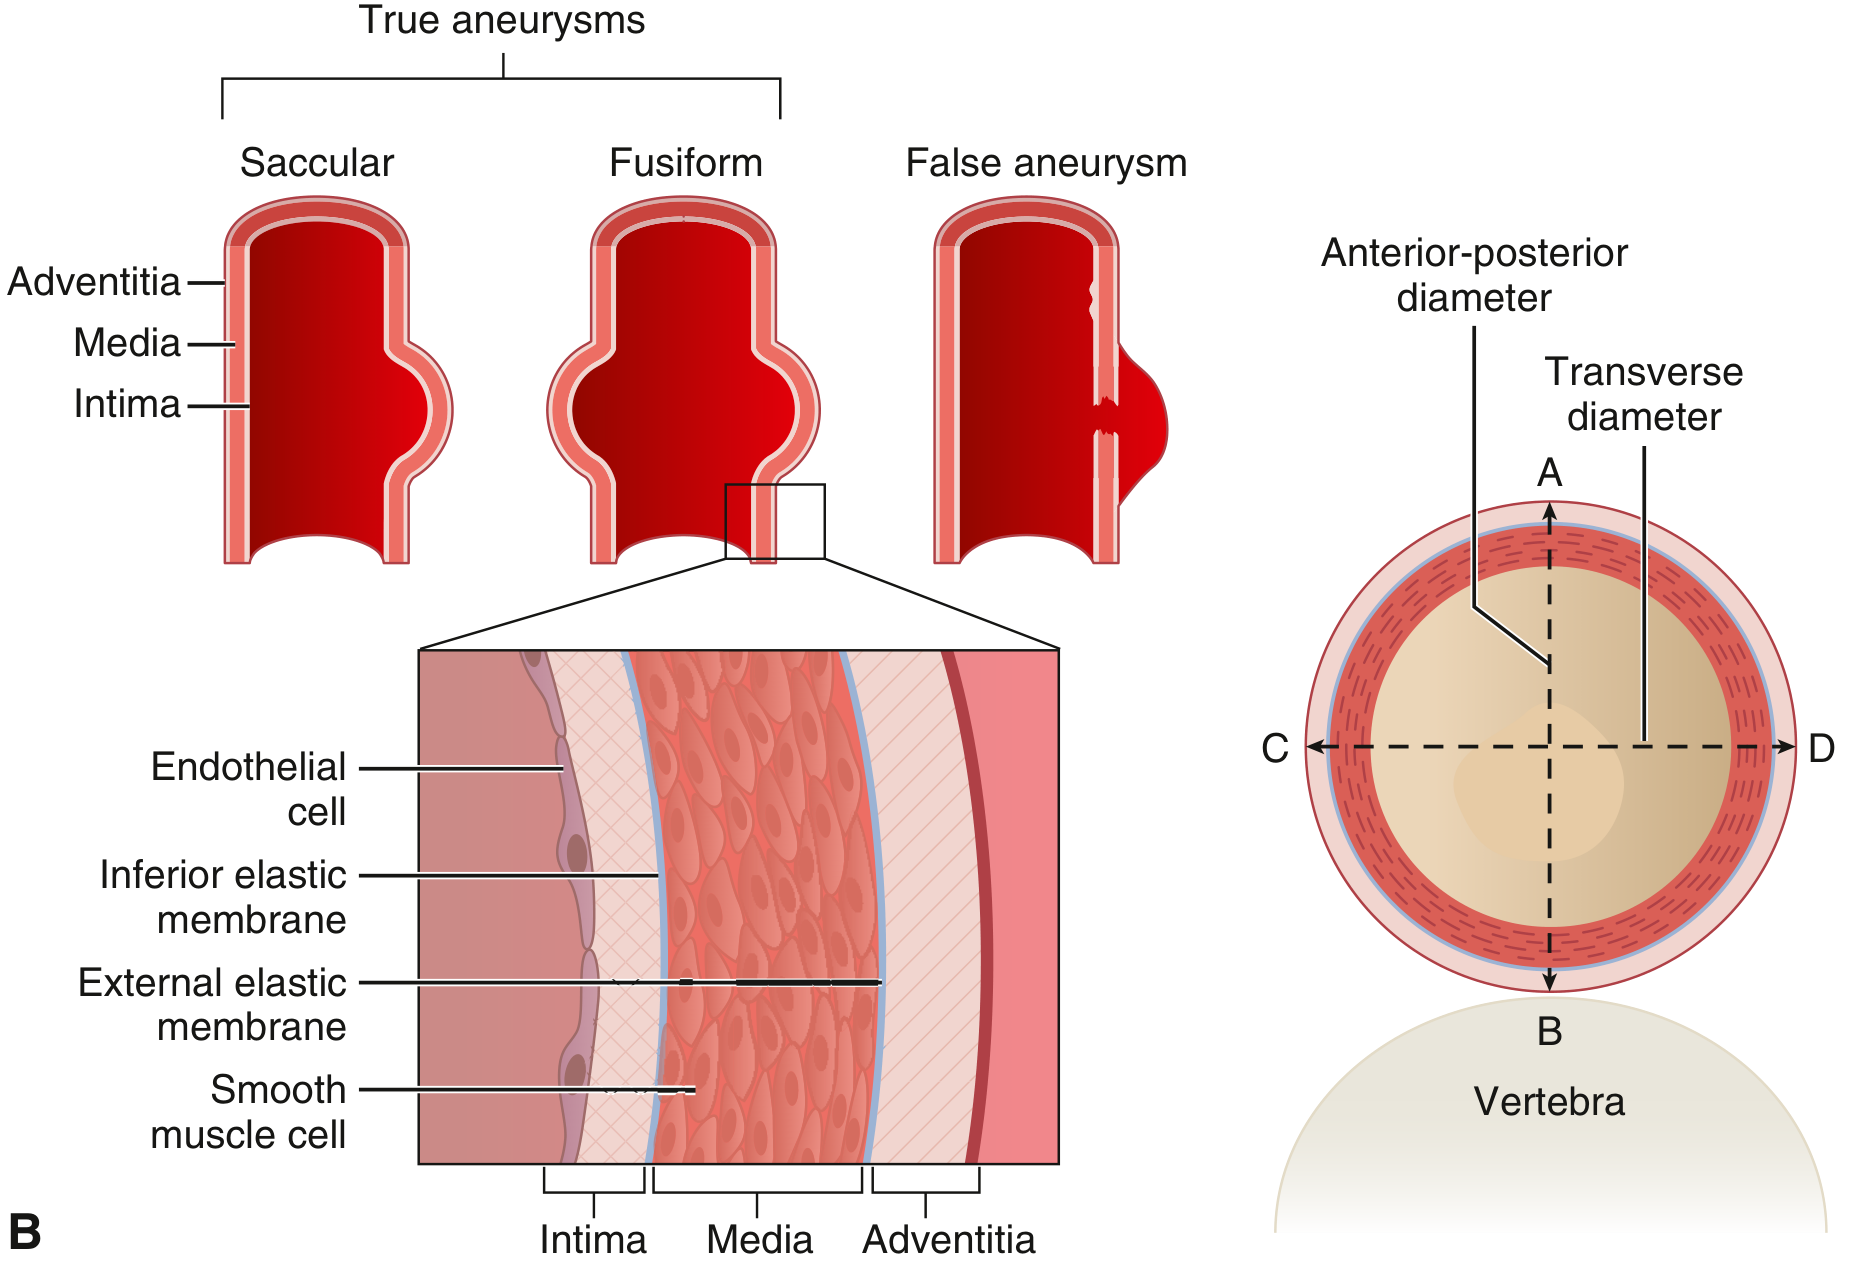
ALL ANEURYSMS
│
├── TRUE ANEURYSM
│ Definition: ALL three vessel wall layers (intima + media + adventitia)
│ are intact but DILATED / attenuated
│ ├── Fusiform
│ ├── Saccular
│ └── Dissecting (special type - see below)
│
└── FALSE ANEURYSM (Pseudoaneurysm)
Definition: DEFECT in vessel wall → blood leaks out
→ contained by ONLY a single layer of fibrous/connective tissue
(NOT the vessel wall itself)
Examples: post-catheterisation femoral pseudoaneurysm,
ventricular rupture contained by pericardium
By Shape:
| Type | Description | Location | Cause |
|---|---|---|---|
| Fusiform | Circumferential, symmetric dilation of the entire vessel circumference | Aortic arch, abdominal aorta, iliac arteries | Atherosclerosis, hypertension |
| Saccular | Discrete outpouching of PART of the circumference, like a berry | Cerebral arteries (Circle of Willis), aorta | Congenital weakness (Berry), trauma, infection |
| Dissecting | Blood forces through intimal tear → tracks within media layers, creating a false channel | Thoracic aorta, ascending aorta | Hypertension, Marfan syndrome, cystic medial degeneration |
3. PATHOGENESIS - WHY DO ANEURYSMS FORM?
Core Concept:
Aneurysms form when the structural integrity of the aortic media is compromised - specifically, when there is an imbalance between synthesis and degradation of extracellular matrix (ECM).
Three Key Mechanisms:
MECHANISM 1: ↑ ECM DEGRADATION (MMP overactivity)
─────────────────────────────────────────────────
Atherosclerosis + Inflammation in vessel wall
↓
↑ Matrix metalloproteinases (MMP-1, 3, 9, 13) from macrophages
↓
Degrade elastin and collagen (structural proteins of media)
↓
↓ Tensile strength of aortic wall
↓
ANEURYSM
MECHANISM 2: ↓ ECM SYNTHESIS (Connective tissue defects)
─────────────────────────────────────────────────────────
Genetic disorders: Marfan syndrome → defective FIBRILLIN-1
→ ↑ TGF-β bioavailability in aortic wall
→ Progressive loss of elastin/collagen
→ Cystic medial degeneration
→ ANEURYSM
Ehlers-Danlos syndrome → defective COLLAGEN (Type III)
→ Vessel wall fragile
→ ANEURYSM
MECHANISM 3: SMC LOSS (Media ischaemia)
────────────────────────────────────────
Atherosclerosis/HTN → ischaemia of vasa vasorum
↓
↓ Blood supply to outer 2/3 of media
↓
SMC apoptosis/dropout → replaced by amorphous proteoglycans
= CYSTIC MEDIAL DEGENERATION (histological term)
↓
↓ Elastic tissue → ↓ wall strength → ANEURYSM
4. RISK FACTORS FOR ANEURYSMS
| Risk Factor | Relevance |
|---|---|
| Atherosclerosis | Dominant cause of AAA; intimal thickening causes media ischaemia + MMPs |
| Hypertension | Causes vasa vasorum narrowing → media ischaemia; also ↑ mechanical wall stress; dominant in ascending aortic aneurysm |
| Cigarette smoking | ↑ AAA risk by 2.7x overall; large AAAs by 5.6x; still elevated 2.5x higher in current vs. former smokers |
| Family history | 3-5x increased risk with first-degree relative with AAA; polygenic |
| Male sex | AAA prevalence significantly higher in men |
| Age >60 | Prevalence 6% at 55-64 yrs → 18.5% at 75-84 yrs |
| Marfan syndrome | Fibrillin-1 mutation → cystic medial degeneration → ascending thoracic aneurysm |
| Ehlers-Danlos syndrome (Type IV) | Collagen III defect → arterial fragility |
| Tertiary syphilis | Obliterative endarteritis of vasa vasorum → aortic arch aneurysm |
| Bicuspid aortic valve | Associated with thoracic aortic aneurysm |
| Trauma | False aneurysm (pseudoaneurysm) |
| Infection | Mycotic aneurysm (from infective endocarditis emboli) |
5. ABDOMINAL AORTIC ANEURYSM (AAA) - IN DEPTH
Definition and Location:
- Dilation of the abdominal aorta >3 cm (normal = ~2 cm)
- Almost always located between the renal arteries and the aortic bifurcation
- Most common and most clinically important aneurysm type
Pathology:
- Extensive atherosclerosis of the aortic wall with thinning of the media
- Lumen contains laminated, layered mural thrombus (poorly organised)
- Often accompanied by iliac artery aneurysms
- Can be saccular or fusiform; up to 15 cm diameter, 25 cm length
Clinical Features:
ASYMPTOMATIC (most common) ← found incidentally on USS / CT / exam
↓
SYMPTOMATIC (as enlarges):
- Pulsatile mass in the periumbilical area
- Dull aching abdominal / lower back / flank pain
- Sciatica (pressure on nerves)
- Compression of ureters (hydronephrosis) / bowel (constipation)
↓
LEAKING/RUPTURE (EMERGENCY):
- Sudden severe back/flank/abdominal pain
- Hypotension → haemorrhagic shock
- Pulsatile abdominal mass (often palpable)
- TRIAD: Abdominal/back pain + Hypotension + Pulsatile mass
→ RUPTURED AAA until proven otherwise!
Size and Management Thresholds:
| Diameter | Risk of Rupture | Action |
|---|---|---|
| <4 cm | Very low - almost never ruptures | Surveillance USS every 2-3 years |
| 4.0-5.4 cm | Moderate | Surveillance USS every 6-12 months + risk factor control |
| ≥5.5 cm | High risk | Elective surgical repair (EVAR or open) |
| Any size, symptomatic/rupturing | Catastrophic | Emergency repair |
Elective vs Emergency mortality: Elective repair mortality ~2-5%; Emergency (ruptured) AAA mortality ~50-80%! This is why surveillance matters.
Screening:
- One-time USS screening recommended for men aged 65-75 who are current or ever-smokers
6. THORACIC AORTIC ANEURYSM (TAA)
| Feature | Detail |
|---|---|
| Prevalence | ~2.7% of general population |
| Causes | Hypertension, Marfan syndrome, bicuspid aortic valve, Loeys-Dietz syndrome, giant cell arteritis, Takayasu arteritis, tertiary syphilis (aortic arch) |
| Location | Ascending aorta (most common), aortic arch, descending thoracic |
| Symptoms | Often silent until very large or dissection occurs |
| Specific symptoms | Hoarseness (recurrent laryngeal nerve compression), cough, dysphagia (oesophageal compression), chest/back pain, aortic regurgitation |
| Repair threshold | Marfan / heritable syndromes: ≥5.0 cm; Others: ≥5.5-6.0 cm |
7. AORTIC DISSECTION - Separate but Related Entity
Definition:
Aortic dissection = The laminar planes of the aortic media split apart, and blood under systemic pressure creates a false channel (false lumen) within the aortic wall.
- NOT the same as an aneurysm, but often coexists or results from one
- Most serious acute vascular emergency
Pathogenesis:
PREDISPOSING CONDITION (HTN, Marfan, cystic medial degeneration)
↓
Weakening of aortic media
↓
INTIMAL TEAR (usually within 10 cm of aortic valve)
↓
Blood at systemic pressure enters media through tear
↓
Dissects along media (between middle and outer third)
↓
FALSE LUMEN created alongside TRUE LUMEN
(= "double-barreled aorta")
↓
Propagates DISTALLY (even to iliac/femoral arteries)
OR PROXIMALLY (toward aortic valve / coronary ostia)
↓
Rupture through adventitia → haemopericardium
→ CARDIAC TAMPONADE or massive haemorrhage → DEATH
Who Gets It:
- Men aged 40-60 with hypertension (>90% of cases)
- Younger patients with connective tissue disorders (Marfan, Ehlers-Danlos Type IV)
- Iatrogenic (cardiac catheterisation, aortic cannulation during bypass surgery)
- Pregnancy (rare - ~10-20 per million births; usually 3rd trimester)
- Cocaine (abrupt BP surge)
Classification Systems - Stanford and DeBakey:
| Classification | Type | Anatomy | Treatment |
|---|---|---|---|
| Stanford A (= DeBakey I + II) | Involves the ASCENDING aorta (with or without descending) | Intimal tear near aortic valve, propagates anywhere | URGENT SURGICAL REPAIR (life-threatening) |
| Stanford B (= DeBakey III) | Involves DESCENDING aorta ONLY (starts beyond left subclavian) | Does not involve ascending aorta | Medical management (BP control) first; TEVAR if complications |
STANFORD CLASSIFICATION (Simple 2-type):
TYPE A = Ascending aorta involved
→ SURGICAL EMERGENCY
→ Risk of: tamponade, aortic regurgitation, MI (coronary ostia)
TYPE B = Descending only (beyond L. subclavian)
→ Medical management: IV beta-blockers to ↓ HR + BP
→ Surgery only if rupture, limb ischaemia, end-organ ischaemia
Clinical Features of Aortic Dissection:
CLASSIC PRESENTATION:
"Tearing" or "ripping" pain - sudden onset, maximal at start
Pain begins in ANTERIOR CHEST → radiates to BACK between scapulae
Pain MIGRATES DOWNWARD as dissection propagates
↓
Differences in BP between arms (>20 mmHg = significant)
Pulse deficits (one arm/leg weaker pulse)
Aortic regurgitation murmur (Type A)
Neurological deficits (carotid involvement → stroke)
Syncope / Tamponade (Type A → pericardial effusion)
Exam difference from MI: Dissection pain is maximal FROM ONSET (unlike MI where pain crescendos). Dissection pain MIGRATES; MI pain RADIATES to arm/jaw but doesn't migrate.
Treatment of Aortic Dissection:
| Stanford Type | Management |
|---|---|
| Type A | Emergency surgery (repair/replacement of ascending aorta) - within hours |
| Type B (uncomplicated) | Medical: IV beta-blocker (esmolol/labetalol) to target HR <60, SBP 100-120 mmHg; then oral antihypertensives |
| Type B (complicated) | Thoracic Endovascular Aortic Repair (TEVAR = stenting) |
8. COMPLICATIONS OF ANEURYSMS - MASTER TABLE
| Complication | Mechanism | Consequence |
|---|---|---|
| Rupture | Wall can no longer withstand pressure | Massive internal haemorrhage → death (AAA mortality ~50-80% if ruptured) |
| Thrombosis | Turbulent/stagnant blood in the sac → platelet aggregation | Occlusion of vessel → limb ischaemia |
| Embolism | Mural thrombus fragments break off | Distal occlusion → "trash foot" (blue toe syndrome), mesenteric ischaemia |
| Compression of adjacent structures | Expanding sac presses on neighbours | Ureteric compression → hydronephrosis; vertebral erosion → back pain; oesophageal → dysphagia; nerve compression → sciatica |
| Infection (Mycotic) | Bacteraemia seeds aneurysm wall | Rapid expansion and rupture |
| Fistula formation | Rupture into adjacent vein or bowel | Aortocaval fistula (loud bruit + venous hypertension); aortoenteric fistula (GI haemorrhage) |
| Aortic dissection | Intimal tear in context of diseased aorta | False lumen, tamponade, death |
9. SPECIFIC ANEURYSMS - SUMMARY TABLE
| Aneurysm | Location | Key Cause | Key Feature |
|---|---|---|---|
| AAA | Between renal arteries & bifurcation | Atherosclerosis + smoking | Most common; repair at ≥5.5 cm |
| Thoracic aortic | Ascending > arch > descending | HTN, Marfan, bicuspid AV | Hoarseness, aortic regurgitation |
| Berry aneurysm | Circle of Willis (cerebral) | Congenital elastic lamina defect | Rupture → subarachnoid haemorrhage; associated with ADPKD |
| Popliteal aneurysm | Popliteal artery | Atherosclerosis | Most common peripheral aneurysm; presents with claudication/thrombosis |
| Mycotic aneurysm | Any artery | Infective endocarditis embolus | Rapid expansion; septic; must treat infection |
| Syphilitic aneurysm | Ascending aorta / arch | Treponema pallidum (vasa vasorum obliteration) | Classic: "tree-bark" appearance; aortic regurgitation |
| Ventricular aneurysm | Left ventricle (post-MI) | Transmural MI (full thickness) | Paradoxical systolic wall motion; arrhythmia; thrombus |
10. INVESTIGATIONS FOR ANEURYSMS
| Test | Use |
|---|---|
| Abdominal USS | First line screening/surveillance for AAA; safe, cheap, bedside |
| CT Angiography (CTA) | Gold standard pre-op; shows exact size, extent, branch involvement; planning for EVAR/surgery |
| MRI/MRA | Better for thoracic aneurysm; no radiation; takes longer |
| Chest X-ray | May show widened mediastinum in thoracic aneurysm or dissection |
| Echocardiography (TOE) | Best for acute aortic dissection; can see intimal flap, true vs. false lumen, aortic regurgitation |
| Aortography | Invasive; historically gold standard for dissection but largely replaced by CTA/TOE |
Cardiac Tech point: Transoesophageal Echocardiography (TOE) is particularly important for diagnosing Type A aortic dissection at the bedside in the ICU/emergency setting - a skill directly relevant to your career!
11. COMPARISON FLOWCHART (Draw This for Exams)
VESSEL WALL WEAKENING
(MMPs ↑, SMC loss, Connective tissue defect, Atherosclerosis, HTN)
↓
┌──────────────────────────────────────────────────────────┐
│ ANEURYSM FORMATION │
│ │
│ TRUE ANEURYSM FALSE ANEURYSM │
│ (all 3 layers) (fibrous sac only) │
│ ├─ FUSIFORM Examples: │
│ │ (AAA, Thoracic) - Post-cath pseudoaneurysm │
│ ├─ SACCULAR - Ventricular rupture │
│ │ (Berry, Aorta) │
│ └─ DISSECTING │
│ (Aortic dissection) │
└──────────────────────────────────────────────────────────┘
↓ ↓
COMPLICATIONS: DISSECTION TYPE:
- Rupture (catastrophic) - TYPE A → SURGERY
- Thrombosis/Embolism - TYPE B → MEDICAL
- Pressure on structures (BP control)
- Infection
12. KEY FACTS FOR MCQs
| Question | Answer |
|---|---|
| Definition of a true aneurysm? | Involves ALL three layers (intima, media, adventitia) |
| Definition of a false aneurysm? | Defect in vessel wall → hematoma contained by fibrous tissue only; NOT all three layers |
| Fusiform aneurysm = ? | Circumferential dilation of the entire vessel diameter |
| Saccular aneurysm = ? | Outpouching of PART of vessel circumference |
| Most common cause of AAA? | Atherosclerosis + smoking |
| AAA: most common location? | Infrarenal (below renal arteries, above bifurcation) |
| Repair threshold for AAA? | ≥5.5 cm diameter |
| Strongest risk factor for AAA rupture? | Size (>5.5 cm) |
| Classic triad of ruptured AAA? | Abdominal/back pain + Hypotension + Pulsatile abdominal mass |
| Histological change in aorta predisposing to dissection? | Cystic medial degeneration (SMC loss + elastin fragmentation) |
| Aortic dissection: most common risk factor? | Hypertension (>90% of cases) |
| Pain character in aortic dissection? | Sudden, "tearing/ripping", maximal at onset, migrates to back |
| Stanford Type A = ? | Ascending aorta involved → URGENT SURGERY |
| Stanford Type B = ? | Descending aorta only (beyond L. subclavian) → Medical management |
| DeBakey Type I + II = which Stanford? | Stanford Type A |
| DeBakey Type III = which Stanford? | Stanford Type B |
| Berry aneurysm location? | Circle of Willis (cerebral arteries) |
| Berry aneurysm rupture causes? | Subarachnoid haemorrhage |
| Berry aneurysm associated condition? | ADPKD (autosomal dominant polycystic kidney disease) |
| Syphilitic aneurysm location? | Ascending aorta / arch (obliterative endarteritis of vasa vasorum) |
| Most common peripheral aneurysm? | Popliteal artery aneurysm |
| Marfan syndrome causes aneurysm by? | Defective fibrillin-1 → ↑ TGF-β → cystic medial degeneration |
| Screening for AAA? | One-time USS for men 65-75 who are/were smokers |
| Best bedside test for Type A dissection in ICU? | Transoesophageal echocardiography (TOE) |
13. SELF-TEST (Do Before Day 11)
- Draw the aneurysm classification tree from memory (true/false → fusiform/saccular/dissecting)
- A 68-year-old male smoker presents with sudden-onset severe back pain and is found to have a 6 cm pulsatile abdominal mass with low BP. What is your diagnosis and immediate management?
- Explain the difference in management between Stanford Type A and Type B aortic dissection, and why Type A is a surgical emergency
- A 35-year-old man with Marfan syndrome has a 4.8 cm thoracic aortic aneurysm. Would you repair it? Why/why not?
- What is cystic medial degeneration? Which conditions cause it?
- Name THREE complications of an untreated abdominal aortic aneurysm other than rupture
Day 11
Day 11
peripheral arterial disease claudication ischemic limb ankle brachial index
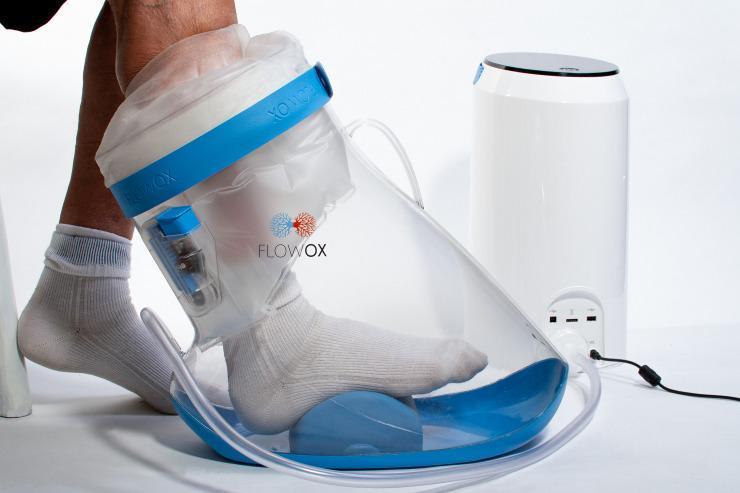
A clinical photograph illustrating the FlowOx™ therapeutic device, a specialized medical system used for managing peripheral arterial disease (PAD) and critical limb ischemia. The image displays a patient's lower leg and foot, wearing a white sock, positioned inside a transparent, conical 'boot' chamber. The boot features a blue base and a blue adjustable top band, connected to a translucent upper sleeve that creates an airtight seal around the lower leg. The foot rests on a blue, dome-shaped internal platform designed to prevent pressure points. A clear pneumatic tube connects the boot's base to a white, cylindrical control unit that generates pulsed intermittent negative pressure (typically -40 mmHg). This therapy is designed to enhance blood flow and microcirculation in the lower extremities for patients with reduced ankle-brachial pressure index (ABPI) or claudication. The device is shown in a clinical or home-use setting, emphasizing its role as a non-invasive vascular intervention for limb salvage and wound care.
This composite educational image illustrates Peripheral Artery Disease (PAD) through clinical and diagnostic correlations. The left panel is a clinical photograph of a patient's lower limb, showing a medium-toned leg with a white adhesive medical dressing applied near the medial aspect of the distal third of the leg/ankle area, typically used to cover and protect skin ulcers. The right panel displays a Doppler ultrasound spectral waveform of the lower limb arteries. The waveform exhibits signs of suprapopliteal arterial stenosis, characterized by an increased systolic rise time (delayed acceleration) and a loss of normal triphasic pulsatility, resulting in a more monophasic appearance. This combination of visual evidence demonstrates the physical manifestation of arterial insufficiency (ulceration requiring dressing) and the underlying hemodynamic abnormality (impaired arterial flow) essential for diagnosing vascular disease. The image is intended for medical students and clinicians to recognize the relationship between clinical findings of ischemic ulcers and diagnostic vascular echography in PAD cases.
📘 WEEK 2 - DAY 11
Peripheral Vascular Disorders: PAD, DVT, Varicose Veins, Buerger's Disease
Sources: Robbins & Kumar Basic Pathology | Bailey & Love's Surgery 28th Ed | Schwartz's Principles of Surgery 11th Ed | Gray's Anatomy for Students | Robbins, Cotran & Kumar Pathologic Basis of Disease
OVERVIEW - The Four Major Peripheral Vascular Disorders
PERIPHERAL VASCULAR DISORDERS
│
├── ARTERIAL (ischaemia → not enough blood getting to tissue)
│ ├── 1. Peripheral Arterial Disease (PAD) - chronic arterial occlusion
│ └── 2. Thromboangiitis Obliterans (Buerger's Disease) - inflammatory
│
└── VENOUS (congestion → blood not draining properly)
├── 3. Deep Vein Thrombosis (DVT) - clot in deep veins
└── 4. Varicose Veins - dilated, incompetent superficial veins
SECTION 1: PERIPHERAL ARTERIAL DISEASE (PAD)
Definition:
PAD = Atherosclerotic stenosis or occlusion of arteries supplying the lower extremities (ABI <0.9), causing chronic limb ischaemia.
- Underlying cause in >90% of cases: Atherosclerosis
- Affects ~200 million people worldwide
- Strong marker of systemic atherosclerosis: 60-90% of PAD patients also have significant coronary artery disease
Risk Factors (Same as Atherosclerosis):
| Risk Factor | Relative Importance |
|---|---|
| Cigarette smoking | Most powerful modifiable RF; ↑ risk 2-4x |
| Diabetes mellitus | ↑ risk of PAD and poor wound healing; accelerates progression |
| Hypertension | |
| Hyperlipidaemia | |
| Age >50 | Risk rises sharply |
| Male sex | More common in men |
| Family history |
Pathogenesis:
Atherosclerotic plaque → ↓ arterial lumen
↓
At REST: adequate perfusion (compensated by collaterals)
↓
With EXERCISE: demand exceeds supply
↓
INTERMITTENT CLAUDICATION (muscle ischaemia on exertion)
↓
Plaque progression → critical stenosis/occlusion
↓
REST PAIN (ischaemia even at rest - severe disease)
↓
TISSUE NECROSIS → ULCERS → GANGRENE
Classification - Fontaine Stages (Learn These!):
| Stage | Symptoms | ABI | Significance |
|---|---|---|---|
| I | Asymptomatic | 0.7-0.9 | Disease present but compensated |
| IIa | Mild claudication (walks >200m) | 0.5-0.7 | |
| IIb | Moderate-severe claudication (walks <200m) | 0.5-0.7 | |
| III | Rest pain (especially at night, relieved by hanging leg down) | 0.3-0.5 | Critical limb ischaemia |
| IV | Ulceration and/or gangrene | <0.3 | Critical limb ischaemia - risk of amputation |
Exam tip: Stage III-IV = "Critical Limb Ischaemia (CLI)" - threat to limb viability. These patients need urgent vascular intervention.
Ankle-Brachial Index (ABI) - Key Investigation:
ABI = Ankle systolic BP (higher of dorsalis pedis or posterior tibial)
──────────────────────────────────────────────────────────────
Brachial systolic BP (higher of both arms)
Normal ABI: ≥1.0
Borderline: 0.91-0.99
PAD (mild-moderate): 0.5-0.9
Severe PAD/CLI: <0.5
Falsely elevated (calcified vessels in DM): >1.3
Clinical Features - The 6 P's of Acute Limb Ischaemia:
6 P's (acute ischaemia):
1. Pain (sudden, severe)
2. Pallor (white/pale limb)
3. Pulselessness (absent distal pulses)
4. Paraesthesia (numbness, tingling)
5. Paralysis (motor weakness - late, ominous sign)
6. Perishing cold (cold to touch)
Chronic PAD - Clinical Features:
| Feature | Description |
|---|---|
| Intermittent claudication | Cramping calf (or thigh/buttock) pain on walking → relieved by rest within 2-5 min |
| Rest pain | Burning pain in foot at night; worse lying flat; relieved by hanging leg down (gravity helps perfusion) |
| Trophic changes | Hairless, shiny, atrophic skin; thickened nails; muscle wasting |
| Ischaemic ulcers | Punched-out, painful, on pressure points (toes, heel); arterial ulcer |
| Gangrene | Dry gangrene initially; wet (infected) gangrene if secondary infection |
Investigations:
| Test | Purpose |
|---|---|
| ABI (Ankle-Brachial Index) | First-line, non-invasive, diagnostic |
| Duplex Doppler USS | Visualises stenosis, blood flow, plaque |
| CT Angiography (CTA) | Pre-operative planning; gold standard imaging |
| MR Angiography | No radiation; good alternative |
| Conventional Angiography | Invasive; reserved for intervention planning |
Management:
CONSERVATIVE (all patients):
├── Smoking cessation (most important!)
├── Exercise rehabilitation programme (walking)
├── Weight loss, BP control, diabetes control
├── Statin therapy (↓ LDL, pleiotropic benefits)
└── Antiplatelet therapy: Aspirin 75mg/day or Clopidogrel
PHARMACOLOGICAL:
├── Cilostazol (PDE-3 inhibitor → vasodilation + ↓ platelet aggregation)
│ → Improves walking distance in claudication
└── Pentoxifylline (↓ blood viscosity) - less effective than cilostazol
INTERVENTIONAL (for CLI or severe claudication):
├── Percutaneous Transluminal Angioplasty (PTA) ± Stenting
│ → Balloon dilates the stenotic segment
└── Surgical bypass (autogenous vein graft or synthetic graft)
→ Bypasses occluded segment using grafted conduit
AMPUTATION:
└── Last resort for non-viable limb (unsalvageable ischaemia/infection)
SECTION 2: DEEP VEIN THROMBOSIS (DVT)
Definition:
DVT = Formation of a blood clot (thrombus) within a deep vein, most commonly in the lower limb (iliac, femoral, popliteal, tibial veins).
- Accounts for >90% of cases of venous thrombosis
- Key danger: Pulmonary Embolism (PE) - thrombus detaches and travels to pulmonary circulation
Virchow's Triad - The Pathogenesis of ALL Thrombosis:
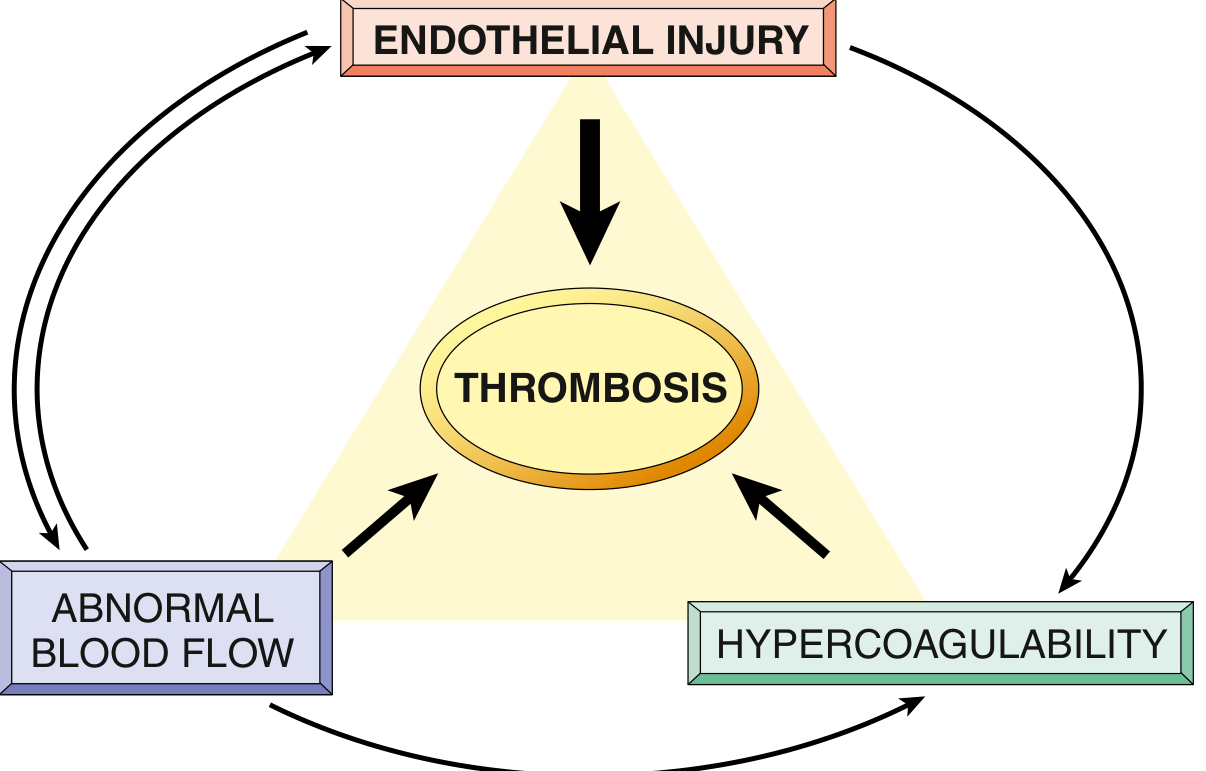
VIRCHOW'S TRIAD (1856)
1. ENDOTHELIAL INJURY
- Trauma, surgery, IV cannula
- Inflammation (vasculitis)
- Atherosclerosis
→ Exposes collagen + tissue factor → platelet activation + coagulation cascade
2. ABNORMAL BLOOD FLOW (Stasis or Turbulence)
- Immobility (post-op, long flights, paralysis)
- Pregnancy (uterus compresses IVC)
- Cardiac failure (↓ CO → ↓ venous return)
- Varicose veins
→ Stasis: ↑ contact of activated clotting factors with vessel wall
→ Turbulence: endothelial activation
3. HYPERCOAGULABILITY (blood clots too easily)
Primary (genetic):
├── Factor V Leiden mutation (most common hereditary)
│ → Factor V resistant to protein C inactivation
│ → Heterozygotes: 3-4x risk; Homozygotes: 25-50x risk
├── Prothrombin G20210A mutation
└── Protein C / Protein S / Antithrombin III deficiency
Secondary (acquired):
├── Malignancy (cancer releases procoagulants)
├── OCP/HRT (oestrogen → ↑ clotting factors)
├── Pregnancy
├── Antiphospholipid syndrome
├── Nephrotic syndrome (loss of antithrombin III)
└── Heparin-Induced Thrombocytopenia (HIT)
Risk Factors for DVT:
| Category | Examples |
|---|---|
| Surgery | Pelvic, orthopaedic (THR, TKR = highest risk), abdominal |
| Immobility | Long-haul flights, bed rest >3 days, paralysis, plaster cast |
| Malignancy | Trousseau syndrome (migratory thrombophlebitis in cancer) |
| Pregnancy / puerperium | IVC compression + hypercoagulable state |
| OCP / HRT | Oestrogen → ↑ coagulation factors |
| Thrombophilia | Factor V Leiden, antiphospholipid syndrome |
| Previous DVT/PE | Strongest predictor of recurrence |
| Age >60 | |
| Obesity | |
| Dehydration |
Clinical Features of DVT:
SYMPTOMS:
- Unilateral leg swelling ← most common
- Calf pain / tenderness
- Warmth of the affected limb
- Erythema / discolouration
- Engorged superficial veins
SIGNS:
- Homans' sign: calf pain on dorsiflexion of foot
(NOTE: neither sensitive NOR specific - not reliable alone!)
- Calf tenderness on palpation
- Pitting oedema
MOST DVTs are ASYMPTOMATIC until PE occurs!
Wells Score for DVT (Clinical Probability Tool):
| Clinical Feature | Score |
|---|---|
| Active cancer | +1 |
| Paralysis, paresis, or immobilised lower limb | +1 |
| Bedridden ≥3 days or major surgery within 12 weeks | +1 |
| Localised tenderness along deep venous system | +1 |
| Entire leg swollen | +1 |
| Calf swelling >3 cm compared to other leg | +1 |
| Pitting oedema in symptomatic leg only | +1 |
| Collateral superficial veins (non-varicose) | +1 |
| Previous DVT | +1 |
| Alternative diagnosis as likely or more likely | -2 |
Score ≥2 = DVT likely → proceed to Doppler USS Score <2 = DVT unlikely → D-dimer test first; USS only if D-dimer positive
Investigations:
| Test | Significance |
|---|---|
| D-Dimer | Highly sensitive, NOT specific; elevated in DVT/PE but also in infection, malignancy, post-op. A negative D-dimer rules out DVT in low-probability patients |
| Duplex Doppler USS | First-line imaging; confirms diagnosis; non-compressible vein = DVT |
| Venography | Gold standard but invasive; rarely used now |
| CT/MR Venography | For pelvic/IVC thrombosis |
Management of DVT:
| Agent | Mechanism | Use |
|---|---|---|
| LMWH (e.g. Enoxaparin) | ↑ Antithrombin III → inhibits Xa and IIa | Acute treatment; rapid anticoagulation |
| UFH (Unfractionated Heparin) | Same; reversible with protamine | Renal failure patients (renally cleared LMWH unsafe) |
| Rivaroxaban / Apixaban (DOACs) | Direct Factor Xa inhibitors | Oral; first-line maintenance for ≥3 months |
| Dabigatran | Direct thrombin inhibitor | Alternative DOAC |
| Warfarin | Vitamin K antagonist → ↓ II, VII, IX, X | Older agent; requires INR monitoring (target 2-3) |
| Fondaparinux | Indirect Factor Xa inhibitor | For HIT patients (heparin-allergic) |
| IVC Filter | Mechanical trap | When anticoagulation is contraindicated; prevents PE |
| Thrombolysis / CDT | Dissolves clot | Extensive iliofemoral DVT; reduces post-thrombotic syndrome |
Duration of anticoagulation:
- Provoked DVT (reversible cause like surgery): 3 months
- Unprovoked DVT / recurrent: 6-12 months or indefinite
- DVT with active cancer: Indefinite (LMWH or DOAC)
DVT Complication - Pulmonary Embolism (PE):
Deep vein thrombus (usually iliofemoral)
↓
Thrombus detaches → embolus
↓
Travels: femoral v → iliac v → IVC → right heart → pulmonary artery
↓
Pulmonary artery occlusion
↓
Small PE: pleuritic chest pain, haemoptysis, breathlessness
Large/Massive PE: acute cor pulmonale, obstructive shock, DEATH
↓
Treatment: anticoagulation; thrombolysis (tPA) for massive PE
Classical triad of PE: Haemoptysis + Pleuritic chest pain + Dyspnoea - but only seen in minority of cases!
SECTION 3: VARICOSE VEINS
Definition:
Varicose veins = Abnormally dilated, tortuous superficial veins caused by chronic ↑ intraluminal pressure + weakened vessel wall support, with incompetent venous valves.
Epidemiology:
- Up to 1/5 of men and 1/3 of women develop lower limb varicose veins
- Affects great saphenous vein (medial leg/thigh) most commonly
Pathogenesis:
RISK FACTORS:
Prolonged standing, Pregnancy, Obesity, Family history, Age
↓
↑ Intraluminal venous pressure
↓
Vein wall weakens → dilates
↓
Venous VALVE BECOMES INCOMPETENT
(valves can no longer close properly when dilated)
↓
Blood refluxes backwards (from deep → superficial system)
↓
Further venous hypertension + dilation
↓
TORTUOUS, DILATED SUPERFICIAL VEINS
Clinical Features:
| Feature | Description |
|---|---|
| Visible tortuous veins | Most common presenting complaint; along saphenous distribution |
| Aching / heaviness | Worse at end of day, after prolonged standing |
| Oedema | Ankle/lower leg swelling (venous stasis) |
| Itching | From venous congestion |
| Skin changes (chronic) | Stasis dermatitis (eczema), hyperpigmentation (haemosiderin), lipodermatosclerosis (skin induration) |
| Varicose ulcers | Around medial malleolus; painless; shallow; irregular edges; surrounded by pigmented skin |
Varicose vs. Arterial Ulcer - Must-Know Comparison:
| Feature | Varicose (Venous) Ulcer | Arterial (Ischaemic) Ulcer |
|---|---|---|
| Location | Medial malleolus ("gaiter area") | Pressure points (toes, heel, lateral malleolus) |
| Pain | Usually painless | Very painful |
| Edges | Irregular, sloping | Punched-out, well-defined |
| Base | Granulation tissue, moist | Pale, necrotic, dry |
| Surrounding skin | Pigmented, eczematous | Hairless, shiny, atrophic |
| Pulses | Present | Absent/reduced |
| ABI | Normal (>1.0) | Low (<0.9) |
| Cause | Venous hypertension + valve incompetence | Arterial ischaemia (atherosclerosis) |
| Treatment | Compression bandaging | Revascularisation (angioplasty/bypass) |
Management of Varicose Veins:
CONSERVATIVE:
- Compression stockings (class II: 23-32 mmHg)
- Leg elevation
- Weight loss, exercise
INTERVENTIONAL (for symptomatic/complicated disease):
- EVLT (Endovenous Laser Treatment) - laser ablates the vein
- RFA (Radiofrequency Ablation) - similar to EVLT
- Foam Sclerotherapy - chemical injection obliterates vein
- Surgical stripping (ligation + avulsion) - older technique
CONTRAINDICATION to compression stockings:
- Peripheral arterial disease (PAD/ABI <0.8) - would worsen ischaemia!
Critical exam point: NEVER apply compression stockings in a patient with suspected PAD - they will worsen arterial ischaemia!
SECTION 4: THROMBOANGIITIS OBLITERANS (BUERGER'S DISEASE)
Definition:
Thromboangiitis obliterans = A non-atherosclerotic, segmental, inflammatory occlusive disease of small and medium-sized arteries AND veins of the extremities, almost exclusively caused by tobacco.
- Described by Leo Buerger in 1908
- Age of onset: typically 20-50 years (young!)
- Male predominance (though female incidence rising with increased smoking)
Key Distinguishing Features from PAD (Atherosclerosis):
| Feature | Buerger's Disease | PAD (Atherosclerosis) |
|---|---|---|
| Age | 20-50 yrs (young) | >50 yrs |
| Cause | Tobacco (essential) | Atherosclerosis RF |
| Cholesterol/DM | Normal | Often elevated |
| Vessel type | Small/medium arteries + veins + nerves | Large/medium arteries |
| Distribution | Distal (infrapopliteal, radial/ulnar) | Proximal (aortoiliac, femoropopliteal) |
| Upper limb involvement | Yes (arms + hands) | Rare |
| Venous involvement | Yes (migratory superficial phlebitis) | No |
| Nerves involved | Yes (severe rest pain) | Less |
Pathology:
ACTIVE/ACUTE PHASE:
- Segmental thrombosis of small/medium vessels
- Dense polymorphonuclear (PMN) infiltrate = classic
- Microabscesses within thrombus
- Multinucleated giant cells (granulomatous inflammation)
- Inflammation spreads to adjacent vein and nerve ("skip lesions")
CHRONIC PHASE:
- ↓ Cellularity
- Recanalization of thrombus
- Eventual fibrosis encasing artery, vein, nerve together
KEY HISTOLOGICAL FEATURE: Intact internal elastic lamina
(distinguishes it from atherosclerosis where IEL is disrupted)
Clinical Features:
ONSET: Young male smoker <40 years
↓
EARLY:
- Foot/hand claudication (instep claudication = pathognomonic!)
- Raynaud's phenomenon (cold-triggered colour changes)
- Migratory superficial phlebitis (red, tender nodules along veins)
↓
PROGRESSION:
- Rest pain (severe, burning)
- Digital ulceration (toes/fingers)
↓
ADVANCED:
- Gangrene → Amputation
Angiographic Feature (Pathognomonic):
"Corkscrew collaterals" on angiogram - extensive collateral vessels forming a corkscrew pattern around segmentally occluded distal vessels. Disease is confined to infrapopliteal arteries and distal to the brachial artery.
Management:
| Intervention | Role |
|---|---|
| Smoking cessation | THE ONLY EFFECTIVE TREATMENT - disease remission is dramatic with cessation; progression halted |
| Wound care | For ulcers |
| Vasodilators | Symptomatic relief only |
| Prostanoids (Iloprost IV) | For severe ischaemia/ulcers |
| Surgical bypass | Limited - often no suitable distal target vessel available |
| Amputation | Limb loss in ~31% over 15 years; 67% in those who continue smoking vs 35% in those who stop |
Critical exam fact: Smoking cessation is THE ONLY treatment that reliably prevents progression of Buerger's disease. No amount of surgical skill can substitute for stopping tobacco!
MASTER COMPARISON TABLE - All Four Disorders
| Feature | PAD | DVT | Varicose Veins | Buerger's Disease |
|---|---|---|---|---|
| Vessel type | Artery | Vein (deep) | Vein (superficial) | Artery + vein + nerve |
| Aetiology | Atherosclerosis | Virchow's triad | Valve incompetence + ↑ pressure | Tobacco |
| Age | >50 | Any | Any | 20-50 |
| Symptom | Claudication, rest pain | Leg swelling, pain | Aching, visible veins | Instep claudication, rest pain |
| Key sign | ↓ Pulses, ABI <0.9 | Non-compressible vein on USS | Tortuous dilated veins | Corkscrew collaterals on angiogram |
| Risk | MI, stroke, gangrene | PE | Venous ulcer | Amputation |
| Key treatment | Statin + antiplatelet + revascularisation | Anticoagulation (DOAC/LMWH) | Compression/ablation | Smoking cessation |
KEY FACTS FOR MCQs
| Question | Answer |
|---|---|
| Most common cause of PAD? | Atherosclerosis |
| ABI value diagnostic of PAD? | <0.9 |
| ABI <0.3 means? | Critical limb ischaemia |
| Fontaine Stage III = ? | Rest pain |
| First-line drug for claudication? | Cilostazol (PDE-3 inhibitor) |
| Virchow's Triad components? | Endothelial injury + Stasis/Turbulence + Hypercoagulability |
| Most common hereditary thrombophilia? | Factor V Leiden mutation |
| First-line test for DVT? | Duplex Doppler ultrasound |
| A negative D-dimer rules out DVT in which patients? | Low pre-test probability patients |
| Homans' sign = ? | Calf pain on dorsiflexion - NOT sensitive or specific |
| Standard duration of anticoagulation for provoked DVT? | 3 months |
| PE: most common source? | DVT of iliofemoral veins |
| Venous ulcer location? | Medial malleolus |
| Arterial ulcer location? | Pressure points (toes, heel) |
| Venous ulcer appearance? | Irregular edges, moist granulation base, painless |
| Arterial ulcer appearance? | Punched-out, pale/necrotic base, very painful |
| Contraindication to compression stockings? | Peripheral arterial disease (PAD) |
| Buerger's disease: age group? | Young (20-50), male smokers |
| What is pathognomonic of Buerger's on angiogram? | Corkscrew collaterals |
| Instep claudication is characteristic of? | Buerger's disease |
| Only effective treatment for Buerger's disease? | Smoking cessation |
| Migratory superficial phlebitis is associated with? | Buerger's disease and malignancy (Trousseau syndrome) |
SELF-TEST (Do Before Day 12)
- A 65-year-old male smoker presents with right calf pain on walking 100m, relieved by rest. ABI is 0.6. What is the diagnosis, Fontaine stage, and management plan?
- A 35-year-old female develops sudden left leg swelling and breathlessness after a 14-hour flight. What do you suspect? What is your first investigation?
- What is Virchow's triad? Give one clinical example of each component
- Distinguish between a venous ulcer and an arterial ulcer on five features
- A 28-year-old heavy smoker presents with Raynaud's phenomenon, instep claudication, and migratory phlebitis. What is the diagnosis and the SINGLE most important treatment?
- Draw the Wells DVT scoring system from memory and explain its clinical use
Day 13
- Day 12 = Week 2 Revision + Master Mind-Map
- Day 13 = Start of Phase 2 (Week 3) = Paper I begins → Coronary Artery Disease (CAD)
Day 12 (Week 2 Revision) was skipped - shall I include a quick revision summary at the start of today's notes, or go straight into Day 13 content?
coronary artery disease myocardial infarction zones subendocardial transmural diagram
A cross-sectional anatomical diagram illustrating the quantification of myocardial viability and remodeling following chronic infarction. The image depicts a transverse slice of the heart with specialized labeling of myocardial layers. Segment A represents the area of late gadolinium enhancement (LGE) or fibrosis, appearing as a light grey/white subendocardial layer. Segment B shows the full transmural thickness of the remodeled, thinned myocardium. Segment C highlights the remaining non-enhancing, viable myocardium in the infarcted zone. Segment D serves as a control, representing the full thickness of adjacent healthy, non-remodeled myocardium. The diagram contrasts two methodologies for surgical candidacy: the traditional approach (C/B ratio) versus the authors' proposed approach (C/D ratio) for assessing transmurality. The use of different grey scales and blue calipers demonstrates the morphological changes associated with chronic myocardial thinning, providing a visual guide for risk stratification and determining viability prior to coronary artery bypass grafting (CABG).
This diagnostic image displays two cardiac magnetic resonance imaging (MRI) views obtained using Late Gadolinium Enhancement (LGE) technique to assess myocardial viability. Panel (a) is a four-chamber view showing subendocardial delayed enhancement in the anterolateral segment, involving less than 50% of the myocardial thickness, indicative of non-transmural infarction. Panel (b) is a short-axis view demonstrating transmural delayed enhancement of the midcavitary septal segment, where high signal intensity extends across the entire wall thickness. The imaging findings are consistent with myocardial infarction in the left anterior descending (LAD) artery territory. These views are essential for distinguishing between viable and non-viable myocardium in the setting of coronary artery disease or vasospasm-induced ischemia, as seen in this clinical case involving khat-induced vasospasm.
acute coronary syndrome STEMI NSTEMI ECG changes ST elevation troponin
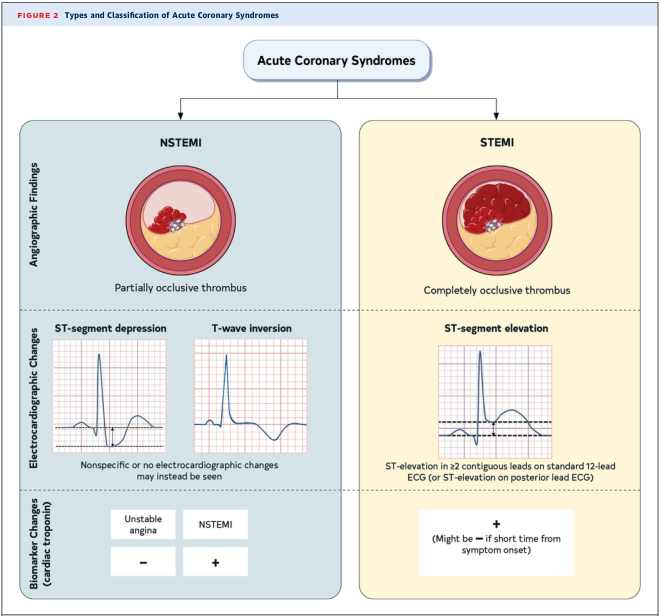
Summary : This figure presents the types and classification of Acute Coronary Syndromes, contrasting NSTEMI (Non-ST-Elevation Myocardial Infarction) and STEMI (ST-Elevation Myocardial Infarction) based on angiographic findings, electrocardiographic changes, and cardiac biomarker changes. flowchart: # Main Categories : • Acute Coronary Syndromes (central node) – Branches into: NSTEMI (left), STEMI (right) # NSTEMI : ## Angiographic Findings : • Illustration of a coronary artery with a partially occlusive thrombus. • Label: "Partially occlusive thrombus" ## Electrocardiographic Changes : • ST-segment depression (example ECG tracing) • T-wave inversion (example ECG tracing) • Note: "Nonspecific or no electrocardiographic changes may instead be seen" ## Biomarker Change (cardiac troponin) : • Unstable angina: negative (–) • NSTEMI: positive (+) # STEMI : ## Angiographic Findings : • Illustration of a coronary artery with a completely occlusive thrombus. • Label: "Completely occlusive thrombus" ## Electrocardiographic Changes : • ST-segment elevation (example ECG tracing) • Note: "ST-elevation in ≥2 contiguous leads on standard 12-lead ECG (or ST-elevation on posterior lead ECG)" ## Biomarker Change (cardiac troponin) : • Positive (+) • Note: "Might be – if short time from symptom onset" # Layout : • Two-column comparison: NSTEMI (blue background, left), STEMI (yellow background, right) • Each column subdivided into three horizontal sections: Angiographic Findings, Electrocardiographic Changes, Biomarker Change # Analysis : • NSTEMI is characterized by partial thrombus occlusion, ST-segment depression or T-wave inversion (or nonspecific ECG changes), and positive cardiac troponin. • STEMI is defined by complete thrombus occlusion, ST-segment elevation on ECG, and positive cardiac troponin (may be negative early after symptom onset). • The figure visually distinguishes the pathophysiology, ECG findings, and biomarker profiles of NSTEMI and STEMI, aiding in clinical differentiation.
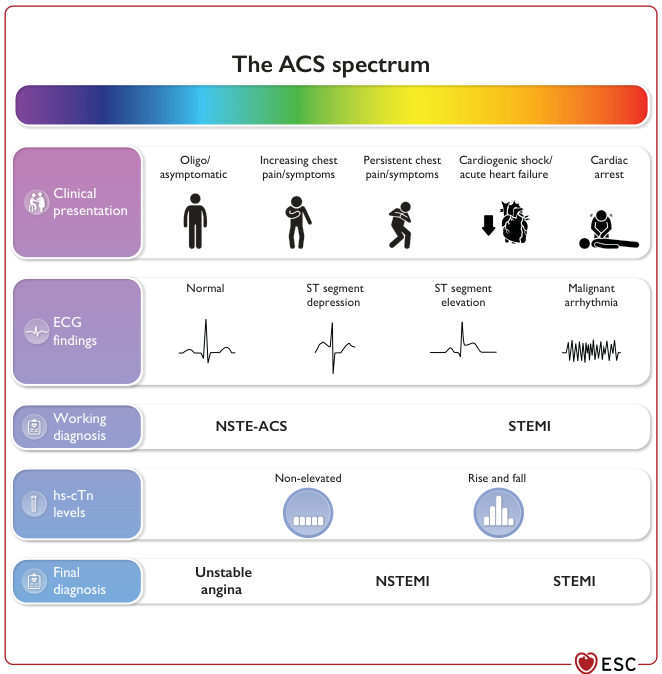
Summary : This figure illustrates the spectrum of Acute Coronary Syndromes (ACS), detailing the progression from mild or asymptomatic presentations to severe outcomes such as cardiac arrest. It organizes ACS into clinical presentation, ECG findings, working diagnosis, high-sensitivity cardiac troponin (hs-cTn) levels, and final diagnosis, showing how these elements interrelate across the ACS continuum. flowchart: # ACS Spectrum Overview : • Title: "The ACS spectrum" • Horizontal colour gradient bar from purple (mild) to red (severe) representing increasing severity. # Clinical Presentation : • Oligo/asymptomatic (stick figure standing) • Increasing chest pain/symptoms (stick figure hunched over) • Persistent chest pain/symptoms (stick figure clutching chest) • Cardiogenic shock/acute heart failure (heart with downward arrow) • Cardiac arrest (stick figure collapsed) # ECG Findings : • Normal (standard ECG trace) • ST segment depression (ECG trace with depressed ST segment) • ST segment elevation (ECG trace with elevated ST segment) • Malignant arrhythmia (irregular ECG trace) # Working Diagnosis : • NSTE-ACS (Non-ST Elevation Acute Coronary Syndrome) • STEMI (ST-Elevation Myocardial Infarction) # hs-cTn Levels : • Non-elevated (flat bar graph icon) • Rise and fall (bar graph with varying heights) # Final Diagnosis : • Unstable angina • NSTEMI (Non-ST Elevation Myocardial Infarction) • STEMI (ST-Elevation Myocardial Infarction) # Layout : • Five horizontal sections, each with corresponding icons and text, aligned vertically. • Progression from left (mild) to right (severe) across all sections. • ESC logo at bottom right. # Analysis : • The figure visually organizes ACS as a continuum, showing that clinical severity, ECG changes, troponin levels, and diagnosis all progress together. • NSTE-ACS includes unstable angina and NSTEMI, distinguished by troponin levels. • STEMI is associated with ST elevation and rise/fall in troponin. • The most severe presentations (cardiac arrest, malignant arrhythmia) are at the far right, corresponding to the most critical diagnoses.
coronary artery territory LAD RCA LCX myocardial infarction ECG leads correlation
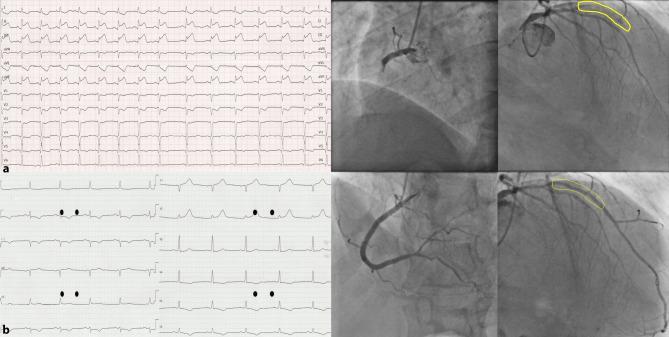
A comparison of 12-lead electrocardiograms (ECG) and invasive coronary angiograms demonstrating an acute myocardial infarction before and after primary percutaneous coronary intervention (pPCI). Row (a) displays a pre-procedural ECG showing significant ST-segment elevation in the inferior leads (II, III, aVF) diagnostic of an inferior wall STEMI. Adjacent angiograms reveal a total occlusion of the proximal right coronary artery (RCA) and a significant lesion in the left anterior descending artery (LAD) after the first septal branch (S1), highlighted by a yellow outline. Row (b) presents the post-procedural results, where the ECG shows successful ST-segment resolution and return to baseline. Corresponding angiograms demonstrate restored TIMI 3 flow and luminal patency in both the RCA and LAD following stent deployment. This clinical image illustrates the management of multi-vessel coronary artery disease in the setting of cardiogenic shock and acute myocardial injury, highlighting the correlation between electrical findings on ECG and anatomical revascularization via pPCI.
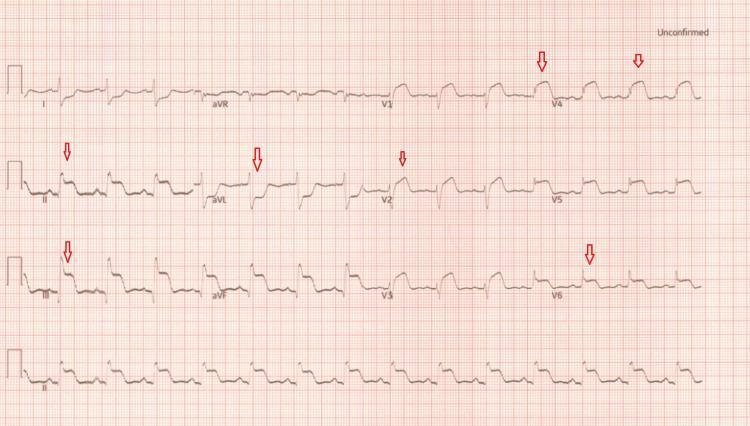
This diagnostic image is a 12-lead electrocardiogram (ECG) demonstrating acute ST-segment elevation myocardial infarction (STEMI). The tracing reveals a sinus rhythm with significant ST-segment elevation in the inferior leads (II, III, and aVF) and the anterior precordial leads (V1 through V4), highlighted by red arrows. Notably, there is reciprocal ST-segment depression in the high lateral leads (I and aVL). The anterolateral leads (V5 and V6) show T-wave inversions. These findings indicate widespread myocardial ischemia or injury involving multiple vascular territories, specifically the inferior and anterior walls. The clinical significance of this ECG suggests acute occlusion of major coronary arteries, such as the right coronary artery (RCA) and left anterior descending (LAD) artery, requiring urgent intervention. This visual is an educational example of multi-territory STEMI and the identification of reciprocal changes in a clinical cardiology context.
📘 WEEK 3 - DAY 13 (Phase 2 begins - Paper I)
Coronary Artery Disease: Mechanism, Angina, ACS, MI, Complications & Management
Sources: Robbins & Kumar Basic Pathology | Guyton & Hall Medical Physiology | Goldman-Cecil Medicine | Bailey & Love's Surgery
1. OVERVIEW - ISCHAEMIC HEART DISEASE (IHD)
Ischaemic Heart Disease (IHD) = A group of syndromes caused by an imbalance between myocardial oxygen demand and supply, most commonly from coronary atherosclerosis.
- Leading cause of death worldwide - 7.5 million deaths/year
- In >90% of cases, caused by obstructive atherosclerotic coronary artery disease (CAD)
- Hence: IHD ≈ CAD in clinical usage
The Four Clinical Syndromes of IHD:
IHD (Imbalance: O₂ supply < O₂ demand)
↓
┌───────────────┬──────────────────┬────────────────┐
│ │ │ │
ANGINA MYOCARDIAL CHRONIC IHD SUDDEN
PECTORIS INFARCTION (Ischaemic CARDIAC
(ischaemia, (cardiomyocyte cardiomyopathy) DEATH
no necrosis) DEATH) (pump failure) (VF)
2. RISK FACTORS FOR CAD
Non-Modifiable:
| Factor | Detail |
|---|---|
| Age | Risk rises sharply; MI frequency ↑ 5x between ages 40-60 |
| Male sex | Men more susceptible; women protected pre-menopausally by oestrogen; post-menopause risk equals/exceeds men |
| Family history / Genetics | Strongest independent RF; familial hypercholesterolaemia |
Modifiable:
| Factor | Mechanism |
|---|---|
| Hypercholesterolaemia (LDL↑) | Plaque formation; foam cells; plaque rupture |
| Hypertension | Endothelial injury; accelerates atherosclerosis |
| Cigarette smoking | Oxidative endothelial damage; ↑ LDL oxidation; ↑ platelet aggregation |
| Diabetes mellitus | Accelerated atherosclerosis; AGE-mediated endothelial damage |
| Obesity | ↑ LDL, BP, insulin resistance |
| Physical inactivity | ↓ HDL; ↑ LDL, BP |
Exam high-yield: Hyperlipidaemia + Hypertension + Smoking together multiply CAD risk by 7-fold!
3. PATHOGENESIS OF CAD
The Core Concept:
Atherosclerosis (Weeks 1-2 revision!)
↓
Fatty streak → Fibrous plaque → Advanced plaque
↓
CORONARY ARTERY STENOSIS
↓
├── STABLE PLAQUE (thick cap, small core)
│ → Gradual narrowing → O₂ supply ↓ on exertion
│ → STABLE ANGINA
│
└── VULNERABLE PLAQUE (thin cap, large lipid core)
→ PLAQUE RUPTURE / EROSION
→ Platelet aggregation + thrombus
→ Partial occlusion → NSTEMI / Unstable angina
→ Complete occlusion → STEMI
Two Mechanisms Causing IHD:
- <70% stenosis → asymptomatic (even with exertion)
- >70% stenosis = Critical Stenosis → symptoms on exertion → Stable Angina
- >90% stenosis → symptoms at rest → Unstable Angina
- Plaque rupture/erosion → exposes collagen + tissue factor → thrombus formation
- Partial thrombus → Unstable Angina or NSTEMI
- Complete occlusion → STEMI
- Can also get vasoconstriction triggered by: adrenergic agonists, platelet products, imbalance between NO (vasodilator) and endothelin (vasoconstrictor)
4. ANGINA PECTORIS - Types and Mechanisms
Angina pectoris = Chest pain from myocardial ischaemia that is reversible - ischaemia without infarction (no cell death yet).
Types of Angina:
| Type | Trigger | Mechanism | ECG | Relief |
|---|---|---|---|---|
| Stable Angina | Exertion, emotion, cold | Fixed stenosis >70% → demand exceeds supply | ST depression during episode | Rest + GTN (nitrates) within 5 min |
| Unstable Angina | Rest or minimal exertion; NEW or worsening | Plaque rupture → partial thrombus; NO myocyte necrosis (troponin NEGATIVE) | ST depression, T-wave inversion, or normal | Does NOT fully resolve with rest; medical emergency |
| Prinzmetal's (Variant) Angina | Often at rest, cyclical (early morning) | Coronary artery vasospasm (not fixed stenosis) | ST elevation (transient, resolves) | GTN + CCBs |
| Microvascular Angina (Syndrome X) | Exertion | Small vessel disease (no epicardial stenosis) | ST depression; normal coronary angiogram | Often difficult to treat |
Oxygen Supply vs. Demand in Angina:
MYOCARDIAL O₂ DEMAND determined by:
- Heart rate (HR) ← most important
- Contractility
- Wall tension (= Preload + Afterload)
MYOCARDIAL O₂ SUPPLY determined by:
- Coronary blood flow
- Arterial O₂ content (haemoglobin × SaO₂)
ANGINA occurs when DEMAND > SUPPLY
Anti-Anginal Drug Mechanisms:
| Drug Class | Example | Effect on Demand/Supply | Mechanism |
|---|---|---|---|
| Nitrates | GTN, Isosorbide mononitrate | ↓ Preload + ↓ Afterload = ↓ Wall tension = ↓ Demand | Converted to NO → venodilation (primarily) + coronary vasodilation |
| Beta-blockers | Metoprolol, Bisoprolol | ↓ HR + ↓ Contractility = ↓ Demand | Block β₁ receptors → ↓ chronotropy + inotropy |
| Calcium channel blockers (CCBs) | Amlodipine, Diltiazem | ↓ HR (non-DHP) + ↓ Afterload = ↓ Demand + ↑ Supply | Block L-type Ca²⁺ channels → vasodilation + (non-DHP) ↓ HR |
| Ranolazine | Ranolazine | ↓ Demand | Blocks late INa → ↓ diastolic Ca²⁺ overload |
| Ivabradine | Ivabradine | ↓ HR = ↓ Demand | Blocks If (funny current) in SA node |
5. ACUTE CORONARY SYNDROMES (ACS) - The Full Picture
ACS Classification:
ACUTE CORONARY SYNDROME (ACS)
= Unstable Angina + NSTEMI + STEMI
Trigger in ALL cases: PLAQUE RUPTURE → THROMBUS
├── UNSTABLE ANGINA
│ Partial thrombus, NO myocyte death
│ Troponin: NEGATIVE
│ ECG: ST depression / T inversion / Normal
│ Treatment: Medical (anticoagulation + antiplatelet)
│
├── NSTEMI (Non-ST Elevation MI)
│ Partial thrombus, subendocardial myocyte death
│ Troponin: POSITIVE
│ ECG: ST depression / T inversion (NO ST elevation)
│ Treatment: Medical + consider PCI within 72 hours
│
└── STEMI (ST Elevation MI)
Complete thrombus, TRANSMURAL myocyte death
Troponin: POSITIVE (may be negative in first 1-2h)
ECG: ST elevation in ≥2 contiguous leads
Treatment: EMERGENCY reperfusion (pPCI within 90 min / Thrombolysis)
6. MYOCARDIAL INFARCTION (MI) - IN DEPTH
The Sequence of Coronary Occlusion:
Step 1: Atheromatous plaque RUPTURES or ERODES
↓
Step 2: Exposes subendothelial collagen + tissue factor + plaque lipid core
↓
Step 3: Platelet ADHESION → ACTIVATION → AGGREGATION
Release: TXA₂, ADP, Serotonin → further platelet aggregation + vasospasm
↓
Step 4: COAGULATION CASCADE activated by tissue factor
↓
Step 5: THROMBUS ENLARGES → Complete luminal occlusion within minutes
↓
Step 6: MYOCARDIAL ISCHAEMIA → INFARCTION (if not reperfused)
Subendocardial vs. Transmural Infarction:
| Feature | Subendocardial Infarction | Transmural Infarction |
|---|---|---|
| Zone involved | Inner 1/3 of myocardium (endocardium) | Full thickness (endo + mid + epicardium) |
| Cause | Often partial occlusion / global hypoperfusion | Complete coronary occlusion |
| ECG | ST depression, T-wave changes | ST elevation → Q waves |
| Old name | NSTEMI | STEMI |
| Risk zone | Subendocardium is most ischaemia-prone (farthest from coronary supply, highest wall stress) |
Morphological Evolution of MI (Table 9.2 from Robbins):
| Time | Gross Appearance | Histology | Key Feature |
|---|---|---|---|
| 0-30 min | Normal | Normal | Reversible injury; ATP depletion |
| 30 min - 4 hrs | Normal | ± Waviness of fibres at border | Point of no return at ~30 min |
| 4-12 hrs | Occasionally dark mottling | Coagulation necrosis begins; oedema; haemorrhage | |
| 12-24 hrs | Dark mottling | Coagulation necrosis + pyknosis of nuclei + early neutrophil infiltrate | Hypereosinophilic myocytes |
| 1-3 days | Yellow-tan centre + mottling | Coagulation necrosis + ↑↑ Neutrophils | Max neutrophil infiltrate |
| 3-7 days | Hyperaemic border + yellow-tan softening | Neutrophils dying; macrophage phagocytosis begins | HIGHEST RUPTURE RISK - soft friable wall! |
| 7-10 days | Yellow-tan + soft + depressed red margins | Well-developed phagocytosis + granulation tissue forming | Neovascularisation starts |
| 10-14 days | Red-grey depressed borders | Established granulation tissue + collagen deposition | |
| 2-8 weeks | Grey-white scar forming | Increasing collagen (fibrosis) replacing granulation tissue | |
| >2 months | White, firm SCAR | Dense collagenous scar | Healed infarct |
Exam critical: Rupture risk is HIGHEST at 3-7 days - the myocardium is soft, friable granulation tissue at maximal lysis!
7. CARDIAC BIOMARKERS - Timing
BIOMARKER RISE TIMELINE AFTER MI:
(Time from symptom onset)
Troponin I/T:
Rise: 2-4 hours
Peak: 48 hours (12 hours for high-sensitivity troponin)
Return to normal: 7-10 days
← GOLD STANDARD for MI diagnosis
CK-MB (Creatine Kinase-MB):
Rise: 2-4 hours
Peak: 24-48 hours
Return to normal: ~72 hours (3 days)
← Useful to detect REINFARCTION (shorter window)
Myoglobin:
Rise: 1-3 hours (EARLIEST marker)
Return to normal: 24 hours
NOT cardiac specific (also rises in skeletal muscle injury)
← Useful for early rule-out in first 2-3 hours
LDH:
Rise: 24-48 hours
Peak: 3-6 days
Return to normal: 8-14 days
← Historical marker; LDH-1 > LDH-2 = "flipped LDH" pattern in MI
Cardiac tech exam point: Troponin is the gold standard. With reperfusion (thrombolysis/PCI), both troponin AND CK-MB peak earlier due to washout from necrotic tissue.
8. ECG CHANGES IN MI - Coronary Territory Correlation
ECG Lead-to-Territory Correlation (Draw This!):
ECG LEADS WALL AFFECTED CORONARY ARTERY
──────────────────────────────────────────────────────────
V1-V4 Anterior/Septal LAD (Left Anterior Descending)
V5-V6 + I + aVL Lateral LCX (Left Circumflex)
II, III, aVF Inferior RCA (Right Coronary Artery) - 80%
or LCX (20%)
V1-V4 + II,III,aVF Anteroinferior LAD (wrapping) / Dominant RCA
R in V1, ST↓ V1-V3 Posterior RCA or LCX posterior branches
Sequence of ECG Changes in STEMI:
Minutes: Peaked (hyperacute) T-waves
Hours: ST ELEVATION (convex upward "tombstone" pattern)
Hours-Days: Q wave formation (>1 small square wide, >1/4 R height)
T-wave inversion
Days-Weeks: ST returns to baseline
Permanent: Q waves remain (marker of old infarction)
High-yield: Q waves = transmural, irreversible myocardial damage. A "new" Q wave = acute STEMI or old scar.
Reciprocal Changes:
- ST elevation in leads facing the infarct = primary changes
- ST depression in leads on the opposite side = reciprocal changes (supports diagnosis)
- e.g., Inferior STEMI: ST↑ in II, III, aVF + ST↓ in I, aVL
9. COMPLICATIONS OF MI - Master Table
COMPLICATIONS OF MI - Timeline
IMMEDIATE (0-24 hrs):
├── Arrhythmias (90% of patients!) ← Most common complication overall
│ VF is most common cause of DEATH in first hour
│ Heart block (especially with inferior MI / RCA occlusion)
│ VT, AF, bradycardia
└── Cardiogenic shock (pump failure; ~10% of transmural MIs)
EARLY (Days 1-7):
├── Myocardial RUPTURE (1-5% of MIs) - peak risk 3-7 days
│ ├── Free wall rupture → haemopericardium → CARDIAC TAMPONADE
│ ├── Ventricular septal rupture → VSD → new harsh pansystolic murmur
│ └── Papillary muscle rupture → acute MITRAL REGURGITATION
│ → new pansystolic murmur at apex
└── Pericarditis (fibrinous, 2-3 days post-MI)
→ Friction rub + pleuritic chest pain
LATE (Weeks-Months):
├── Ventricular ANEURYSM
│ → Thin-walled scar bulges; persistent ST elevation on ECG
│ → Complications: mural thrombus, arrhythmia, heart failure
│ Does NOT rupture (scar tissue)
├── Mural THROMBUS → systemic embolism (stroke, limb ischaemia)
├── DRESSLER SYNDROME (weeks later)
│ Autoimmune pericarditis/pleuritis - antibodies against injured myocardium
│ → Fever, pericardial friction rub, elevated ESR
│ → Treatment: NSAIDs / steroids
└── Chronic IHD / HEART FAILURE
Progressive pump failure from cumulative ischaemic damage
10. MANAGEMENT OF ACS - FULL TREATMENT LADDER
Immediate Management - "MONABCH" Mnemonic:
M - Morphine (IV): pain relief, ↓ sympathetic activation
O - Oxygen: only if SaO₂ <94% (avoid hyperoxia)
N - Nitrates (GTN sublingual/IV): vasodilation, ↓ preload
A - Aspirin 300mg STAT (then 75mg/day): COX-1 inhibition → ↓ TXA₂
B - Beta-blocker (IV Metoprolol then oral): ↓ HR, ↓ O₂ demand, anti-arrhythmic
C - Clopidogrel (or Ticagrelor/Prasugrel) 300-600mg loading dose
H - Heparin (LMWH or UFH): anticoagulation to prevent thrombus extension
STEMI - Reperfusion (The Priority):
STEMI → TIME IS MYOCARDIUM!
↓
Primary PCI (pPCI) ← PREFERRED if available within 120 min
• Balloon angioplasty + drug-eluting stent (DES)
• Target: "door-to-balloon" time <90 minutes
• Better outcomes than thrombolysis
↓
If pPCI not available within 120 min:
THROMBOLYSIS (fibrinolysis)
• Alteplase (tPA), Tenecteplase (TNK-tPA), Streptokinase
• Must be given within 12 hours of symptom onset
• Contraindicated: recent surgery, stroke, active bleeding
↓
After thrombolysis: Transfer for angiography within 3-24 hrs
NSTEMI / Unstable Angina:
Antiplatelet: Aspirin + Ticagrelor (DAPT)
Anticoagulation: LMWH (Enoxaparin) or Fondaparinux
Beta-blocker + ACE inhibitor + Statin
Coronary angiography ± PCI within 72 hours (not emergency like STEMI)
Long-Term Secondary Prevention Post-MI:
| Drug | Mechanism | Benefit |
|---|---|---|
| Aspirin 75mg/day | ↓ TXA₂ → ↓ platelet aggregation | ↓ Recurrent MI/stroke |
| P2Y12 inhibitor (Clopidogrel/Ticagrelor) | ↓ ADP-mediated platelet activation | DAPT for 12 months post-ACS/stent |
| ACE inhibitor (Ramipril) | ↓ Afterload, ↓ ventricular remodelling | ↓ Mortality post-MI (especially if EF reduced) |
| Beta-blocker (Bisoprolol) | ↓ HR, ↑ diastolic filling time, anti-arrhythmic | ↓ Mortality post-MI |
| Statin (Atorvastatin 40-80mg) | ↓ LDL, plaque stabilisation | ↓ Recurrent events |
| Eplerenone / Spironolactone | Aldosterone antagonist | ↓ Mortality post-MI with LV dysfunction |
11. COMPLETE FLOWCHART - CAD TO ACS (Draw This!)
RISK FACTORS (LDL↑, HTN, DM, Smoking)
↓
ATHEROSCLEROSIS (Coronary arteries)
↓
┌──────────────────────────────────┐
↓ ↓
STABLE PLAQUE VULNERABLE PLAQUE
(thick cap, small core) (thin cap, large lipid core)
↓ ↓
Fixed stenosis >70% PLAQUE RUPTURE / EROSION
↓ ↓
STABLE ANGINA Platelet aggregation + Thrombus
(exertional chest pain, ↓ ↓
relieved by rest/GTN) PARTIAL OCCLUSION COMPLETE OCCLUSION
↓ ↓
┌────────┴───────┐ STEMI (transmural)
↓ ↓ ST elevation
Unstable Angina NSTEMI Q waves
(Troponin -) (Troponin+) Reperfuse URGENTLY
ST depression ST dep/
No necrosis T inversion
Subendocardial necrosis
12. KEY FACTS FOR MCQs
| Question | Answer |
|---|---|
| Most common cause of IHD? | Atherosclerosis (>90%) |
| Critical coronary stenosis threshold? | >70% lumen occluded |
| Stable angina → stenosis threshold? | >70% (symptoms on exertion) |
| Unstable angina → no troponin rise? | Correct - troponin negative; no myocyte necrosis |
| NSTEMI vs STEMI - key ECG difference? | NSTEMI = ST depression/T inversion; STEMI = ST elevation |
| STEMI = which type of occlusion? | Complete/total coronary occlusion |
| NSTEMI = which type of occlusion? | Partial/subtotal occlusion |
| First biomarker to rise in MI? | Myoglobin (~1-3 hrs) |
| Gold standard biomarker for MI? | Troponin I or T |
| How long does troponin stay elevated? | 7-10 days |
| Best marker for detecting reinfarction? | CK-MB (returns to normal in 72h) |
| "Door-to-balloon" target time for STEMI? | <90 minutes |
| When is rupture risk highest after MI? | 3-7 days (soft granulation tissue phase) |
| Dressler syndrome occurs when? | Weeks after MI; autoimmune pericarditis |
| Most common cause of death in first hour of MI? | Ventricular fibrillation (arrhythmia) |
| VSD post-MI: what do you hear? | New harsh pansystolic murmur at left sternal edge |
| Papillary muscle rupture post-MI: what happens? | Acute severe mitral regurgitation |
| Ventricular aneurysm: ECG finding? | Persistent ST elevation (even weeks after MI) |
| Prinzmetal angina: mechanism? | Coronary vasospasm; ST elevation during episode |
| Aspirin mechanism in ACS? | Irreversibly blocks COX-1 → ↓ TXA₂ → ↓ platelet aggregation |
| DAPT means? | Dual Antiplatelet Therapy = Aspirin + Clopidogrel/Ticagrelor |
13. SELF-TEST (Do Before Day 14)
- Draw the full ACS flowchart from plaque rupture to STEMI/NSTEMI/Unstable Angina with ECG and troponin changes
- A patient presents with central chest pain at rest. ECG shows ST elevation in leads II, III, aVF. Which artery is likely occluded? What is the immediate management?
- Explain why the same patient also has ST depression in leads I and aVL
- A patient has an MI on Day 5. Suddenly develops a new pansystolic murmur and cardiogenic shock. What is the diagnosis?
- Draw the biomarker timeline graph for Myoglobin, Troponin, and CK-MB from hour 0 to day 14
- Explain why Dressler syndrome occurs and how it differs from early post-MI pericarditis
Day 12