
Give me a short note on Concept of lead time for PSM theory exam for 7 marks including Parks heading
Concept of Lead Time
Definition
Background - Why Lead Time Matters in Screening
- The severity of the disease
- The success of treatment in reversing the disease process
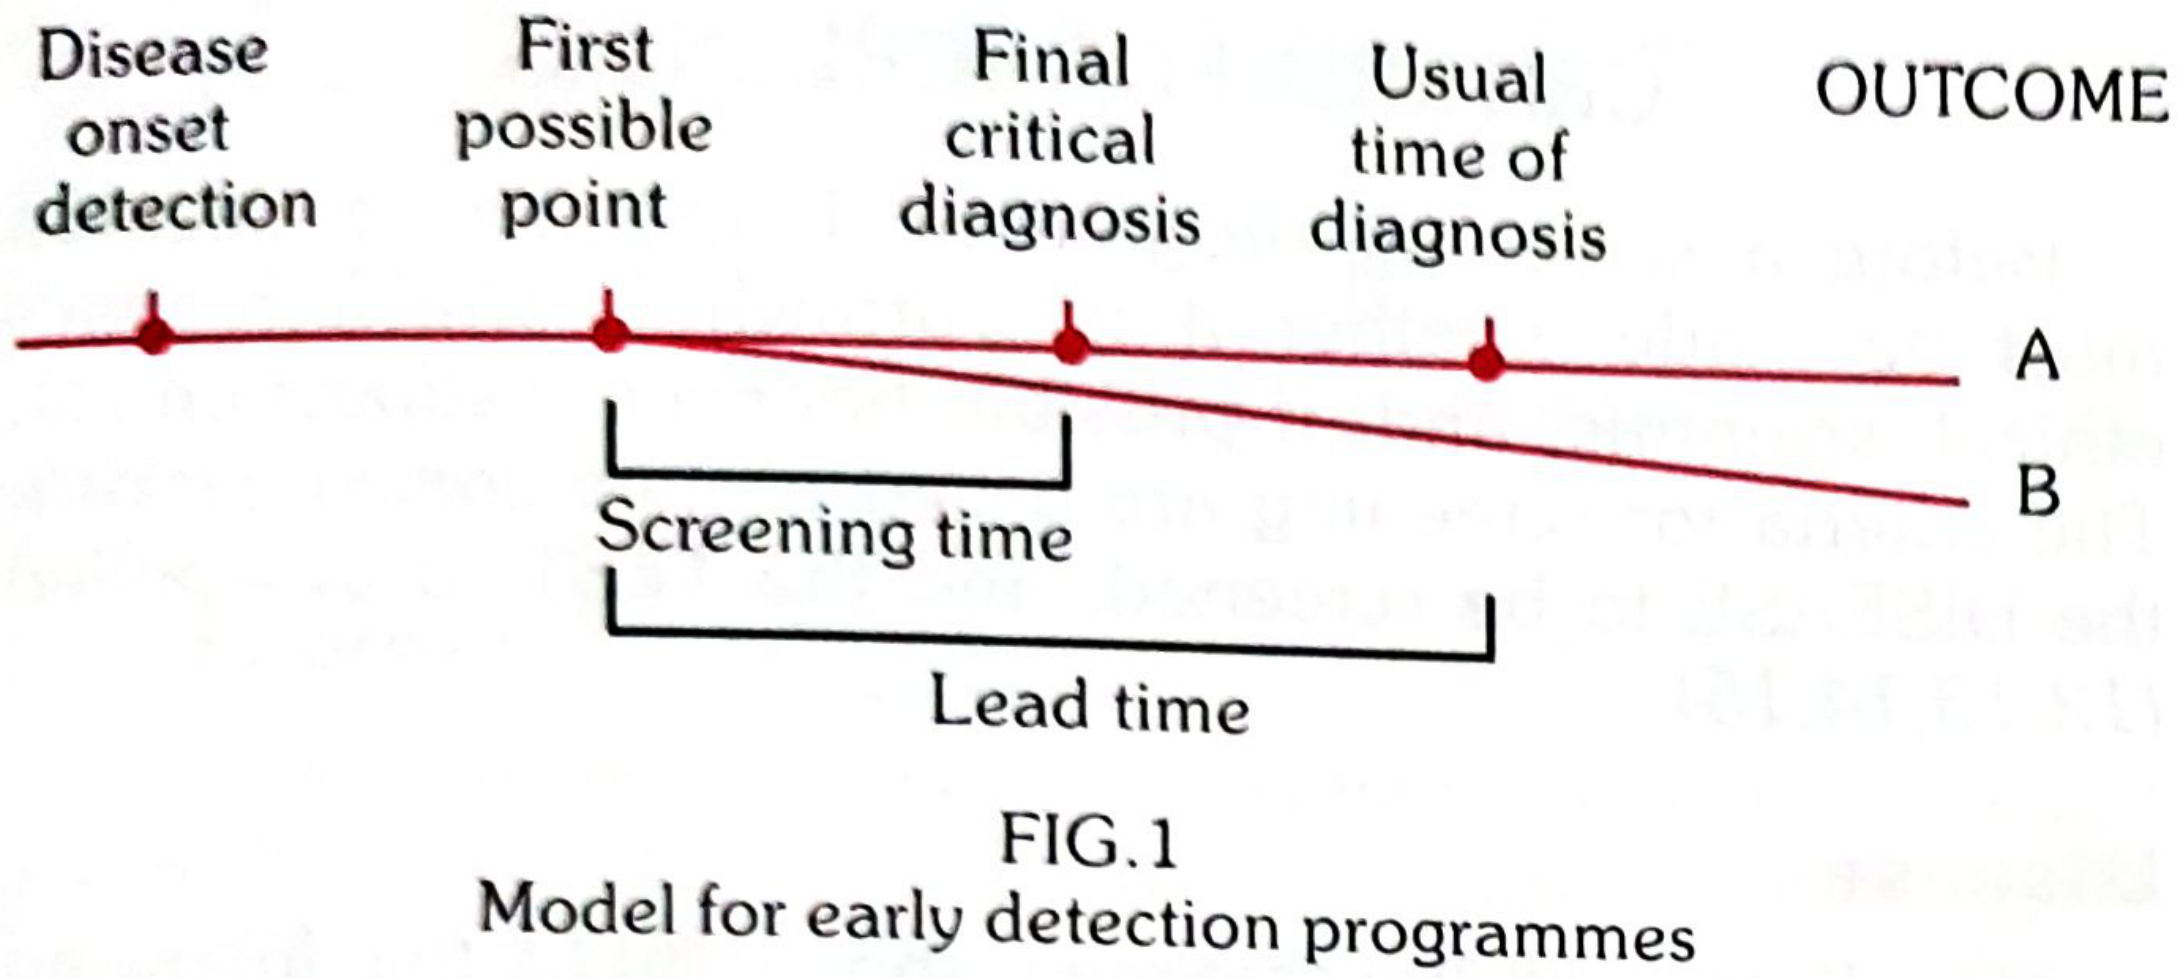
The Model for Early Detection Programmes (Fig. 1)
| Point | Description |
|---|---|
| Disease onset/detection | Earliest biological onset of disease |
| First possible point | Earliest point at which the disease can be detected by screening |
| Final critical point (diagnosis) | The last point beyond which treatment will be unsuccessful or permanent damage is irreversible |
| Usual time of diagnosis | When disease is diagnosed based on symptoms (without screening) |
- Line A = Usual outcome without screening
- Line B = Outcome when disease is detected at the earliest possible moment by screening
- Benefit of screening = B - A (the difference in outcomes)
Key Principles
-
Screening is worthwhile only if detection precedes the final critical point - there is little value in detecting a disease if the critical window for effective treatment has already passed.
-
Screening programmes should concentrate on diseases where the time lag between onset and the final critical point is sufficiently long to make population-wide screening feasible and beneficial.
-
There is nothing to be gained by screening for diseases whose onset is quite obvious or symptomatic from the start.
-
The benefits of any detection programme must be viewed against its complexities and costs. Lead time quantifies the potential benefit in terms of improved outcomes.
Lead-Time Bias
- Screening may appear to increase survival time after diagnosis merely because disease is diagnosed earlier, not because the disease course has actually been altered.
- For example: if a cancer is detected 2 years earlier by screening but the patient dies at the same time as they would have without screening, the apparent "survival" is longer but no real benefit has occurred.
- This bias must be accounted for when assessing screening programme outcomes - improvements in stage distribution and survival from diagnosis can be misleading without correcting for lead time.
Summary (Exam Point)
Lead time = the period between detection of disease by screening and detection by usual clinical means (symptoms). It represents the head start given by screening. A longer lead time means more opportunity for effective intervention - but the benefit is real only if that time is used to treat the disease before its final critical point is reached.
- Park's Textbook of Preventive and Social Medicine, p. 155
Give me a short note on Sreening test diagnostic criteria for PSM theory exam for 7 marks including Parks heading
Criteria for Screening / Screening Test - Diagnostic Criteria
Introduction
- The DISEASE to be screened
- The TEST to be applied
I. Criteria Related to the DISEASE
- The condition should be an important health problem (prevalence should generally be high)
- There should be a recognizable latent or early asymptomatic stage
- The natural history of the condition, including progression from latent to declared disease, should be adequately understood
- There should be a test that can detect the disease prior to the onset of signs and symptoms
- Facilities should be available for confirmation of the diagnosis
- There should be an effective treatment available
- There should be an agreed-upon policy concerning whom to treat (e.g., borderline diabetes, lower ranges of blood pressure)
- There should be good evidence that early detection and treatment reduces morbidity and mortality
- The expected benefits (lives saved) should exceed the risks and costs
II. Criteria Related to the SCREENING TEST
1. Acceptability
- Since high cooperation is needed, the test must be acceptable to the target population
- Tests that are painful, discomforting or embarrassing (e.g., rectal or vaginal examinations) are less acceptable for mass campaigns
2. Repeatability (Reliability / Precision / Reproducibility)
- Intra-observer variation - variation between repeated observations by the same observer on the same subject at the same time
- Inter-observer variation - variation between different observers examining the same subject/material
3. Validity (Accuracy)
a. Sensitivity
The ability of a test to identify correctly all those who have the disease ("true-positives")
- Formula: Sensitivity = a / (a + c) × 100
- A 90% sensitivity means 90% of diseased persons will give a true-positive result; 10% will give false-negatives
- A highly sensitive test has few false negatives
b. Specificity
The ability of a test to identify correctly those who do NOT have the disease ("true-negatives")
- Formula: Specificity = d / (b + d) × 100
- A 90% specificity means 90% of non-diseased persons will give true-negative results; 10% will be falsely classified as diseased
- A highly specific test has few false positives
The 2×2 Table
| Diseased | Not Diseased | Total | |
|---|---|---|---|
| Test Positive | a (True +ve) | b (False +ve) | a+b |
| Test Negative | c (False -ve) | d (True -ve) | c+d |
| Total | a+c | b+d | a+b+c+d |
4. Predictive Value
- Predictive value of a positive test = a / (a+b) × 100
- Probability that a person with a positive test actually has the disease
- Increases as disease prevalence increases; falls as prevalence declines
- Predictive value of a negative test = d / (c+d) × 100
5. False Negatives and False Positives
| Meaning | Consequence | |
|---|---|---|
| False-Negative | Diseased person told they are disease-free | "False reassurance" - patient may ignore symptoms, delay treatment |
| False-Positive | Healthy person told they have disease | Subjects them to further tests, anxiety, expense; burdens diagnostic facilities and brings discredit to screening programmes |
6. Yield
"Yield" is the amount of previously unrecognized disease diagnosed as a result of screening.
7. Combination of Tests
Summary
| Component | Key Criterion |
|---|---|
| Disease | Important, latent stage exists, effective treatment available |
| Acceptability | Acceptable to the population |
| Repeatability | Consistent results (intra/inter-observer, biological, technical variation) |
| Sensitivity | Detects true positives; low = many false negatives |
| Specificity | Detects true negatives; low = many false positives |
| Predictive Value | Depends on prevalence; falls as prevalence falls |
| Yield | Maximize by targeting high-risk groups |
- Park's Textbook of Preventive and Social Medicine, pp. 156-159
Give me a short note on Evaluation of screening test for PSM theory exam for 7 marks including Parks heading
Evaluation of a Screening Test
Introduction
The 2×2 Table (Foundation of Evaluation)
| Diseased | Not Diseased | Total | |
|---|---|---|---|
| Test Positive | a (True-positive) | b (False-positive) | a+b |
| Test Negative | c (False-negative) | d (True-negative) | c+d |
| Total | a+c | b+d | a+b+c+d |
- a = True positives (diseased + test positive)
- b = False positives (not diseased + test positive)
- c = False negatives (diseased + test negative)
- d = True negatives (not diseased + test negative)
Measures of Evaluation
1. Sensitivity
The ability of a test to correctly identify all those who have the disease (true-positives).
- A 90% sensitivity means 90% of diseased persons will give a true-positive result; the remaining 10% give a false-negative result
- A highly sensitive test has few false negatives
- Sensitivity is low → large number of false negatives
2. Specificity
The ability of a test to correctly identify those who do NOT have the disease (true-negatives).
- A 90% specificity means 90% of non-diseased persons will give a true-negative result; 10% will be falsely classified as diseased
- A highly specific test has few false positives
- Specificity is low → large number of false positives
3. Predictive Accuracy (Predictive Value)
Reflects the diagnostic power of the test. Depends on sensitivity, specificity, AND disease prevalence.
- Probability that a person with a positive test actually has the disease
- Increases as disease prevalence increases; falls as prevalence declines
- Example: Gram-stained cervical smear for gonorrhoea - predictive value was 21%, 47%, and 63% at prevalences of 5%, 15%, and 25% respectively
- Probability that a person with a negative test truly does not have the disease
4. False Negatives and False Positives
| Meaning | Consequence | |
|---|---|---|
| False-Negative | Diseased person told they are normal | "False reassurance" - patient may ignore symptoms, delay treatment; potentially detrimental for serious diseases |
| False-Positive | Healthy person told they have disease | Subjected to further diagnostic tests, anxiety, discomfort and expense; burdens diagnostic facilities; brings discredit to screening programmes |
- Epidemiologist thinks in terms of sensitivity and specificity
- Clinician thinks in terms of false negatives and false positives
5. Percentage of False Negatives and Positives
- % False negatives = c / (a + c) × 100
- % False positives = b / (b + d) × 100
Cut-off Point and Decision Making
- Disease prevalence - When prevalence is high, set the cut-off lower to increase sensitivity
- Nature of the disease:
- For lethal diseases (e.g., cervical cancer, breast cancer) where early detection dramatically improves prognosis → higher sensitivity is preferred, even at expense of specificity (false positives are tolerable, false negatives are not)
- For prevalent diseases where treatment does not markedly alter outcome (e.g., diabetes) → higher specificity is needed (false positives must be limited to avoid overburdening the health system)
| Cut-off (mg/100 ml) | Sensitivity | Specificity |
|---|---|---|
| 80 | 100% | 1.2% |
| 130 | 81.4% | 82.4% |
| 180 | 50% | 99.8% |
| 200 | 37.1% | 100% |
6. Yield
"Yield" = the amount of previously unrecognized disease diagnosed as a result of screening effort.
7. Combination of Tests
- Sequential/serial testing: All screened by a high-sensitivity test first (e.g., RPR for syphilis), then positives retested by a high-specificity test (e.g., FTA-ABS) → final positives are true cases
- Parallel testing: Multiple tests done simultaneously; improves sensitivity
Summary Table
| Measure | Formula | What It Tells You |
|---|---|---|
| Sensitivity | a/(a+c) ×100 | How well test finds true cases |
| Specificity | d/(b+d) ×100 | How well test excludes non-cases |
| PV of positive test | a/(a+b) ×100 | Probability positive = truly diseased |
| PV of negative test | d/(c+d) ×100 | Probability negative = truly normal |
| % False negative | c/(a+c) ×100 | Missed cases |
| % False positive | b/(b+d) ×100 | Over-diagnosis |
- Park's Textbook of Preventive and Social Medicine, pp. 157-161
Give me a short note on Vaccine vial monitor for PSM theory exam for 7 marks including Parks heading
Vaccine Vial Monitor (VVM)
Definition
Principle / How It Works
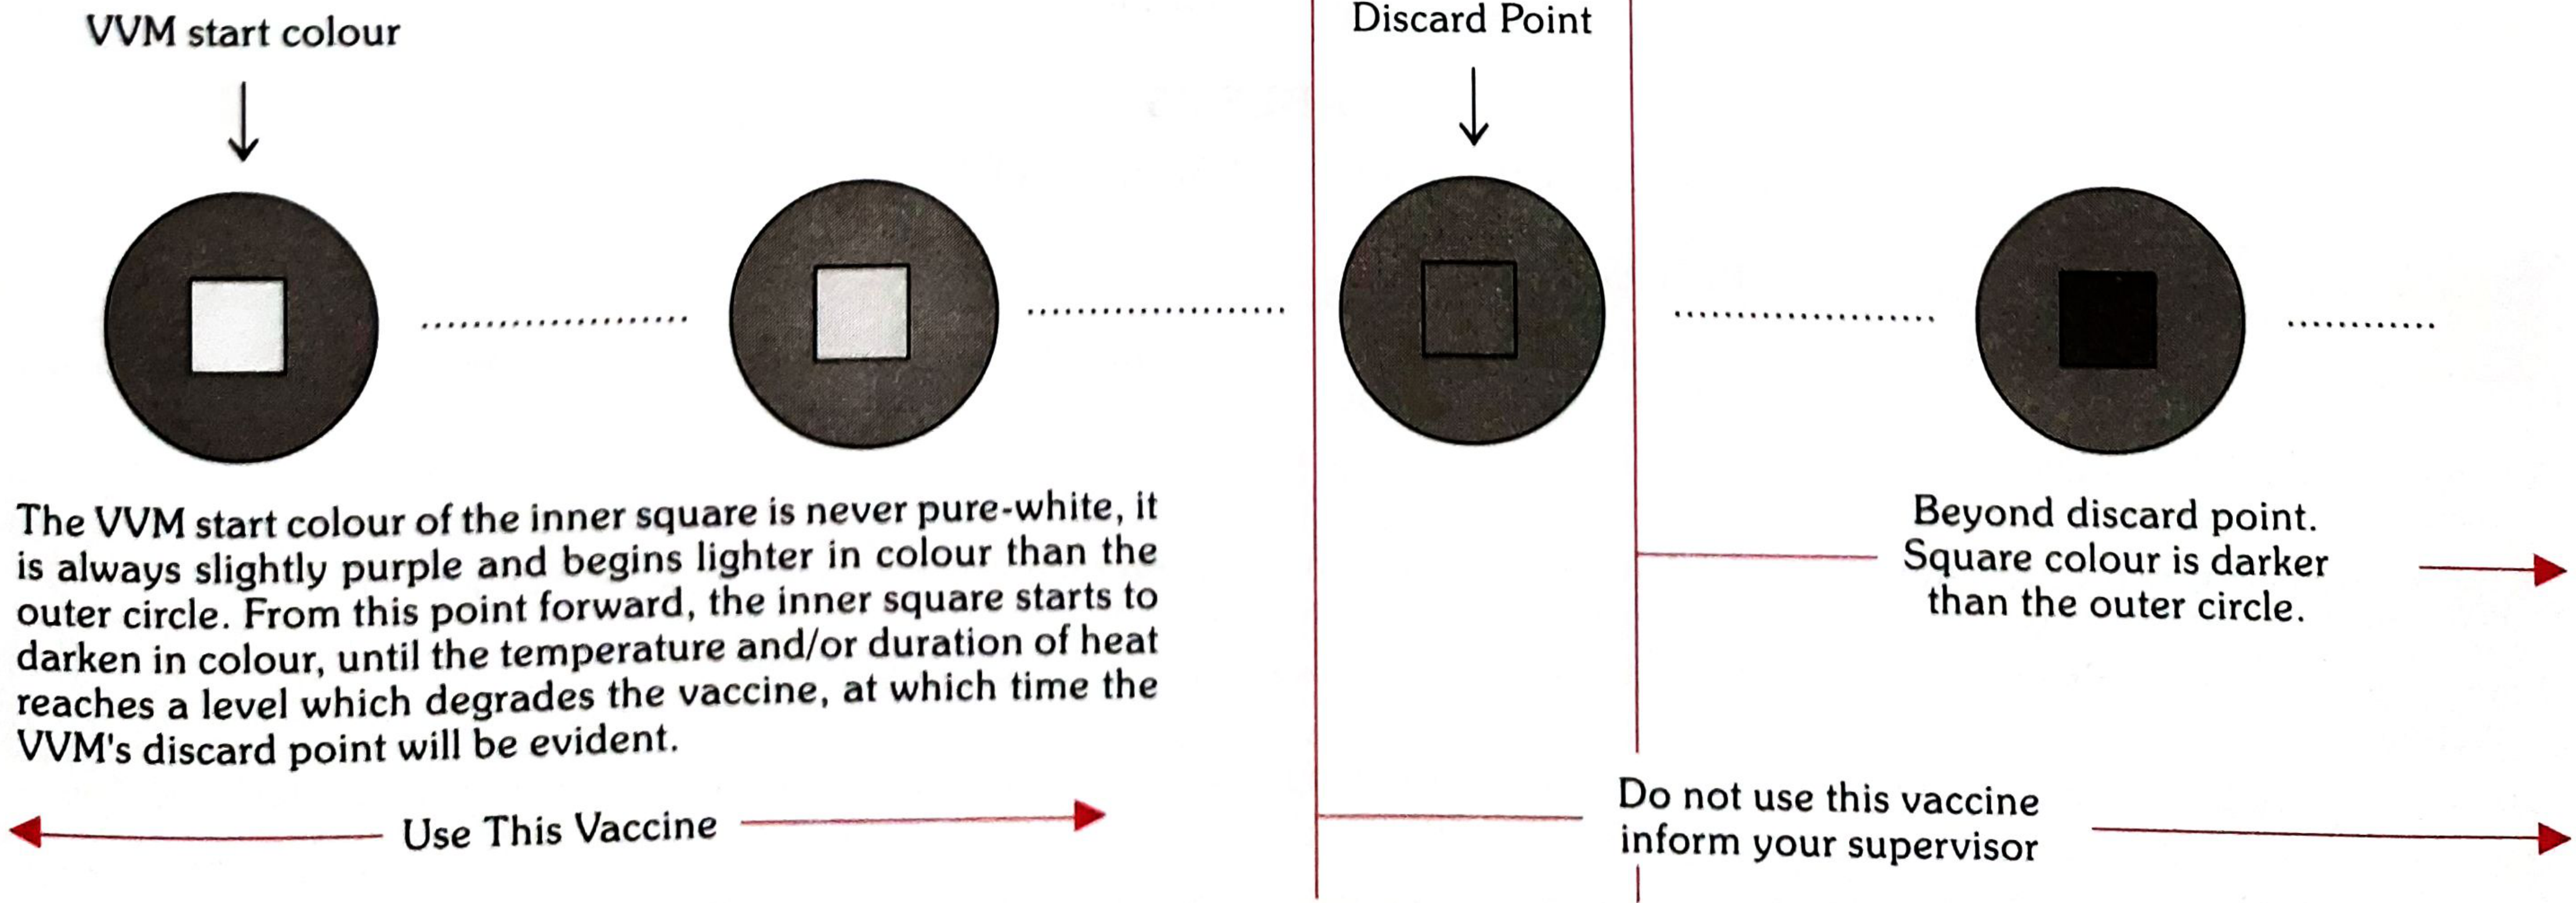
- An outer circle (dark/reference colour)
- An inner square (starts lighter - slightly purple, never pure white)
- If the inner square is lighter than the outer circle → vaccine is usable
- If the inner square colour matches or is darker than the outer circle → discard the vaccine; do not use; inform supervisor
Fig. 22 - VVM Colour Change Sequence
Types of VVM
| Type | Meaning |
|---|---|
| VVM2 | Inner square reaches discard colour in 2 days at 37°C |
| VVM7 | Inner square reaches discard colour in 7 days at 37°C |
| VVM14 | Inner square reaches discard colour in 14 days at 37°C |
| VVM30 | Inner square reaches discard colour in 30 days at 37°C |
Purposes / Uses of VVM
- Primary purpose: To ensure that heat-damaged vaccines are NOT administered to beneficiaries
- To decide which vaccines can safely be kept after a cold chain break - minimizing unnecessary vaccine wastage
- To decide the priority of use - a batch showing greater heat exposure should be used BEFORE a batch with lower heat exposure, even if the latter has a longer expiry date
- Helps health workers at the field level make on-the-spot decisions without laboratory equipment
Important: VVMs do NOT measure exposure to freezing temperature
Location of VVM on the Vial and Implications
| Location of VVM | Implication for Multi-dose Vial |
|---|---|
| On the label of the vaccine vial (WHO-prequalified) | Once opened, vial can be kept for subsequent sessions up to 28 days |
| Other location (e.g., cap or neck of ampoule) | Once opened, vial must be discarded at end of session or within 6 hours, whichever comes first |
VVM in Open Vial Policy (2015)
- Expiry date has not passed
- Vaccines stored under appropriate temperatures
- Aseptic technique maintained
- VVM has NOT reached discard point (a mandatory condition)
- Vial not exposed to direct sunlight
VVM in Pulse Polio Immunization (PPI)
Significance / Advantages
- Simple, easy to read - can be used by field-level health workers without training in laboratory techniques
- Provides a real-time cumulative record of heat exposure throughout the supply chain
- Reduces vaccine wastage by allowing safe use of vaccines after cold chain breaks when VVM still indicates usability
- Improves quality assurance in immunization programmes
- Particularly important in low-resource settings where continuous cold chain maintenance is difficult
Summary
A VVM is a heat-sensitive label on vaccine vials that changes colour with cumulative heat exposure. The inner square darkening to match the outer circle = discard point. Four types (VVM2, 7, 14, 30) are matched to vaccine heat sensitivity. VVMs are the backbone of quality assurance in the cold chain, ensuring only potent vaccines reach beneficiaries.
- Park's Textbook of Preventive and Social Medicine, p. 125
Give me a short note on concept of disease surveillance in public health for PSM theory exam for 7 marks including Parks heading
Concept of Disease Surveillance in Public Health
Definition
"Continuous analysis, interpretation, and feedback of systematically collected data, generally using methods distinguished by their practicality, uniformity, and rapidity rather than by accuracy or completeness."
"Systematic and continuous collection, analysis, and interpretation of data, closely integrated with the timely and coherent dissemination of the results to those who have the right to know so that action can be taken."
"The continuous scrutiny of all aspects of occurrence and spread of disease that are pertinent to effective control."
Key Features
- Continuous and ongoing (distinguished from monitoring, which is episodic/intermittent)
- Action-oriented - data must lead to public health response
- Concerned with trends in time, place, and person
- Wider than passive case reporting - it includes laboratory confirmation, source finding, contact identification and evaluation of control measures
Sources of Data for Surveillance
- Mortality and morbidity reports (death certificates, hospital records)
- General practice sentinels / notifications
- Laboratory diagnosis reports
- Outbreak investigation reports
- Vaccine uptake and side-effects data
- Sickness absence records
- Changes in disease agents, vectors, or reservoirs
- Serological surveillance through serum banks (biological monitoring)
Types / Levels of Surveillance
| Type | Description | Example |
|---|---|---|
| Individual surveillance | Surveillance of infected persons until no longer a risk to others | Quarantine/isolation monitoring |
| Local population surveillance | Surveillance at local/district level | Malaria surveillance |
| National surveillance | Nationwide monitoring of disease trends | Smallpox post-eradication surveillance |
| International surveillance | WHO-level; timely warnings to national governments | Influenza, polio, malaria |
Sentinel Surveillance
- Using selected interested and competent physicians/institutions in chosen areas to report cases
- Extrapolating sentinel data to the entire population to estimate true disease prevalence
- Minimizing reporting biases and simplifying feedback of information to providers
Components of Surveillance Activity
- Collection of data - systematic, using standard case definitions
- Compilation of data - aggregation and organization
- Analysis and interpretation - identifying trends, clusters, outbreaks
- Follow-up action - Rapid Response Team deployment, control measures
- Feedback - dissemination to health authorities and implementers
Purposes / Uses of Disease Surveillance
- Recognize cases or clusters to initiate interventions and prevent transmission
- Assess the public health impact of health events and measure trends
- Demonstrate need for public health intervention programmes and guide resource allocation
- Monitor effectiveness of prevention and control measures
- Identify high-risk groups or geographic areas to target interventions
- Develop hypotheses leading to analytic studies about risk factors
Surveillance vs. Monitoring
| Feature | Surveillance | Monitoring |
|---|---|---|
| Nature | Continuous and ongoing | Episodic / intermittent |
| Requirement | Professional analysis and sophisticated judgement | Standardized procedures, can be done by technicians |
| Output | Recommendations for control activities | Tracks achievements, supplies, expenditure |
| Scope | Broad - disease, trends, risk factors | Specific - programme implementation |
Integrated Disease Surveillance Programme (IDSP) - India
- CSU - Central Surveillance Unit (National Centre for Disease Control, Delhi)
- SSU - State Surveillance Units (at each State/UT HQ)
- DSU - District Surveillance Units (at each district)
- 'S' - Syndromic (community-based, by health workers)
- 'P' - Probable (by medical officers)
- 'L' - Laboratory confirmed
Summary
Surveillance is the continuous and systematic collection, analysis, interpretation, and feedback of health data leading to timely public health action. It is the intelligence arm of public health - without surveillance, disease control programmes cannot be rationally designed or evaluated.
- Park's Textbook of Preventive and Social Medicine, pp. 107, 143, 539
Can you give me accurate prompt to get answers of community medicine having headings from park and of enough length to get full marks in theory exam for ChatGpt
The Prompt (copy and paste, replace the topic)
You are an expert in Preventive and Social Medicine (PSM / Community Medicine).
I am a medical student preparing for my theory exam.
Write a detailed short note on: **[YOUR TOPIC HERE]**
Follow these strict instructions:
1. USE PARK'S HEADINGS: Use the exact section/chapter heading from Park's Textbook
of Preventive and Social Medicine (e.g., "Concept of Lead Time",
"Criteria for Screening", etc.) as the main title.
2. SUBHEADINGS: Use subheadings exactly as they appear in Park's textbook
(Definition, Types, Sources of Data, Uses, Components, etc.)
3. LENGTH: Write enough to score full marks in a 7-mark theory exam answer
(approximately 500–700 words minimum, well-structured).
4. CONTENT MUST INCLUDE:
- Definition (with the exact Park's definition and page reference if possible)
- Classification / Types (wherever applicable)
- Detailed explanation of each component/type
- Examples (as given in Park's)
- A summary table wherever applicable
- Any important formulas, diagrams described in text, or mnemonics
5. FORMAT:
- Use bold headings and subheadings
- Use numbered or bulleted lists for clarity
- Use tables where comparison is needed
- End with a concise 2-3 line exam-ready summary
6. SOURCE: Base your answer strictly on Park's Textbook of Preventive and
Social Medicine (latest edition). Do not use other sources.
7. EXAM STYLE: Write in a clear, exam-oriented style - not too casual,
not overly academic. Suitable for MBBS/MD theory paper.
How to Use It
[YOUR TOPIC HERE] with your topic. Examples:Write a detailed short note on: **Vaccine Vial Monitor (VVM)**Write a detailed short note on: **Evaluation of a screening test**Write a detailed short note on: **Disease surveillance in public health**Write a detailed short note on: **Epidemiological triad**Write a detailed short note on: **Herd immunity**
Pro Tips
- If ChatGPT gives a short answer, add: "Expand this answer to at least 600 words with more detail from Park's textbook"
- If the headings don't match Park's, add: "Rewrite using the exact headings from Park's PSM textbook"
- For 10-mark long answers, change "7-mark" to "10-mark (approximately 800–1000 words)" in the prompt
- For diagrams, add: "Describe any relevant figures or diagrams from Park's in text form"
Give me a short note on Cohort study for PSM theory exam for 7 marks including Parks heading
COHORT STUDY
Definition / Introduction
Concept of Cohort
- Birth cohort - all those born in the same year (e.g., birth cohort of 2010)
- Exposure cohort - persons exposed to a common drug, vaccine or infection
- Marriage cohort - persons married in the same time period
Distinguishing Features
- Cohorts are identified prior to the appearance of the disease under investigation
- The study groups are observed over a period of time to determine frequency of disease
- The study proceeds forward from cause to effect (unlike case-control which goes from effect to cause)
Framework of a Cohort Study
| Cohort | Disease: Yes | Disease: No | Total |
|---|---|---|---|
| Exposed to putative aetiologic factor | a | b | a+b |
| Not exposed to putative aetiologic factor | c | d | c+d |
- Study cohort = group exposed to the factor (a+b)
- Control cohort = group not exposed (c+d)
- Both groups are followed over time under identical conditions
- At the end, incidence rates are calculated:
- Incidence in exposed = a/(a+b)
- Incidence in non-exposed = c/(c+d)
- If incidence in exposed >> non-exposed → association is suggested
- Relative Risk (RR) = [a/(a+b)] / [c/(c+d)]
Types of Cohort Studies
1. Prospective Cohort Study
- Cohort is assembled in the present and followed into the future
- Exposure is assessed at the start; disease outcome is awaited
- Example: Doll & Hill's study (1951) - assembled 40,000 British doctors, followed them for smoking habits and lung cancer outcomes
- Also: Framingham Heart Study (prospective cohort study on cardiovascular risk factors)
2. Retrospective (Historical) Cohort Study
- Both exposure and outcome have already occurred at the time of investigation
- The investigator looks back in time using past records to identify the cohort
- Less expensive and yields results faster than prospective studies
- Example: Study of radiation exposure among workers in nuclear plants using employment records
3. Combination (Ambispective) Cohort Study
- Both retrospective and prospective elements are combined
- Cohort identified from past records, assessed for current outcome, then followed prospectively
- Example: Court-Brown and Doll (1957) - assembled a cohort of 13,352 patients who received radiation therapy for ankylosing spondylitis (1934-1954), evaluated deaths from leukaemia between 1935-1954, then followed the cohort prospectively from 1955 onwards
Indications for Cohort Studies
- (a) There is good evidence of association between exposure and disease (from clinical observation and case-control studies)
- (b) Exposure is rare but incidence of disease is high among the exposed (e.g., radiologists exposed to X-rays)
- (c) Attrition can be minimized - follow-up is easy, cohort is stable, co-operative and accessible
- (d) Ample funds are available
Elements of a Cohort Study
- Selection of study subjects - from general population (e.g., Framingham) or special/exposure groups (e.g., doctors, nurses, industrial workers)
- Obtaining data on exposure - by interviews, mailed questionnaires, review of records, medical examination, or environmental surveys
- Selection of comparison groups - general population or another unexposed cohort comparable in all other respects
- Follow-up - both groups followed under identical conditions over time (years to decades in chronic disease studies)
- Analysis - calculation of incidence rates, relative risk (RR), and dose-response ratios
Advantages
- (a) Incidence of disease can be directly calculated
- (b) Multiple outcomes related to one exposure can be studied simultaneously (e.g., smoking linked to lung cancer, coronary heart disease, peptic ulcer, oesophageal cancer)
- (c) Provides a direct estimate of Relative Risk (RR)
- (d) Dose-response ratios can be calculated
- (e) Since comparison groups are formed before disease develops, misclassification bias is minimized
Disadvantages
- (a) Involves a large number of people - unsuitable for rare diseases
- (b) Long follow-up required (20-30 years or more for cancer studies) - delayed results
- (c) Administrative problems - loss of staff, funding, and extensive record keeping
- (d) Loss to follow-up - participants may migrate, lose interest, or refuse
- (e) Difficult to select truly comparable control groups
- (f) Changes in diagnostic criteria over prolonged follow-up may affect results
- (g) Expensive
- (h) Study may alter participants' behaviour (e.g., subjects in smoking studies may stop smoking)
- (i) Ethical problems - as evidence accumulates, investigators are obliged to intervene
- (j) Can only study a limited number of factors at a time
Cohort vs. Case-Control: Key Differences
| Feature | Case-Control Study | Cohort Study |
|---|---|---|
| Direction | Effect → Cause | Cause → Effect |
| Starting point | Disease | Exposure |
| Measure of association | Odds Ratio (OR) | Relative Risk (RR) |
| Suitable for | Rare diseases | Rare exposures |
| Number of subjects | Fewer | Larger |
| Time | Quick results | Long follow-up needed |
| Cost | Less expensive | More expensive |
| Incidence | Cannot be calculated | Can be calculated |
| Bias | More susceptible (recall bias) | Less susceptible |
Summary
A cohort study is a forward-looking observational study that follows exposed and unexposed groups over time to measure disease incidence and calculate relative risk. It is the strongest observational design for establishing causality, but is time-consuming, expensive, and unsuitable for rare diseases. The Doll & Hill study on smoking and lung cancer is the classic example.
- Park's Textbook of Preventive and Social Medicine, pp. 87-90