
Light chain amylodosis treatment
"light chain amyloidosis" AND treatment
light chain amyloidosis treatment algorithm daratumumab bortezomib
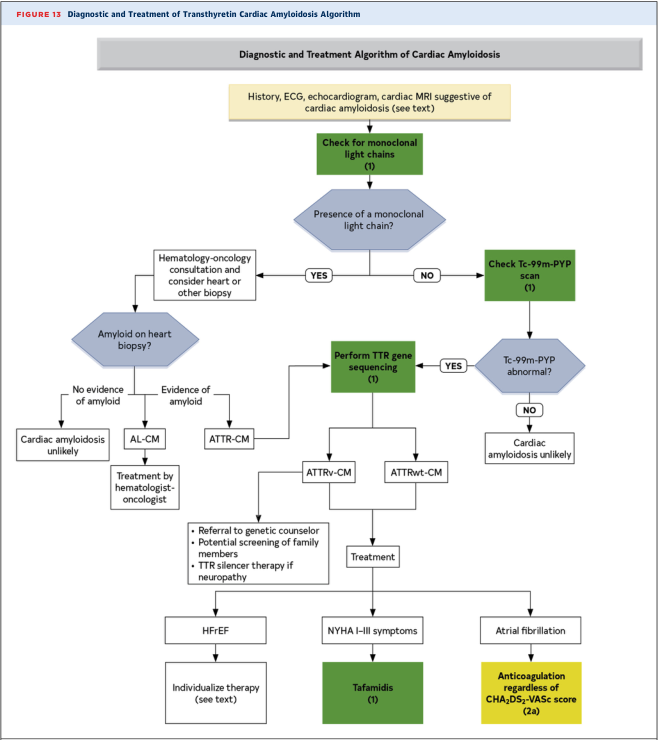
Summary : This figure presents a diagnostic and treatment algorithm for transthyretin cardiac amyloidosis, guiding clinicians through a stepwise evaluation based on clinical suspicion, laboratory findings, imaging, and genetic testing to differentiate between amyloid subtypes and direct appropriate therapy. flowchart: # Nodes : • "History, ECG, echocardiogram, cardiac MRI suggestive of cardiac amyloidosis (see text)" (rectangle, yellow) • "Check for monoclonal light chains (1)" (rectangle, green) • "Presence of a monoclonal light chain?" (diamond, blue) • "Hematology-oncology consultation and consider heart or other biopsy" (rectangle, white) • "Amyloid on heart biopsy?" (diamond, blue) • "No evidence of amyloid" (rectangle, white) • "Cardiac amyloidosis unlikely" (rectangle, white) • "Evidence of amyloid" (rectangle, white) • "AL-CM" (rectangle, white) • "Treatment by hematologist-oncologist" (rectangle, white) • "ATTR-CM" (rectangle, white) • "Check Tc-99m-PYP scan (1)" (rectangle, green) • "Tc-99m-PYP abnormal?" (diamond, blue) • "NO" (rectangle, white) • "Cardiac amyloidosis unlikely" (rectangle, white) • "YES" (rectangle, white) • "Perform TTR gene sequencing (1)" (rectangle, green) • "ATTRv-CM" (rectangle, white) • "Referral to genetic counselor" (rectangle, white, bulleted list: "Potential screening of family members", "TTR silencer therapy if neuropathy") • "HFrEF" (rectangle, white) • "Individualize therapy (see text)" (rectangle, white) • "ATTRwt-CM" (rectangle, white) • "Treatment" (rectangle, white) • "NYHA I-III symptoms" (rectangle, white) • "Tafamidis (1)" (rectangle, green) • "Atrial fibrillation" (rectangle, white) • "Anticoagulation regardless of CHA2DS2-VASc score (2a)" (rectangle, yellow) # Connectors : • The flow starts from the clinical suspicion node, then to checking for monoclonal light chains. • If YES (monoclonal light chain present), proceed to hematology-oncology consultation and biopsy. • If amyloid is found on biopsy, branch to AL-CM (with treatment by hematologist-oncologist) or ATTR-CM. • If NO (no monoclonal light chain), check Tc-99m-PYP scan. • If Tc-99m-PYP is abnormal, perform TTR gene sequencing. • TTR gene sequencing branches to ATTRv-CM (with referral to genetic counselor, family screening, TTR silencer therapy if neuropathy, and HFrEF management) or ATTRwt-CM (with treatment). • For NYHA I-III symptoms, Tafamidis is recommended. • For atrial fibrillation, anticoagulation is recommended regardless of CHA2DS2-VASc score. • If Tc-99m-PYP is not abnormal or no amyloid is found on biopsy, cardiac amyloidosis is deemed unlikely. # Layout : • The flowchart is organized in a top-down manner, with decision diamonds for key diagnostic steps and rectangular nodes for actions or outcomes. • Parallel branches distinguish between monoclonal light chain presence and absence, with further subdivisions based on biopsy and imaging results. • Treatment recommendations are at the bottom, following diagnostic confirmation. # Analysis : • The algorithm emphasizes a systematic approach to diagnosing cardiac amyloidosis, starting with clinical suspicion and noninvasive testing, followed by laboratory and imaging differentiation between AL and ATTR subtypes. • Genetic testing and family counseling are integrated for hereditary forms. • Specific therapies (e.g., Tafamidis, anticoagulation) are highlighted for confirmed cases, with clear exclusion of cardiac amyloidosis when diagnostic criteria are not met.
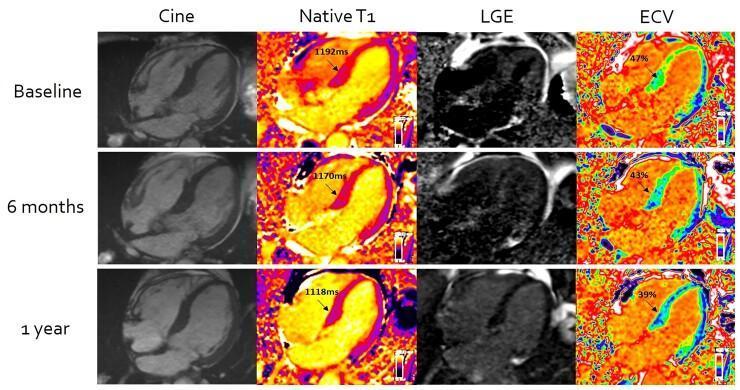
This diagnostic image panel displays serial cardiovascular magnetic resonance (CMR) imaging in a patient with cardiac systemic light-chain (AL) amyloidosis, illustrating tissue characterization changes over a 1-year treatment period. The grid displays four imaging modalities—Cine, Native T1 mapping, Late Gadolinium Enhancement (LGE), and Extracellular Volume (ECV) mapping—across three rows representing Baseline, 6 months, and 1 year post-chemotherapy. The Native T1 mapping shows a progressive decrease in T1 values from 1192ms to 1118ms, visualized by a color shift from warm orange to cooler yellow tones. The LGE column demonstrates a significant reduction in myocardial contrast hyperintensity, indicating regression of amyloid deposition. Correspondingly, the ECV maps show a quantitative decline from 47% at baseline to 39% at one year, reflecting the reduction in the expanded extracellular space. This longitudinal comparison serves as an educational tool for monitoring treatment response in infiltrative cardiomyopathies through advanced parametric mapping and contrast-enhanced imaging techniques.
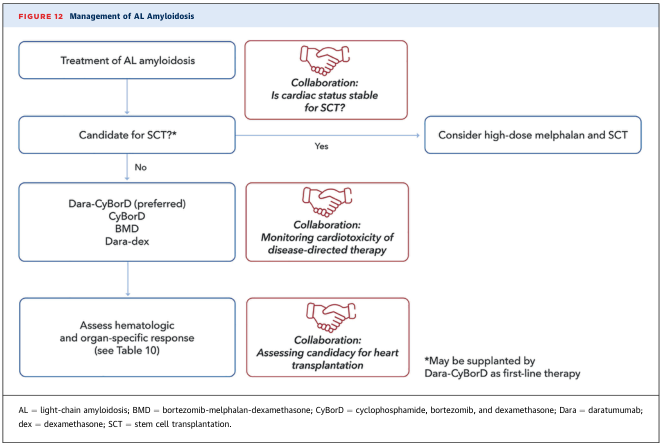
Summary : This flowchart outlines the management of AL (light-chain) amyloidosis, focusing on treatment pathways, candidacy for stem cell transplantation (SCT), and the importance of multidisciplinary collaboration, especially regarding cardiac status and transplantation options. flowchart: # Nodes : • Treatment of AL amyloidosis (rectangle) • Collaboration: Is cardiac status stable for SCT? (rounded rectangle, handshake icon) • Candidate for SCT?* (rectangle) • Yes branch: Consider high-dose melphalan and SCT (rectangle) • No branch: Dara-CyBorD (preferred), CyBorD, BMD, Dara-dex (rectangle) • Collaboration: Monitoring cardiotoxicity of disease-directed therapy (rounded rectangle, handshake icon) • Assess hematologic and organ-specific response (rectangle) • Collaboration: Assessing candidacy for heart transplantation (rounded rectangle, handshake icon) • Footnote: *May be supplanted by Dara-CyBorD as first-line therapy (text box) • Abbreviations: AL, BMD, CyBorD, Dara, dex, SCT (text box) # Connectors : • Downward arrows from "Treatment of AL amyloidosis" to "Candidate for SCT?*" • Rightward arrow from "Candidate for SCT?*" (Yes) to "Consider high-dose melphalan and SCT" • Downward arrow from "Candidate for SCT?*" (No) to "Dara-CyBorD (preferred), CyBorD, BMD, Dara-dex" • Downward arrow from therapy options to "Assess hematologic and organ-specific response" • Collaboration nodes are placed adjacent to decision points and therapy steps, indicating multidisciplinary input at each stage. # Layout : • Vertical flow from top to bottom, with a rightward branch for SCT candidacy. • Collaboration nodes are visually highlighted with handshake icons and red text, placed beside key decision or assessment steps. • Footnotes and abbreviations are at the bottom of the chart. # Analysis : • The flowchart emphasises a decision point based on SCT candidacy, which is determined by cardiac status. • If eligible, patients are considered for high-dose melphalan and SCT; if not, alternative therapies (Dara-CyBorD, CyBorD, BMD, Dara-dex) are used. • Collaboration with cardiology and transplant teams is integral at multiple steps, especially for monitoring cardiotoxicity and assessing heart transplantation candidacy. • The chart highlights the evolving role of Dara-CyBorD as a preferred or first-line therapy. • The process is linear with a single major branch, and collaboration is visually and procedurally central to patient management.
Light Chain (AL) Amyloidosis - Treatment
Overview of Treatment Strategy
- Standard-dose chemoimmunotherapy (for the majority)
- High-dose melphalan + autologous stem cell transplantation (HDM/SCT) (for selected eligible patients)
Risk Stratification Before Treatment
- NT-proBNP and cardiac troponins (cardiac staging)
- dFLC (difference between involved and uninvolved free light chains) - clonal burden
- 24-h urine protein and eGFR (renal staging)
First-Line Treatment
For Transplant-Ineligible Patients (Majority)
| Drug | Dose/Route |
|---|---|
| Daratumumab (anti-CD38 monoclonal Ab) | 1800 mg SC weekly |
| Cyclophosphamide | 300 mg/m² orally weekly |
| Bortezomib (proteasome inhibitor) | 1.3 mg/m² weekly |
| Dexamethasone | 40 mg weekly |
- MDex (melphalan + dexamethasone ± bortezomib): useful when bortezomib is contraindicated (peripheral neuropathy), and can overcome adverse cytogenetics including gain 1q21 and t(11;14)
- Dara-dex: daratumumab + dexamethasone alone
- Lenalidomide or pomalidomide-based combinations: for patients with contraindications to bortezomib
Note: Bortezomib may worsen peripheral neuropathy and can rarely cause acute cardiac toxicity - monitor closely in patients with existing neuropathy or cardiac amyloidosis. - Harrison's, 2025
For Transplant-Eligible Patients (~20-30% of all AL patients)
- Produces complete hematologic response in ~40% of treated patients
- Responses are often durable - some remissions exceed 15 years
- Eligibility criteria: younger patients, minimal cardiac involvement, adequate performance and organ function
- Transplant-related morbidity/mortality is higher than in other hematologic diseases due to impaired organ function at presentation
Treatment Algorithm
Relapsed/Refractory AL Amyloidosis
- Pomalidomide + dexamethasone - reasonable option
- Daratumumab (as single agent in daratumumab-naive patients) - ~75% 2-year survival
- Venetoclax - investigational; high activity in patients with plasma cells harboring t(11;14)
- Ixazomib-dexamethasone or MDex - appropriate if significant neuropathy present
- Lenalidomide (starting dose ≤15 mg/d in this setting) - note: NOT recommended in patients with cardiac involvement
Supportive / Organ-Specific Care
- Diuretics are the mainstay for congestive heart failure
- Relatively contraindicated: digitalis, calcium channel blockers, beta-blockers (can interact with amyloid fibrils causing heart block and worsening heart failure)
- Amiodarone may be used for arrhythmias
- Consider ICD for ventricular arrhythmias
- Diuretics + compression stockings for edema
- ACE inhibitors - use with caution; not proven to slow progression
- Albumin infusions can facilitate effective diuresis
- Kidney transplantation is an option for patients with end-stage renal failure (following hematologic response)
- Orthotopic liver transplantation has been used for mutant transthyretin-related forms (not AL specifically)
- Clotting factor X deficiency (from adsorption to amyloid fibrils) affects 5-10% of patients - monitor for bleeding
Investigational Therapies
- Anti-fibril monoclonal antibodies (targeting the amyloid deposits themselves, not just the plasma cell clone) - currently in clinical trials in combination with Dara-CyBorD. The goal is to dissolve existing fibrils, not just halt further production
- Agents to reverse misfolding of the light chain protein - theoretically ideal but currently investigational
Response Assessment
- Hematologic response: normalization of serum/urine immunofixation and free light chains
- Organ response: resolution of nephrotic syndrome, cardiac failure, hepatomegaly - typically occurs 6-12 months after achieving hematologic remission
- New response criteria (Palladini/Dispenzieri) incorporate dFLC levels to define very good partial, partial, and complete responses