Explain me top 10 heart disease with ecg changes with ECG images of those dieseases
Reading File
Finding Sources
Searching Images
ST elevation myocardial infarction STEMI ECG
Searching Images
atrial fibrillation ECG electrocardiogram
Finding Sources
Searching Images
complete heart block third degree AV block ECG
Searching Images
Wolff-Parkinson-White syndrome WPW delta wave ECG
Searching Images
ventricular tachycardia ECG wide complex tachycardia
Searching Images
hypertrophic cardiomyopathy ECG left ventricular hypertrophy
Searching Images
pulmonary embolism ECG S1Q3T3 right heart strain
Searching Images
long QT syndrome Torsades de Pointes ECG
Searching Images
left bundle branch block LBBB ECG
Searching Images
pericarditis saddle shaped ST elevation diffuse ECG
Here is a comprehensive guide to the Top 10 Heart Diseases with ECG Changes, with real ECG images for each condition.
Top 10 Heart Diseases with ECG Changes
1. ST-Elevation Myocardial Infarction (STEMI)
Mechanism: Acute total occlusion of a coronary artery (most commonly the LAD) causes transmural myocardial injury.
Key ECG Features:
| Feature | Description |
|---|---|
| ST elevation | ≥1 mm in ≥2 contiguous limb leads, or ≥2 mm in ≥2 contiguous precordial leads |
| Morphology | Convex (tombstone) ST elevation — the hallmark |
| Reciprocal changes | ST depression in leads opposite to the infarct zone |
| Hyperacute T waves | Tall, broad, symmetrical T waves — earliest sign |
| Pathological Q waves | Develop within hours; indicate irreversible necrosis |
| Lead localization | V1–V4 = anterior (LAD); II, III, aVF = inferior (RCA); I, aVL, V5–V6 = lateral (LCx) |
ECG Image — Anterior STEMI (LAD occlusion):
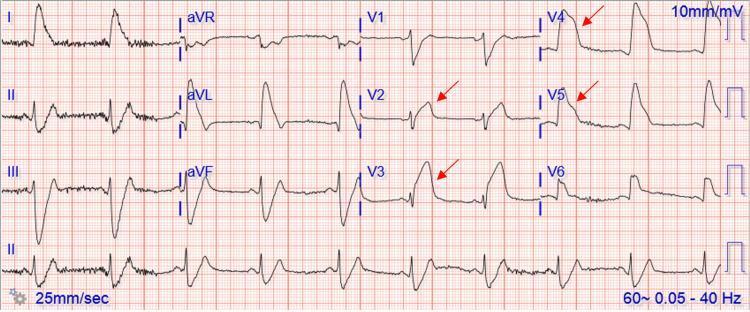
ECG Image — Anterolateral STEMI:

2. Non-ST Elevation Myocardial Infarction (NSTEMI) / Unstable Angina
Mechanism: Partial coronary occlusion causing subendocardial ischemia without transmural injury.
Key ECG Features:
| Feature | Description |
|---|---|
| ST depression | Horizontal or downsloping, ≥0.5 mm in ≥2 contiguous leads |
| T-wave inversion | Symmetrical deep T-wave inversions (especially V1–V4 in anterior ischemia) |
| No pathological Q waves | Subendocardial; no Q waves (unless prior infarct) |
| Wellens' Syndrome | Biphasic or deep T-wave inversions in V2–V3 = LAD critical stenosis |
| Normal ECG possible | ~30% of NSTEMIs have a normal or minimally abnormal ECG |
Clinical pearl: NSTEMI is distinguished from unstable angina only by elevated troponin; the ECG can be identical.
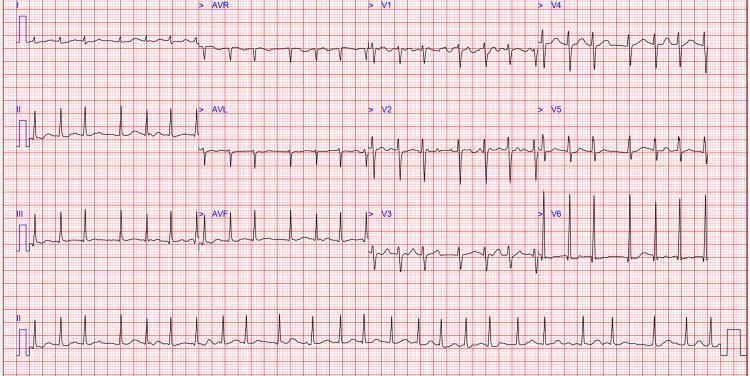
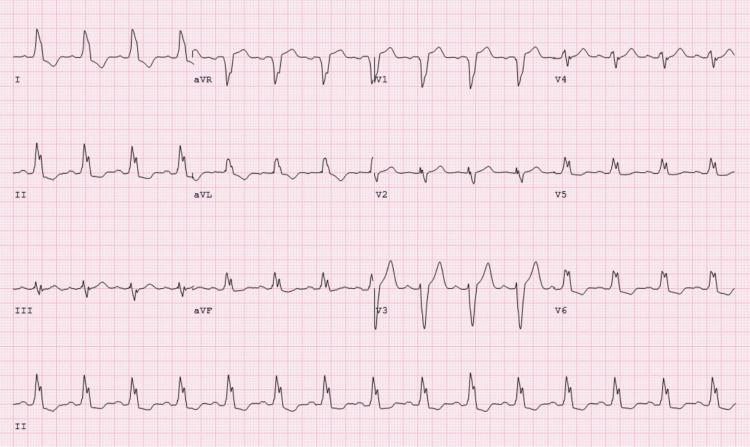
3. Atrial Fibrillation (AF)
Mechanism: Chaotic, disorganized atrial electrical activity from multiple re-entrant wavelets, eliminating effective atrial contraction.
Key ECG Features:
| Feature | Description |
|---|---|
| Absent P waves | Replaced by irregular fibrillatory (f) waves, best seen in V1 and lead II |
| Irregularly irregular rhythm | No two R-R intervals are the same — the pathognomonic finding |
| Narrow QRS | Unless aberrant conduction or pre-existing BBB |
| Ventricular rate | Uncontrolled ~100–160 bpm; controlled if rate-limited |
| f-wave amplitude | Coarse AF (larger f waves) vs. fine AF (difficult to distinguish from flutter) |
ECG Image — Atrial Fibrillation with rapid ventricular response:
4. Complete (Third-Degree) Heart Block
Mechanism: Complete failure of AV conduction — atria and ventricles beat independently. Escape pacemaker takes over ventricular activity.
Key ECG Features:
| Feature | Description |
|---|---|
| AV dissociation | P waves march through at their own rate, completely unrelated to QRS |
| Atrial rate > ventricular rate | Typical atrial rate 60–100 bpm; ventricular escape 20–50 bpm |
| Wide QRS escape | If escape from His-Purkinje (ventricular) — wide QRS >120 ms |
| Narrow QRS escape | If junctional escape (above bifurcation of His bundle) — narrow QRS |
| Regular escape rhythm | Ventricular rate is regular, just independent of P waves |
ECG Image — Third-Degree (Complete) Heart Block:
5. Wolff-Parkinson-White (WPW) Syndrome
Mechanism: An accessory bypass tract (Bundle of Kent) conducts impulses from atria to ventricles bypassing the AV node, causing ventricular pre-excitation.
Key ECG Features (Classic Triad):
| Feature | Description |
|---|---|
| Short PR interval | <120 ms — AV node delay bypassed |
| Delta wave | Slurred upstroke at the beginning of QRS — early ventricular activation via accessory pathway |
| Wide QRS | >120 ms due to fusion of normal and pre-excited activation |
| Secondary ST-T changes | ST depression and T-wave inversion discordant to delta wave |
| Pseudo-infarct pattern | Negative delta waves in inferior leads can mimic Q waves |
Danger: WPW with AF can conduct rapidly via the accessory pathway → ventricular fibrillation.
ECG Image — WPW Syndrome:
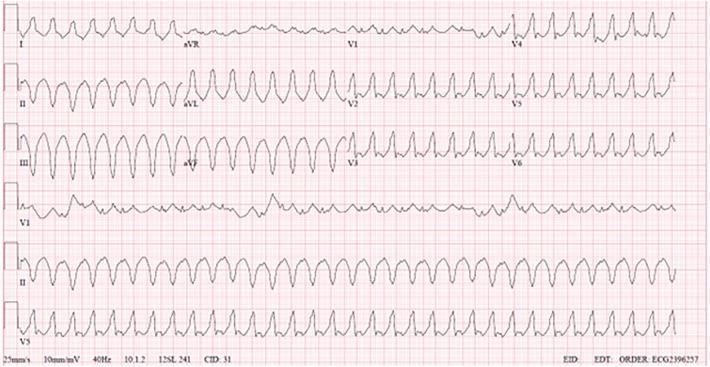
6. Ventricular Tachycardia (VT)
Mechanism: Rapid ectopic ventricular rhythm (≥3 consecutive beats, rate >100 bpm) originating below the bundle of His, most often in structurally diseased myocardium.
Key ECG Features:
| Feature | Description |
|---|---|
| Wide QRS tachycardia | QRS >120 ms, rate 100–250 bpm |
| AV dissociation | Independent P waves (when visible) — most specific sign of VT |
| Fusion beats | Normal and ectopic beats fuse — pathognomonic of VT |
| Capture beats | Sinus impulse transiently captures ventricle — narrow QRS amid wide ones |
| Concordance | Positive concordance (all precordial QRS positive) or negative concordance = VT |
| Brugada criteria | RS absent in precordials OR RS interval >100 ms = VT |
ECG Image — Monomorphic Ventricular Tachycardia:
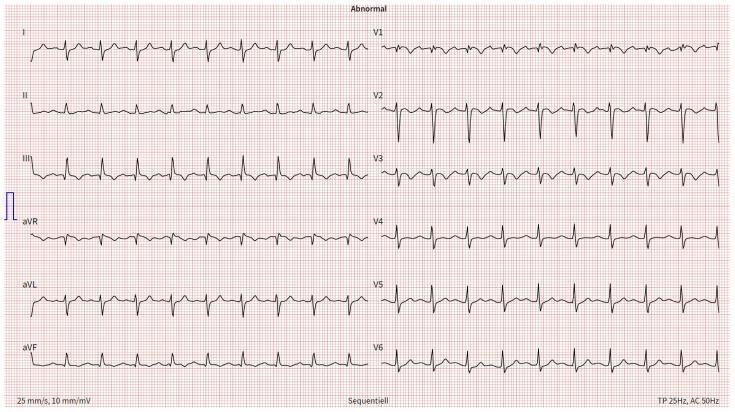
7. Hypertrophic Cardiomyopathy (HCM)
Mechanism: Genetic sarcomere mutation causing asymmetric septal (or apical) hypertrophy, myofiber disarray, and impaired diastolic filling with outflow obstruction.
Key ECG Features:
| Feature | Description |
|---|---|
| LVH voltage criteria | Sokolow-Lyon index (S in V1 + R in V5/V6) ≥35 mm |
| Left axis deviation | Common in septal HCM |
| Deep T-wave inversions | Giant ("Berserk") T-wave inversions in V3–V6 = apical HCM (Yamaguchi syndrome) |
| Absent septal Q waves | No q waves in I, aVL, V5–V6 (abnormal septal activation) |
| Strain pattern | ST depression + T-wave inversion in lateral leads |
| Deep Q waves | In inferior and lateral leads — mimic infarction |
ECG Image — Apical HCM (Yamaguchi syndrome):
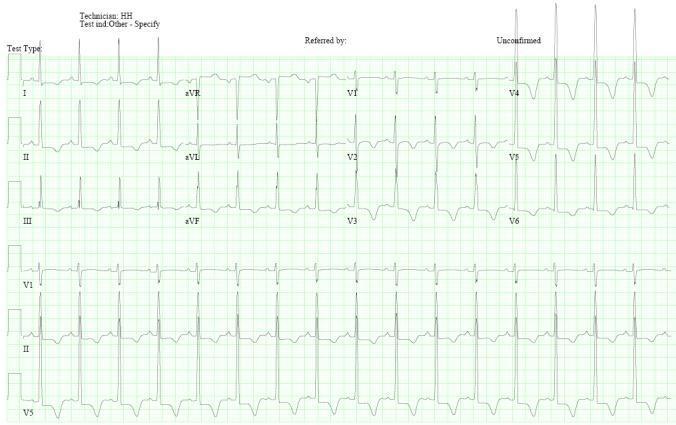
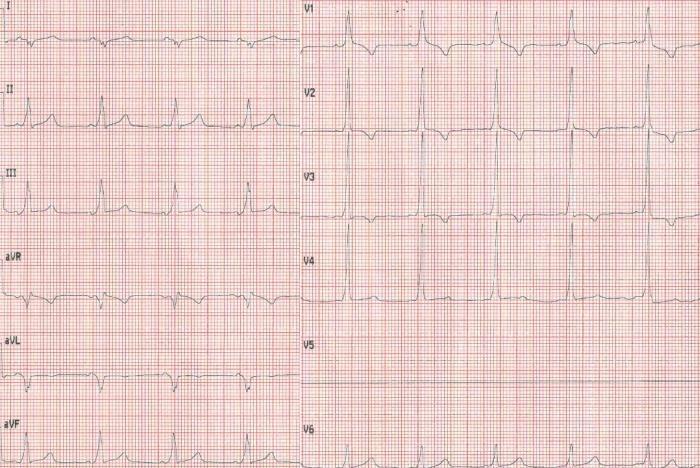
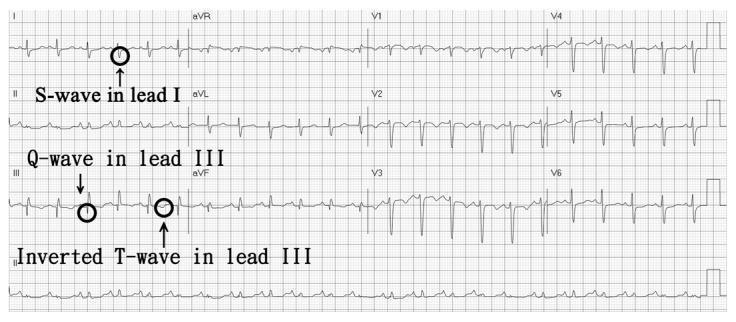
8. Pulmonary Embolism (PE)
Mechanism: Massive pulmonary arterial obstruction → acute right ventricular pressure overload → right heart strain → characteristic but non-specific ECG changes.
Key ECG Features:
| Feature | Description |
|---|---|
| Sinus tachycardia | Most common finding (~40% of PE cases) |
| S1Q3T3 pattern | Deep S wave in lead I + Q wave in lead III + T-wave inversion in lead III |
| Right axis deviation | Shift toward right due to RV strain |
| RBBB (incomplete/complete) | Acute RV pressure overload dilates the bundle branch |
| T-wave inversions V1–V4 | Right precordial T inversions reflecting RV strain |
| P pulmonale | Tall, peaked P waves in inferior leads >2.5 mm |
ECG Image — Pulmonary Embolism with S1Q3T3:
ECG Image — PE with diffuse right heart strain:
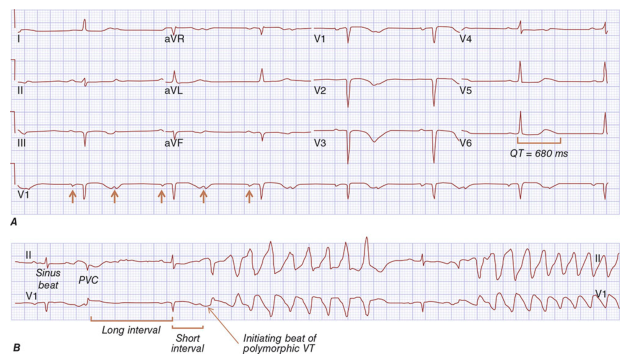
9. Long QT Syndrome (LQTS) & Torsades de Pointes
Mechanism: Prolonged ventricular repolarization (congenital channelopathy or drug-induced) → triggered activity → polymorphic VT that "twists" around the isoelectric line.
Key ECG Features:
| Feature | Description |
|---|---|
| Prolonged QTc | >440 ms (men), >460 ms (women) — corrected for rate by Bazett's formula |
| QTc >500 ms | High risk for TdP |
| Prominent U waves | Especially in V2–V3 (LQT2 subtype) |
| T-wave alternans | Beat-to-beat variation in T-wave amplitude/polarity |
| Torsades de Pointes | Polymorphic VT with characteristic twisting of QRS axis around isoelectric line |
| Short-long-short initiation | Pause-dependent triggering of TdP |
ECG Image — Long QT Syndrome with Torsades de Pointes:
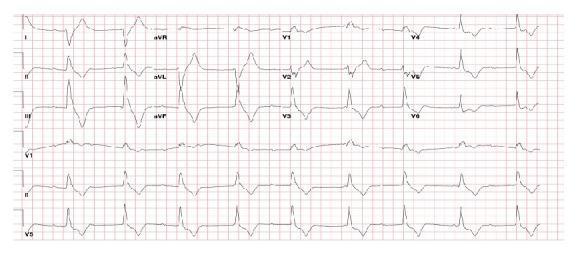
10. Acute Pericarditis
Mechanism: Pericardial inflammation causes epicardial current injury affecting repolarization diffusely (unlike STEMI, which is regional).
Key ECG Features (4 Stages):
| Stage | Features |
|---|---|
| Stage 1 (acute) | Diffuse concave ("saddle-shaped") ST elevation in most leads + PR depression |
| Stage 2 (days) | ST normalizes, T waves flatten |
| Stage 3 (weeks) | T-wave inversions develop diffusely |
| Stage 4 (months) | Complete normalization |
Key differentiators from STEMI:
- ST elevation is diffuse (all territories), not regional
- ST elevation is concave (saddle-shaped), not convex
- PR segment depression (highly specific for pericarditis)
- Spodick's sign: downsloping TP segment
- ST elevation in aVR is depressed (opposite of STEMI where aVR may be elevated)
- No reciprocal ST depression (except aVR)
ECG Image — Acute Pericarditis:

ECG Image — LBBB (Bonus — important masquerader):
Quick Reference Summary
| # | Disease | Key ECG Finding |
|---|---|---|
| 1 | STEMI | Convex ST elevation + reciprocal changes + Q waves |
| 2 | NSTEMI/UA | ST depression + T-wave inversions; no Q waves |
| 3 | Atrial Fibrillation | Absent P waves + irregularly irregular rhythm |
| 4 | Complete Heart Block | AV dissociation + slow escape rhythm |
| 5 | WPW Syndrome | Short PR + delta wave + wide QRS |
| 6 | Ventricular Tachycardia | Wide complex tachycardia + AV dissociation |
| 7 | Hypertrophic Cardiomyopathy | LVH + giant T-wave inversions (apical) |
| 8 | Pulmonary Embolism | Sinus tachycardia + S1Q3T3 + RBBB |
| 9 | Long QT / TdP | Prolonged QTc + polymorphic VT twisting around baseline |
| 10 | Acute Pericarditis | Diffuse concave ST elevation + PR depression |
Clinical note: ECG interpretation should always be integrated with the full clinical picture, history, and biomarkers. A single ECG may be normal early in STEMI, NSTEMI, or PE — serial ECGs are essential in high-suspicion cases.
This is a shared conversation. Sign in to Orris to start your own chat.