
Oligoclonal gamma globulin bands
Reading File
Oligoclonal bands (OCBs) are discrete immunoglobulin bands visible on electrophoresis of CSF or serum, produced by a restricted number of B-cell clones. They are most strongly associated with multiple sclerosis.
Searching sources...
Finding Sources
Searching PubMed
oligoclonal bands CSF diagnosis
Reading File
Reading File
Reading File
Reading File
Reading File
Reading File
Now let me fetch the key electrophoresis images to include in the answer:
Loading Image
Loading Image
Here is a thorough summary of oligoclonal gamma globulin bands in CSF, drawn from multiple authoritative laboratory medicine and neurology textbooks.
Oligoclonal Gamma Globulin Bands (CSF Oligoclonal Banding)
What They Are
Oligoclonal bands (OCBs) are two or more discrete immunoglobulin bands visible in the gamma region of CSF protein electrophoresis (or isoelectric focusing), produced by a restricted (oligo = "few") number of B-cell clones synthesizing IgG locally within the CNS. They are the laboratory hallmark of intrathecal IgG synthesis - immunoglobulin produced inside the blood-brain barrier rather than filtered in from systemic circulation.
Normal CSF has only a small, diffuse (polyclonal) smear in the gamma region. OCBs appear as distinct, sharp, discrete bands against this background.
Method of Detection
The preferred technique is isoelectric focusing (IEF) on unconcentrated CSF, run in parallel with a diluted serum sample from the same patient at the same time. This paired analysis is mandatory - you cannot interpret CSF bands without knowing if matching bands are present in serum. Positivity requires two or more bands in the CSF that fix as IgG and are absent in the matching serum sample.
Interpretation Patterns
The Consortium of Multiple Sclerosis Clinics consensus established five recognized band patterns:
| Type | CSF Bands | Serum Bands | Interpretation |
|---|---|---|---|
| 1 | None | None | Normal; no intrathecal synthesis |
| 2 | Oligoclonal IgG bands | None | Positive - intrathecal IgG synthesis |
| 3 | Oligoclonal IgG bands + additional bands | Same oligoclonal bands (plus extra in CSF) | Positive - intrathecal IgG synthesis |
| 4 | Identical oligoclonal bands | Identical bands | Systemic immune reaction with passive transfer; NOT intrathecal synthesis |
| 5 | Single monoclonal band | Same monoclonal band | Paraprotein (e.g. myeloma); NOT intrathecal synthesis |
Types 2 and 3 are the diagnostically meaningful positive results.
CSF Protein Electrophoresis: What a Normal CSF Looks Like
Before identifying OCBs, the normal CSF landmarks must be recognized:
- Prominent prealbumin band (more prominent than in serum)
- Albumin - the dominant band
- Double transferrin (beta) band - including asialotransferrin (tau protein) in the beta-2 region
- Absence of high-molecular-weight proteins found in serum (e.g. alpha-2/beta lipoprotein)
- Only a small quantity of polyclonal IgG in the gamma region
OCBs are evaluated in the gamma region, where they appear as discrete, separate bands.
Visual Examples
CSF protein electrophoresis - paired CSF (left) and serum (right):
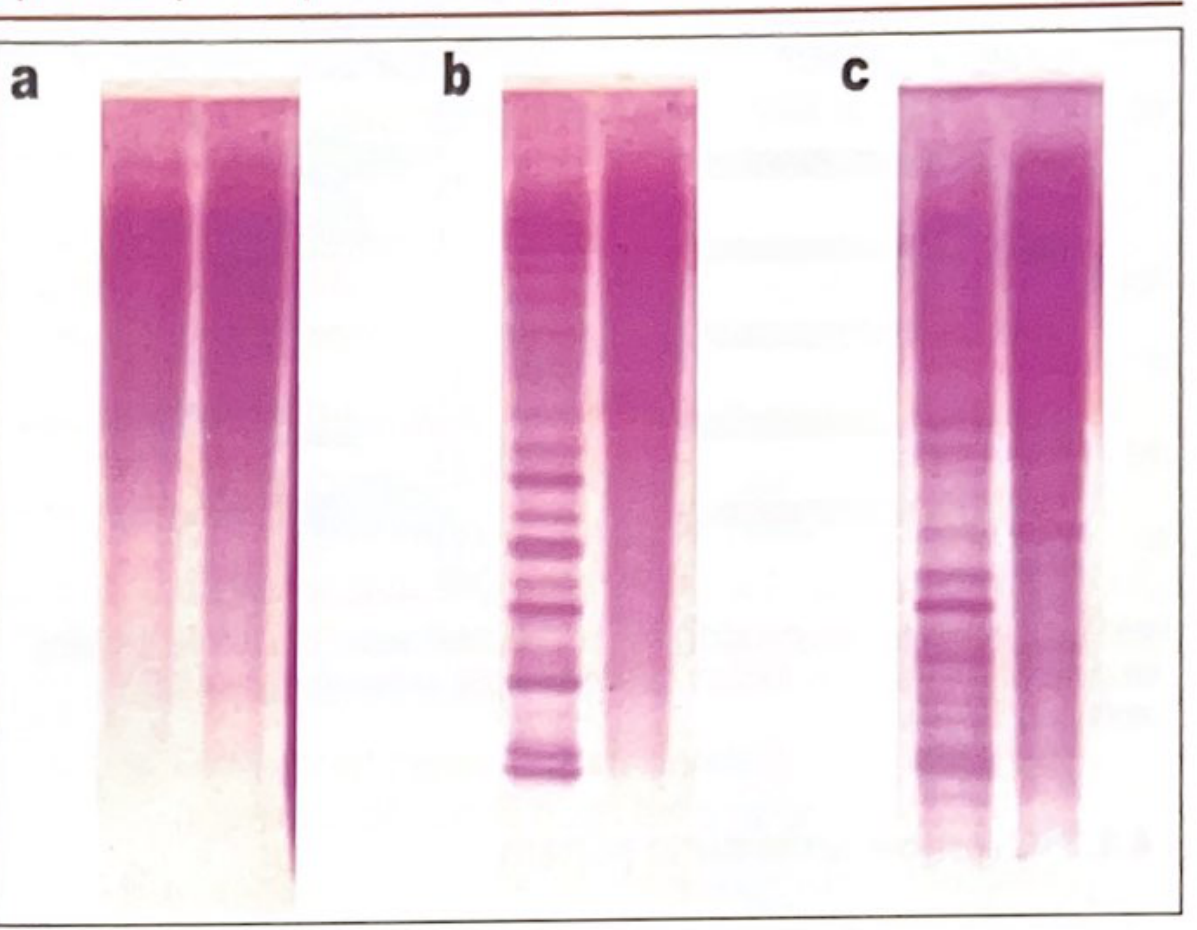
- (a) Neither CSF nor serum shows OCBs - normal
- (b) Prominent oligoclonal bands in CSF only, serum clear - positive for intrathecal IgG synthesis (MS pattern)
- (c) OCBs present in both CSF and serum - these CSF bands are discounted (systemic origin)
IEF gel patterns (C = CSF, S = serum) - four patterns:
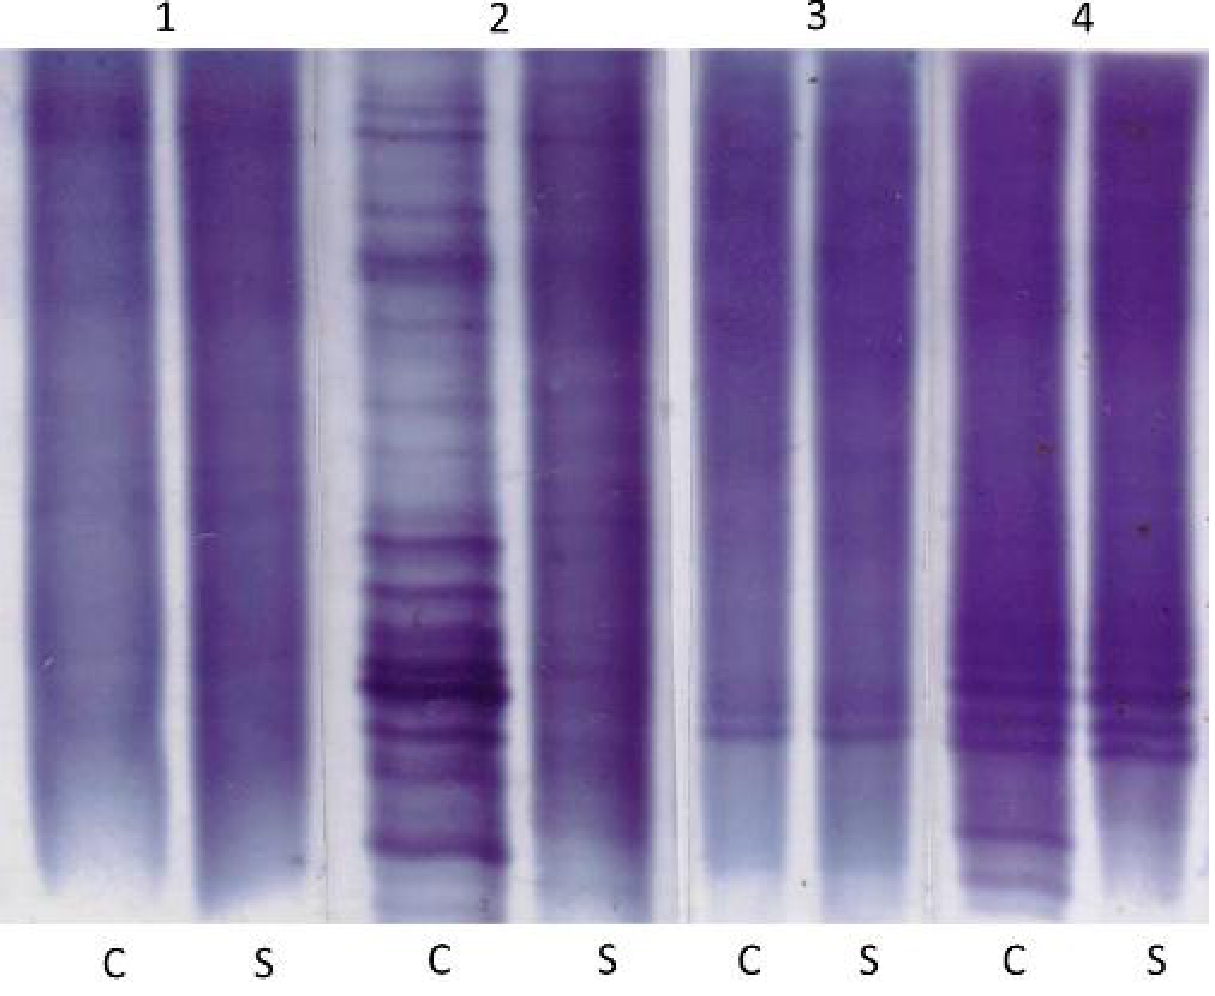
- No bands in either - "not detected"
- Bands in CSF only - "detected" (positive)
- Matched bands in CSF and serum - "not detected" (systemic)
- Matched bands in both, plus additional CSF bands - "detected" (positive)
Diseases Associated with CSF Oligoclonal Banding
OCBs are not specific for MS. The approximate incidence across disorders is (from Tietz Textbook of Laboratory Medicine, 7th Ed.):
| Clinical Disorder | Approximate Incidence (%) |
|---|---|
| Multiple sclerosis | 95 |
| Subacute sclerosing panencephalitis (SSPE) | 100 |
| Neurosyphilis | 95 |
| Neuro-Lyme disease | 80 |
| Neuro-AIDS (HIV encephalitis) | 80 |
| Neuro-SLE | 50 |
| Neurosarcoidosis | 40 |
| Neuro-Behçet disease | 20 |
Other causes include viral encephalitis, CNS vasculitis, paraneoplastic syndromes, and Guillain-Barré syndrome (rarely).
As stated in Adams and Victor's Principles of Neurology, 12th Ed., OCBs in a first attack of MS are predictive of conversion to clinically definite MS, but their presence in any single patient must always be interpreted in clinical context.
Relationship to IgG Index and Intrathecal Synthesis
OCB testing is complementary to the IgG Index, which is calculated as:
IgG Index = (CSF IgG / Serum IgG) ÷ (CSF Albumin / Serum Albumin)
- Normal reference: 0.3 - 0.7
- Values > 0.7 indicate increased intrathecal IgG synthesis
- Elevated in >80% of MS cases
- Can be falsely elevated if blood-brain barrier integrity is disrupted (e.g. traumatic LP, subarachnoid hemorrhage)
Tourtellotte's formula estimates the daily rate of intrathecal IgG synthesis; values >8 mg/day are found in most MS cases, though it adds little over the IgG index in practice.
Key Points Summary
- A positive OCB result requires two or more IgG bands in CSF not present in simultaneous serum
- Paired serum analysis is mandatory - without it, interpretation is invalid
- OCBs are sensitive for MS (~95%) but not specific - infectious and inflammatory CNS conditions also produce them
- OCBs reflect a restricted, clonal CNS immune response, not a polyclonal one
- Their absence does not exclude MS; their presence does not confirm it without clinical correlation
Sources: Henry's Clinical Diagnosis and Management by Laboratory Methods; Tietz Textbook of Laboratory Medicine, 7th Ed.; Quick Compendium of Clinical Pathology, 5th Ed.; Adams and Victor's Principles of Neurology, 12th Ed.; Goldman-Cecil Medicine
This is a shared conversation. Sign in to Orris to start your own chat.