Ecg
Asking for Preferences
Asking for Preferences
Reading File
Finding Sources
Searching Images
ECG findings myocardial infarction ST elevation Q waves
Finding Sources
Loading Image
Finding Sources
Loading Image
Finding Sources
Loading Image
Reading File
Reading File
Reading File
Reading File
Loading Image
Loading Image
Here is a comprehensive guide to ECG findings in Myocardial Infarction (MI), drawing from Harrison's Principles of Internal Medicine (2025), Guyton & Hall, and clinical ECG image libraries.
ECG Findings in Myocardial Infarction
Overview
The ECG is central to the diagnosis of acute and chronic ischemic heart disease. Ischemia exerts complex time-dependent effects on myocardial electrical properties, producing characteristic changes in the ST segment, T waves, and QRS complex.
1. Pathophysiology: Current of Injury
Severe acute ischemia lowers the resting membrane potential and shortens the action potential duration, creating a voltage gradient between normal and ischemic zones. This generates "currents of injury" seen as ST-segment deviation:
- Transmural (epicardial) ischemia → ST vector directed outward → ST elevation in overlying leads
- Subendocardial ischemia → ST vector directed inward → ST depression in overlying leads (with ST elevation in aVR)
2. Temporal Evolution of ECG Changes
This is the classic progression of STEMI:
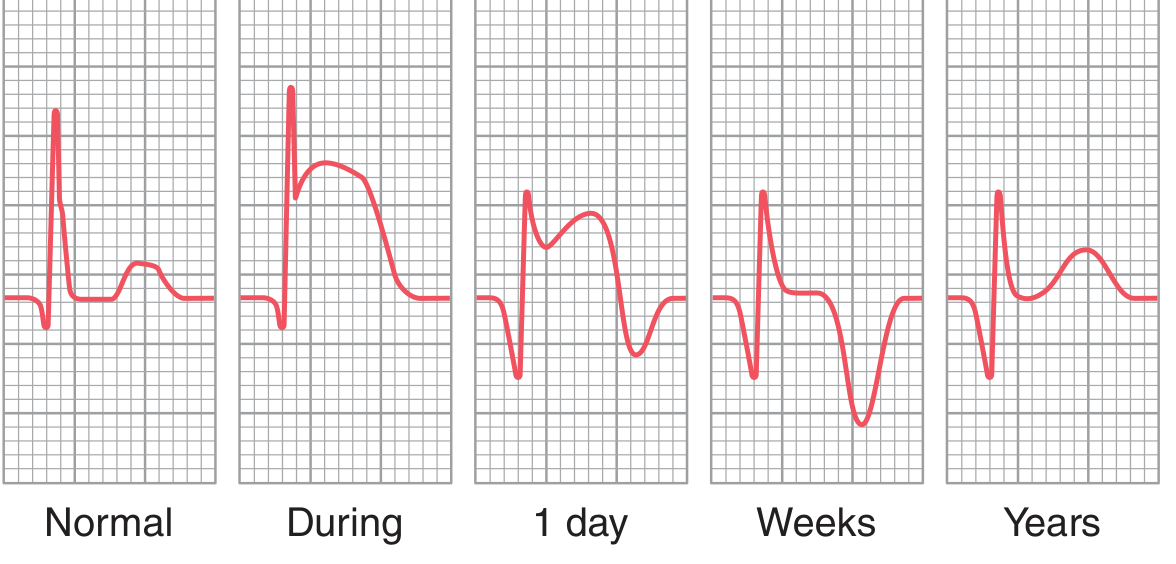
| Phase | Timing | ECG Change |
|---|---|---|
| Hyperacute | Minutes | Tall, broad, peaked T waves ("hyperacute T waves") |
| Acute | Hours | ST elevation (convex/tombstone morphology) |
| Evolving | Hours–days | T-wave inversion; Q waves begin to appear |
| Chronic/Old | Weeks–years | Pathological Q waves persist; ST normalizes |
3. The Three Key Signs
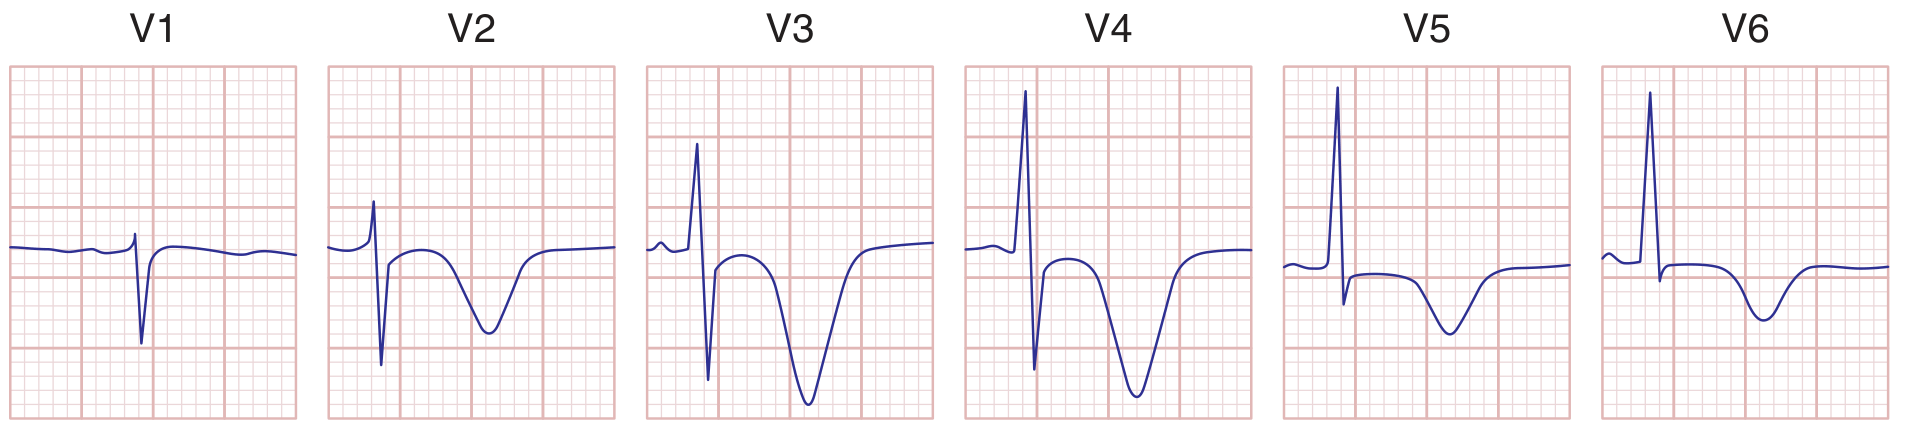
A. ST-Segment Elevation (STEMI)
- ≥1 mm in ≥2 contiguous limb leads
- ≥2 mm in ≥2 contiguous precordial leads (V1–V6)
- Convex ("tombstone") morphology in severe cases
B. Pathological Q Waves
- Width ≥40 ms (1 small square) or depth ≥25% of the R wave
- Represent electrically silent necrotic myocardium — the dead tissue produces no electrical signal, so the opposite wall's depolarization dominates (away from the necrotic lead = Q wave)
C. T-Wave Inversion
- Develops after ST elevation begins to resolve
- Deep symmetrical T-wave inversions in V1–V4 with minimal ST elevation = Wellens' sign (critical LAD stenosis)
4. Localizing the Infarct by Lead
| Territory | Culprit Artery | Leads with Changes |
|---|---|---|
| Anterior | LAD | V1–V4 |
| Anteroseptal | LAD (proximal) | V1–V3 |
| Lateral | LCx or diagonal | I, aVL, V5–V6 |
| Inferior | RCA (or LCx) | II, III, aVF |
| Posterior | RCA or LCx | Tall R wave in V1–V2; reciprocal ST depression V1–V3 |
| Right ventricular | Proximal RCA | ST elevation in right-sided leads (V3R–V4R) |
5. Reciprocal Changes
Reciprocal ST depression appears in leads electrically opposite to the infarcted territory. These are an important clue and increase diagnostic confidence:
- Inferior STEMI (ST ↑ in II, III, aVF) → reciprocal ST ↓ in I, aVL
- Anterior STEMI → reciprocal ST ↓ in II, III, aVF
- Lateral STEMI → reciprocal ST ↓ in inferior leads
6. STEMI vs NSTEMI Classification
| Feature | STEMI | NSTEMI |
|---|---|---|
| ST elevation | Present (≥2 contiguous leads) | Absent |
| Q waves | Often develop | May or may not |
| Coronary occlusion | Usually total | Usually partial |
| Reperfusion urgency | Immediate (PCI/thrombolysis) | Risk-stratified |
| Troponin | Elevated | Elevated |
Note: Q-wave MI vs. non-Q-wave MI has been replaced by STEMI/NSTEMI in modern classification, as ECG-pathologic correlations are imperfect. MRI studies show Q wave development depends more on volume of infarcted tissue than transmurality. — Harrison's, 2025
7. Real 12-Lead Examples
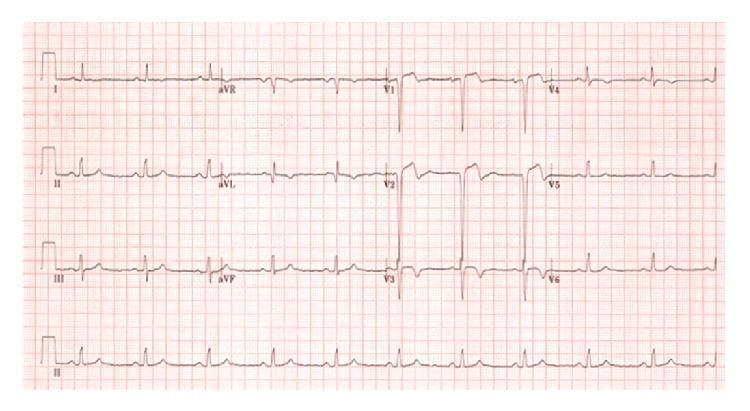
Massive STEMI — anterior + inferior involvement with tombstoning:
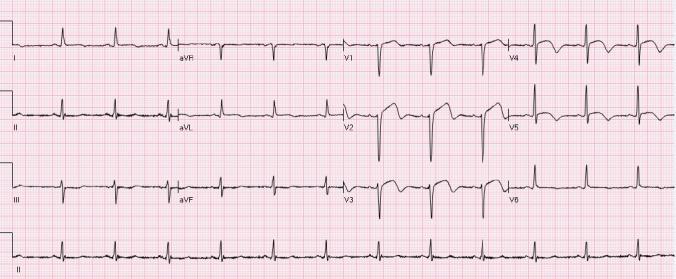
Acute lateral STEMI with reciprocal changes:
8. Important Limitations
The ECG has significant limitations:
- A single normal ECG does not exclude acute MI
- LBBB, ventricular pacing, and WPW can mask or mimic ischemic changes (Sgarbossa criteria help with LBBB)
- Posterior MI produces no Q waves in conventional leads — diagnosed by tall R in V1–V2 and reciprocal ST depression
- ST elevation can persist weeks after Q-wave MI → suggests ventricular wall motion disorder (not necessarily aneurysm)
Sources: Harrison's Principles of Internal Medicine 22E (2025), Ch. 247 & 286; Guyton and Hall Textbook of Medical Physiology, Ch. 12
Yes
Could you clarify what you mean by "Yes"? Are you:
- Confirming the information was helpful and want to continue on a related topic?
- Asking me to go deeper into a specific section (e.g., STEMI localization, Wellens' sign, LBBB masking)?
- Moving on to a different ECG topic?
Show me with ecg strip
Searching Images
ECG strip ST elevation myocardial infarction STEMI anterior inferior
Searching Images
ECG strip pathological Q wave T wave inversion myocardial infarction evolution
Loading Image
Loading Image
Loading Image
Loading Image
Loading Image
Here are real ECG strips showing each key MI pattern:
🫀 ECG Strips: MI Findings
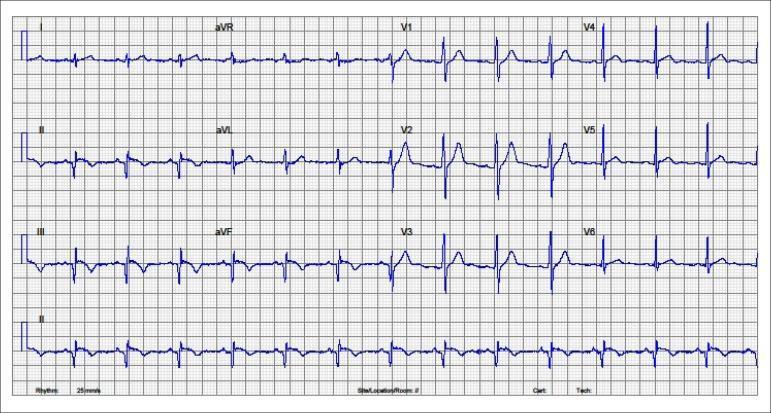
1. Inferolateral STEMI (Acute Phase)
ST elevation in II, III, aVF + V4–V6 (green circles) with reciprocal ST depression in I, aVL, V2–V3 (yellow arrows)
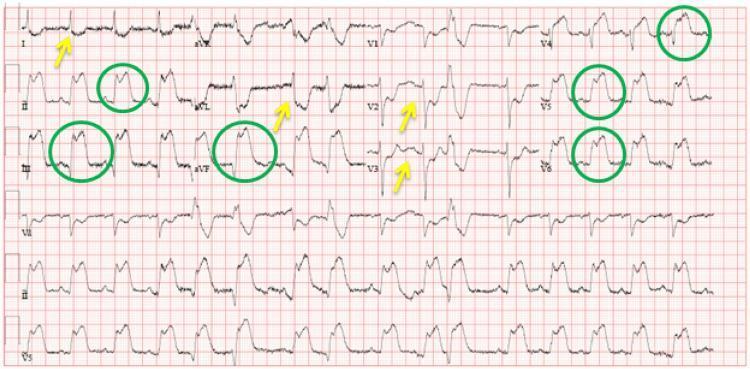
What to see: Convex ST elevation inferolaterally + reciprocal depression anteriorly. Culprit: RCA or LCx
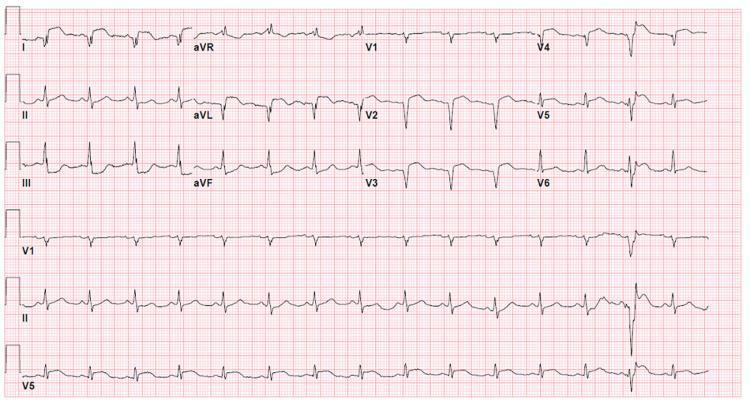
2. Inferior STEMI (Acute Phase)
ST elevation in II, III, aVF with reciprocal ST depression in V1–V6 and aVL
What to see: Classic inferior ST elevation + anterior reciprocal depression. Culprit: RCA
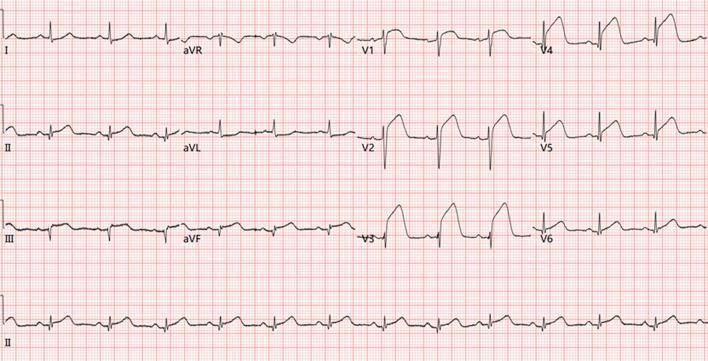
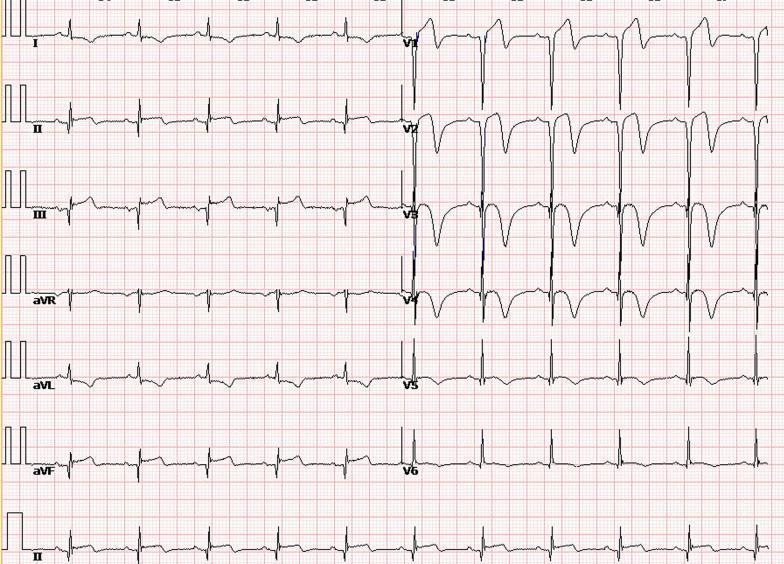
3. Anterior STEMI (LAD Occlusion)
Tombstone ST elevation V1–V6 with reciprocal ST depression in II, III, aVF
What to see: Extensive precordial tombstoning — highest risk pattern. Culprit: proximal LAD
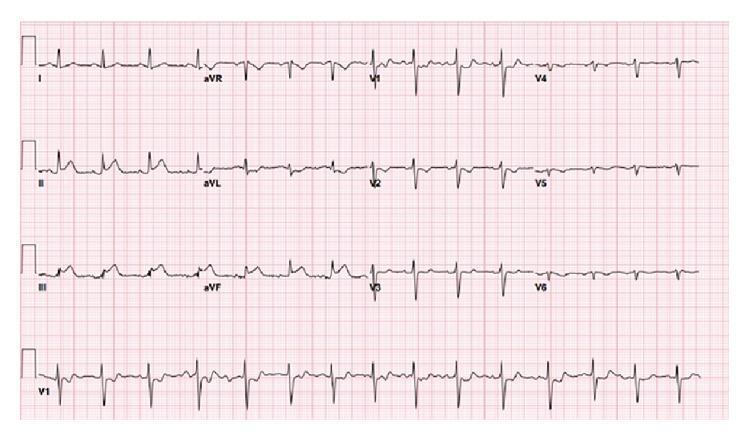
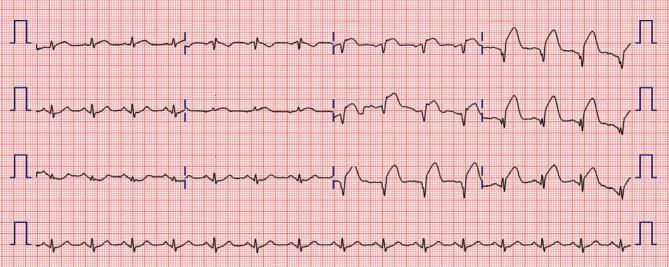
4. Post-Reperfusion / Evolving MI (Subacute Phase — 12 hrs post-PCI)
Pathological Q waves in II, III, aVF + deep symmetrical T-wave inversions V2–V6
What to see: ST elevation has resolved → now shows Q waves (necrosis) + T inversions (reperfusion/evolving). This is the subacute phase.
5. Old/Subacute Inferior MI with Posterior Extension
Q waves + T inversions in II, III, aVF; tall R wave + ST depression in V1–V3 (posterior MI pattern)
What to see: Posterior MI is a "silent" territory — no Q waves in standard leads; instead look for tall R + ST ↓ in V1–V3 as a reciprocal mirror image.
Quick Summary Table
| ECG Strip | Territory | Key Finding | Culprit Artery |
|---|---|---|---|
| Strip 1 | Inferolateral | ST ↑ II/III/aVF/V4–V6 + reciprocal ↓ I/aVL | RCA or LCx |
| Strip 2 | Inferior | ST ↑ II/III/aVF + widespread reciprocal ↓ | RCA |
| Strip 3 | Anterior | Tombstone ST ↑ V1–V6 | Proximal LAD |
| Strip 4 | Evolving (post-PCI) | Q waves + deep T inversions | Any |
| Strip 5 | Inferior + Posterior | Q waves + tall R/ST ↓ in V1–V3 | RCA |
This is a shared conversation. Sign in to Orris to start your own chat.