
Brain stroke
What aspect of brain stroke are you interested in?
brain stroke types ischemic hemorrhagic diagram
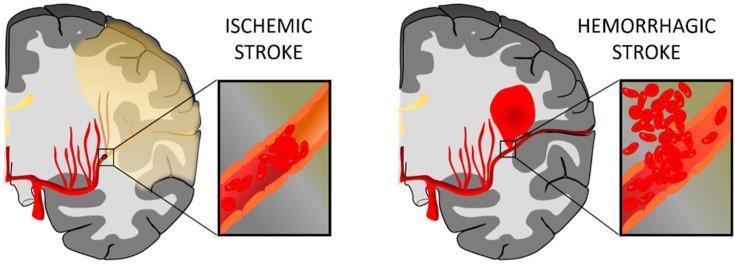
This medical illustration presents a side-by-side comparison of the two primary types of cerebrovascular accidents: Ischemic Stroke and Hemorrhagic Stroke. The diagram uses a coronal cross-section of the human brain and magnified insets to demonstrate the underlying pathophysiology. On the left, 'Ischemic Stroke' is depicted by a large yellowish-tan region in the cerebral cortex, representing infarcted tissue resulting from hypoperfusion. The inset reveals an intraluminal thrombus (blood clot) obstructing an artery, preventing distal blood flow. On the right, 'Hemorrhagic Stroke' is characterized by a focal, bright red intraparenchymal hematoma. The corresponding inset shows a ruptured vessel with erythrocytes extravasating into the surrounding brain tissue. Both illustrations highlight the middle cerebral artery territory. This anatomical diagram serves as an educational tool to differentiate between occlusive and hemorrhagic mechanisms of brain injury, emphasizing the clinical significance of vascular integrity and patency in maintaining cerebral blood flow.
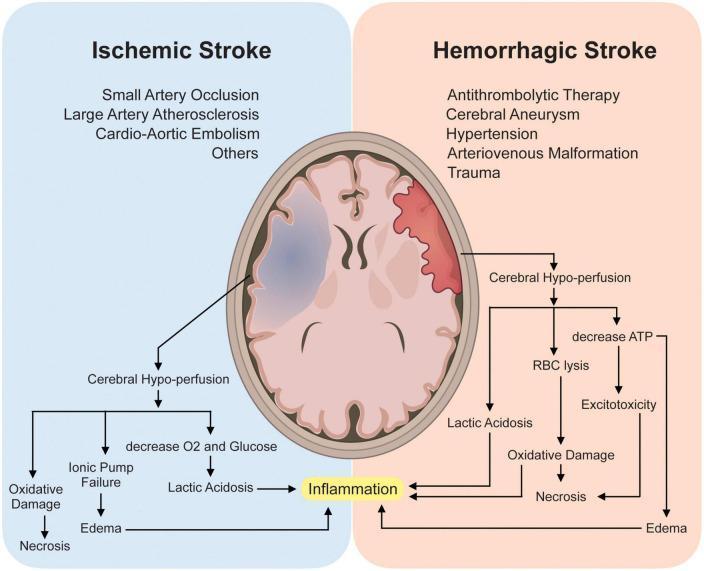
This medical infographic and pathophysiology flowchart compare Ischemic and Hemorrhagic stroke mechanisms. At the top, two axial brain illustrations highlight affected regions: a blue-shaded area in the left hemisphere represents ischemia, while a red-shaded area in the right hemisphere represents hemorrhage. Listed etiologies for Ischemic Stroke include small artery occlusion, large artery atherosclerosis, and cardio-aortic embolism. Hemorrhagic causes include antithrombolytic therapy, aneurysm, hypertension, arteriovenous malformation, and trauma. Below the illustrations, a logic flow depicts both conditions leading to cerebral hypo-perfusion. The ischemic pathway outlines oxygen/glucose deprivation, ionic pump failure, and lactic acidosis. The hemorrhagic pathway highlights red blood cell (RBC) lysis and ATP depletion. Both pathways converge on common secondary brain injury mechanisms: neuroinflammation, excitotoxicity, oxidative damage, and cerebral edema, all of which terminate in neuronal necrosis. This diagram serves as an educational tool for neurology students to understand the diverging initiating events and converging molecular outcomes of different stroke types.
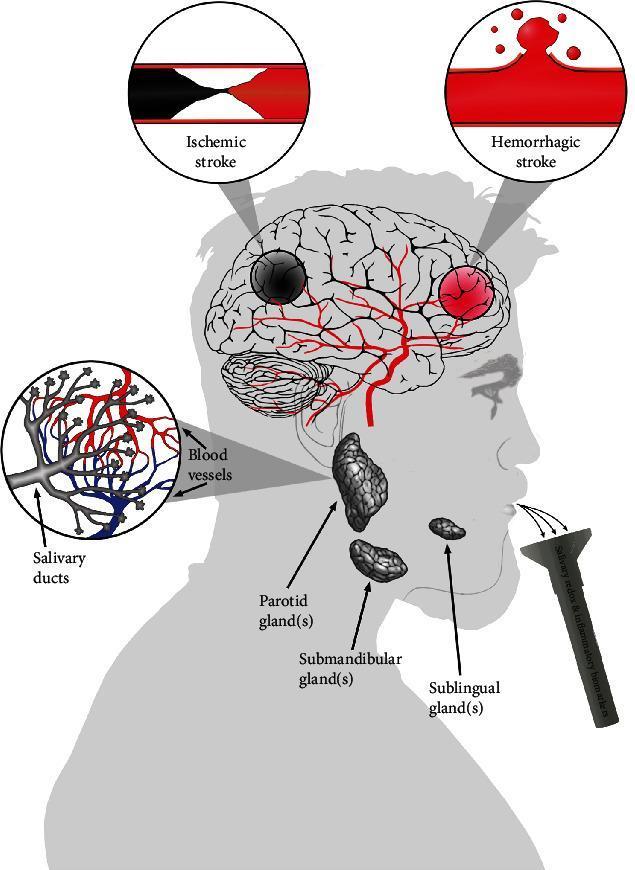
A medical infographic illustrating the physiological connection between cerebrovascular stroke and salivary biomarkers. The central image features a profile of a human head containing a brain with detailed vasculature. Two circular call-outs at the top contrast stroke types: 'Ischemic stroke' is shown as an arterial occlusion (blockage), while 'Hemorrhagic stroke' depicts a vessel rupture with extravasation of blood. Below, the three major salivary glands—parotid, submandibular, and sublingual—are labeled and shown in gray textured relief. An additional circular inset highlights the intricate interface between branching blood vessels and salivary ducts, emphasizing the mechanism of plasma filtration into saliva. A collection funnel at the mouth represents the non-invasive sampling of salivary redox and inflammatory biomarkers. The diagram serves an educational purpose for neurology and clinical chemistry, demonstrating how systemic markers of oxidative stress from brain injury can be detected in salivary secretions for diagnostic monitoring.
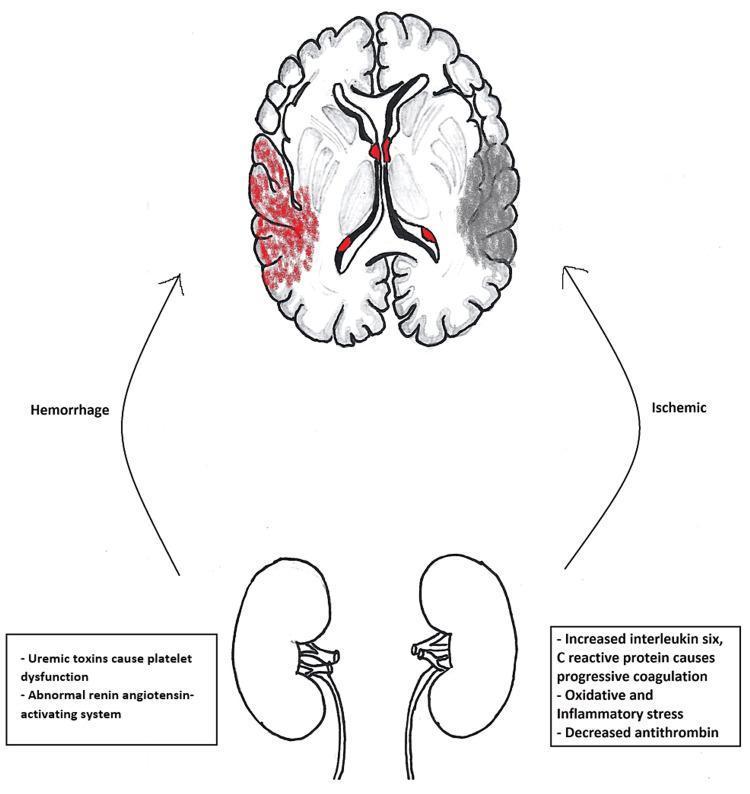
A medical pathophysiology diagram illustrating the bidirectional mechanisms linking chronic kidney disease (CKD) to stroke. The top of the diagram features a cross-sectional anatomical illustration of the brain. The left hemisphere depicts an area of red discoloration labeled 'Hemorrhage,' while the right hemisphere shows a gray-shaded region labeled 'Ischemic.' Below, a pair of kidneys is illustrated, connected to the brain pathology by curved arrows. The left arrow connects the kidney to hemorrhagic stroke, with an adjacent text box outlining contributing factors: uremic toxins causing platelet dysfunction and an abnormal renin-angiotensin-activating system. The right arrow connects the kidney to ischemic stroke, with a text box detailing mechanisms including increased Interleukin-6 (IL-6) and C-reactive protein (CRP) leading to progressive coagulation, oxidative and inflammatory stress, and decreased antithrombin. This educational graphic demonstrates how renal dysfunction promotes both pro-thrombotic and pro-hemorrhagic states, significantly increasing stroke risk in CKD and end-stage renal disease (ESRD) patients.
"stroke" AND "pathophysiology" AND "ischemic hemorrhagic"
Brain Stroke - Overview: Types, Causes & Pathophysiology
What Is a Stroke?
- Adams and Victor's Principles of Neurology, 12th Edition, p. 784
The Two Broad Categories
1. Ischemic Stroke (~85% of all strokes)
| Subtype | Mechanism | Onset Pattern |
|---|---|---|
| Cardioembolic | Clot from heart (e.g., atrial fibrillation) travels to brain | Sudden, peaks almost immediately |
| Large artery atherosclerotic | Thrombosis on an atherosclerotic plaque in a major cerebral artery | Evolves over minutes to hours (saltatory) |
| Small vessel / Lacunar | Occlusion of small perforating arteries within brain substance | Variable; often gradual |
- Blood flow falls below a critical threshold (~20 mL/100g/min)
- ATP-dependent ion pumps fail → ionic pump failure
- Glutamate excitotoxicity: massive release of excitatory amino acids → intracellular Ca²⁺ overload
- Lactic acidosis from anaerobic metabolism
- Lipase/protease activation → membrane degradation
- Free radical production → oxidative damage
- Neuroinflammation and cerebral edema follow
2. Hemorrhagic Stroke (~15% of all strokes)
a) Intracerebral Hemorrhage (ICH)
- Chronic hypertension (most common) - damages small perforating arteries (Charcot-Bouchard microaneurysms), especially in the basal ganglia, thalamus, pons, and cerebellum
- Anticoagulant medications / coagulopathies
- Cerebral amyloid angiopathy (CAA) - deposition of amyloid in vessel walls, causing lobar hemorrhages in the elderly
- Vascular malformations (AVMs, cavernomas)
- Hemorrhagic transformation of an ischemic infarct
b) Subarachnoid Hemorrhage (SAH)
Causes at a Glance
- Atherosclerotic thrombosis (large vessel disease)
- Cardiac embolism (AF, valve disease, MI, cardiac thrombus)
- Hypertensive hemorrhage
- Ruptured aneurysm or AVM
- Arteritis - infectious (syphilis, TB, fungal) or autoimmune (lupus, polyarteritis nodosa, giant cell arteritis)
- Hematologic disorders - polycythemia, sickle cell disease, TTP, antiphospholipid syndrome
- Carotid/vertebral artery dissection - especially in young adults after trauma
- Amyloid angiopathy - lobar hemorrhage in elderly
- Cerebral venous thrombosis - postpartum, dehydration, hypercoagulable states
- Reversible Cerebral Vasoconstriction Syndrome (RCVS)
- Genetic/rare causes - CADASIL, Fabry disease, moyamoya, MELAS (mitochondrial)
- Adams and Victor's Principles of Neurology, 12th Edition, Table 33-1
Transient Ischemic Attack (TIA)
Temporal Profile Helps Distinguish Type
| Feature | Embolic Stroke | Thrombotic Stroke | ICH | SAH |
|---|---|---|---|---|
| Onset | Sudden (seconds) | Gradual (minutes-hours) | Minutes-hours | Near-instantaneous |
| Headache | Uncommon | Uncommon | Common | Classic (thunderclap) |
| Vomiting | Uncommon | Uncommon | Common | Common |
| Progression to coma | Less common | Less common | Common in large bleeds | Common |
Common Convergent Mechanisms of Brain Injury
- Excitotoxicity - glutamate-mediated Ca²⁺ influx
- Oxidative damage - free radicals from ischemia or hemoglobin breakdown
- Neuroinflammation - microglial activation, cytokine release (IL-6, TNF-α)
- Cerebral edema - cytotoxic (cell swelling) in ischemia; vasogenic (BBB breakdown) in both
- Neuronal necrosis (immediate) and apoptosis (delayed, penumbra)
Quick Summary
| Ischemic Stroke | ICH | SAH | |
|---|---|---|---|
| Frequency | ~85% | ~10% | ~5% |
| Core mechanism | Vessel occlusion → infarction | Vessel rupture → parenchymal bleed | Vessel rupture → subarachnoid bleed |
| Main cause | Atherosclerosis / embolism | Hypertension / CAA | Saccular aneurysm |
| Key imaging | CT (exclude bleed); MRI-DWI (infarct) | CT (hyperdense clot) | CT (subarachnoid blood) |
- Adams and Victor's Principles of Neurology, 12th Edition
- Grainger & Allison's Diagnostic Radiology, 6th Edition