Explain me 10 commen heart diseases with ECG changes and ecg images of those diseases.
Reading File
Finding Sources
Finding Sources
Finding Sources
Searching Images
ECG myocardial infarction ST elevation STEMI
Reading File
Searching Images
atrial fibrillation ECG irregular rhythm no P waves
Searching Images
complete heart block third degree AV block ECG
Searching Images
left ventricular hypertrophy ECG voltage criteria
Searching Images
Wolff-Parkinson-White syndrome ECG delta wave pre-excitation
Searching Images
ventricular tachycardia ECG wide QRS tachycardia
Searching Images
pericarditis ECG saddle-shaped ST elevation diffuse
Searching Images
pulmonary embolism ECG S1Q3T3 right heart strain sinus tachycardia
Searching Images
hypertrophic cardiomyopathy ECG deep T wave inversion
Searching Images
dilated cardiomyopathy ECG bundle branch block poor R wave progression
Here is a comprehensive guide to 10 common heart diseases with their ECG changes and representative ECG images.
10 Common Heart Diseases: ECG Changes & Images
1. 🫀 ST-Elevation Myocardial Infarction (STEMI)
ECG Changes
- Hyperacute T waves (earliest sign — tall, peaked, broad-based)
- ST-segment elevation ≥1 mm in ≥2 contiguous limb leads or ≥2 mm in precordial leads (convex/tombstone morphology)
- Reciprocal ST depression in opposite leads
- Pathological Q waves develop within hours (necrosis marker)
- T-wave inversion in evolving phase
Localization by Leads
| Territory | Leads with ST elevation | Artery |
|---|---|---|
| Anterior | V1–V4 | LAD |
| Inferior | II, III, aVF | RCA |
| Lateral | I, aVL, V5–V6 | LCx/LAD |
| Posterior | Reciprocal depression V1–V3 | RCA/LCx |
ECG Image — Anterior STEMI (LAD occlusion)
Classic tombstone ST elevation in V2–V5 with evolving QS waves, consistent with proximal LAD occlusion.
2. ❤️ Atrial Fibrillation (AF)
ECG Changes
- Absent P waves — replaced by chaotic fibrillatory (f) waves, best seen in V1 and lead II
- Irregularly irregular RR intervals (hallmark)
- Narrow QRS complexes (unless aberrant conduction or pre-excitation)
- Rate: can be slow (<60 bpm), controlled (60–100 bpm), or rapid (>100 bpm = AF with rapid ventricular response)
- f-wave frequency: 350–600 impulses/min
ECG Image — Atrial Fibrillation with rapid ventricular response
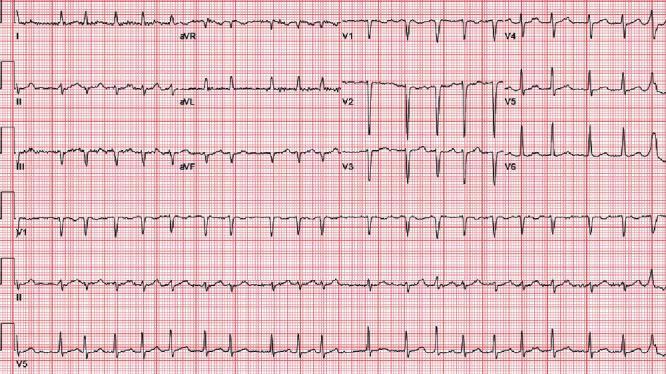
Absent P waves replaced by fibrillatory baseline, irregularly irregular RR intervals at ~126 bpm.
3. 🔴 Complete (Third-Degree) Heart Block
ECG Changes
- Complete AV dissociation — P waves and QRS complexes march independently
- Atrial rate > ventricular rate
- Regular PP intervals and regular RR intervals, but no fixed PR relationship
- Escape rhythm:
- Junctional (narrow QRS, rate 40–60 bpm) — block at AV node
- Ventricular (wide QRS >120ms, rate 20–40 bpm) — block below His bundle
- P waves may be buried in QRS or T waves
ECG Image — Third-Degree (Complete) AV Block
P waves and QRS complexes are completely dissociated. Wide QRS ventricular escape at ~35 bpm.
4. 💛 Acute Pericarditis
ECG Changes (4 stages)
- Stage 1 (acute): Diffuse concave/saddle-shaped ST elevation in most leads (except aVR & V1); PR-segment depression (most specific sign); Spodick's sign (downsloping TP segment)
- Stage 2: ST normalizes; PR depression persists
- Stage 3: Diffuse T-wave inversions
- Stage 4: Return to normal
Key differentiator from STEMI: ST elevation is diffuse (not territory-limited), concave (not convex), and PR depression is present
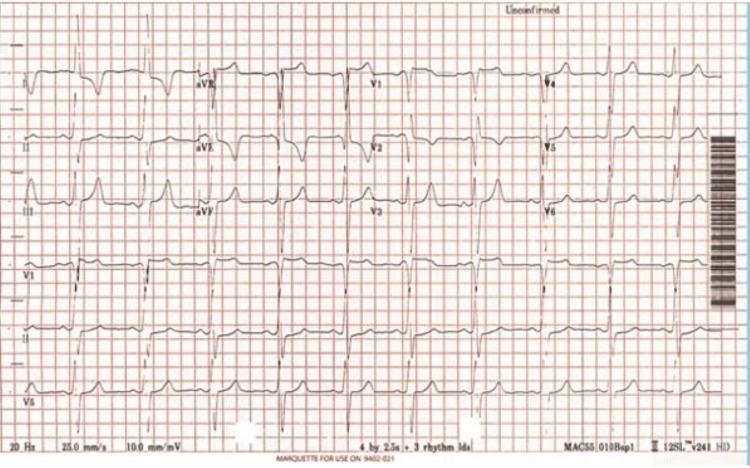
ECG Image — Acute Pericarditis
Diffuse saddle-shaped ST elevation across most leads, PR-segment depression in II, III, aVF, V4–V6, and reciprocal changes in aVR.
5. 🫁 Pulmonary Embolism (PE)
ECG Changes
- Sinus tachycardia (most common — seen in ~40% of cases)
- S1Q3T3 pattern (classic but only ~20% sensitive):
- Prominent S wave in lead I
- Q wave in lead III
- Inverted T wave in lead III
- Right axis deviation
- Right bundle branch block (complete or incomplete)
- T-wave inversions in V1–V4 (right ventricular strain)
- P pulmonale (peaked P waves — right atrial overload)
- New AF may occur
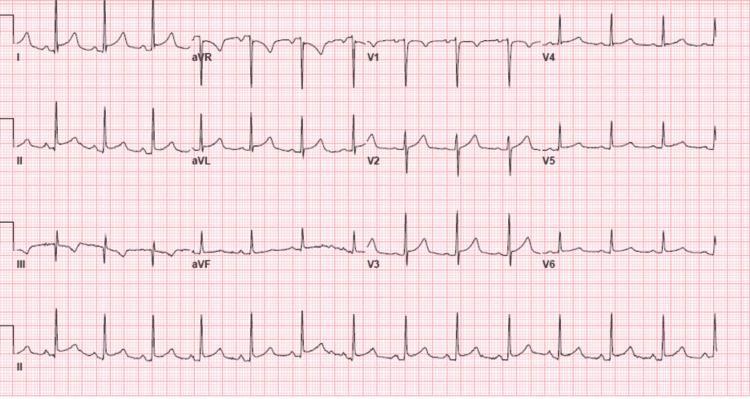
ECG Image — Pulmonary Embolism with S1Q3T3
Sinus tachycardia at ~116 bpm, S1Q3T3 pattern, incomplete RBBB, T-wave inversions V1–V3 — classic right heart strain from acute PE.
6. 💜 Wolff-Parkinson-White (WPW) Syndrome
ECG Changes (sinus rhythm / pre-excitation pattern)
- Short PR interval (<120 ms) — early ventricular activation via accessory pathway
- Delta wave — slurred upstroke at start of QRS (partial pre-excitation)
- Wide QRS complex (>120 ms total)
- Discordant ST-T changes (secondary to abnormal depolarization)
- Pseudo Q waves in inferior leads (mimics inferior MI)
- SVT/AVRT during tachycardia: typically narrow complex (orthodromic); wide complex if antidromic or in AF
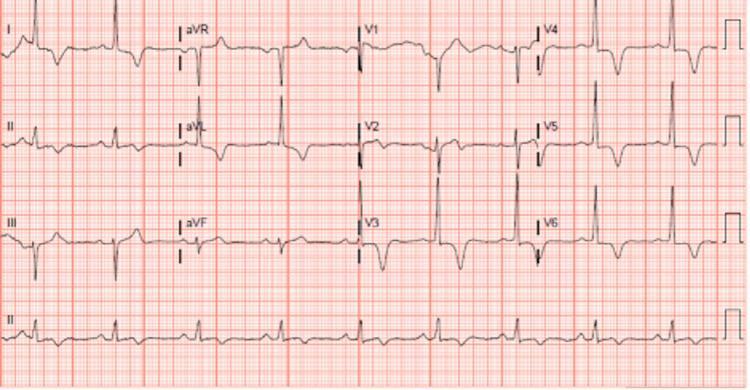
ECG Image — WPW Syndrome with delta waves
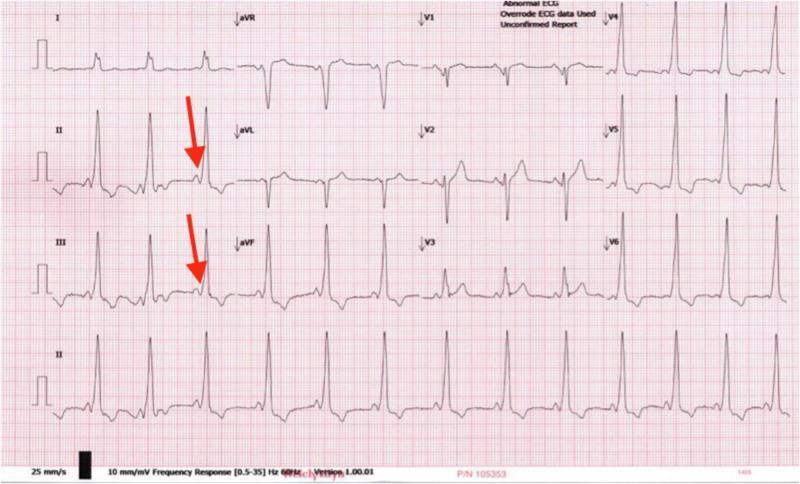
Short PR interval, slurred delta waves (arrows in II and III), wide QRS — classic WPW pre-excitation pattern with anteroseptal accessory pathway.
7. 🟠 Ventricular Tachycardia (VT)
ECG Changes
- Rate: 100–250 bpm
- Wide QRS complexes (>120 ms, often >140 ms)
- Regular rhythm (monomorphic VT) or irregular (polymorphic/TdP)
- AV dissociation (P waves independent of QRS — pathognomonic when visible)
- Fusion beats and capture beats (confirm VT)
- Concordance: all precordial leads positive or all negative → ventricular origin
- Axis: extreme right axis deviation ("northwest axis") common
Brugada criteria distinguish VT from SVT-with-aberrancy
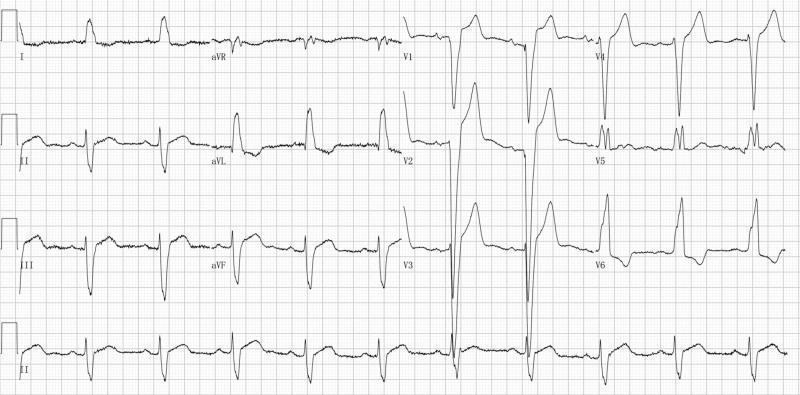
ECG Image — Monomorphic Ventricular Tachycardia
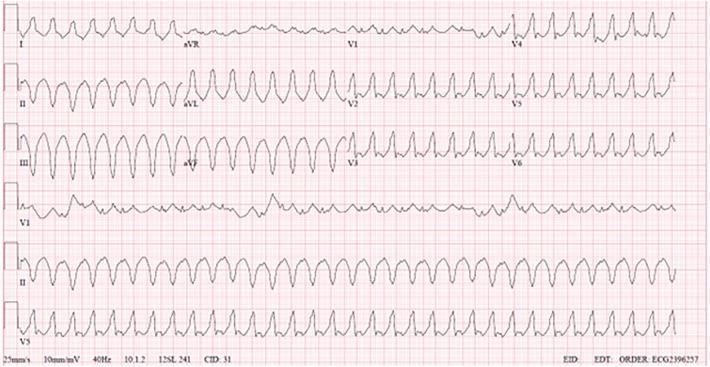
Rapid wide-complex tachycardia with positive precordial concordance and superior axis, consistent with monomorphic VT from structural heart disease.
8. 🟡 Left Ventricular Hypertrophy (LVH)
ECG Changes
- Voltage criteria (most specific: Cornell, Sokolow-Lyon):
- Sokolow-Lyon: S in V1 + R in V5 or V6 ≥35 mm
- Cornell: R in aVL + S in V3 >28 mm (men), >20 mm (women)
- R in aVL ≥12 mm alone
- LV strain pattern: ST depression + asymmetric T-wave inversion in lateral leads (I, aVL, V5–V6)
- Left axis deviation
- Prolonged QRS duration
- Left atrial enlargement (P mitrale: broad notched P in II, deep biphasic P in V1)
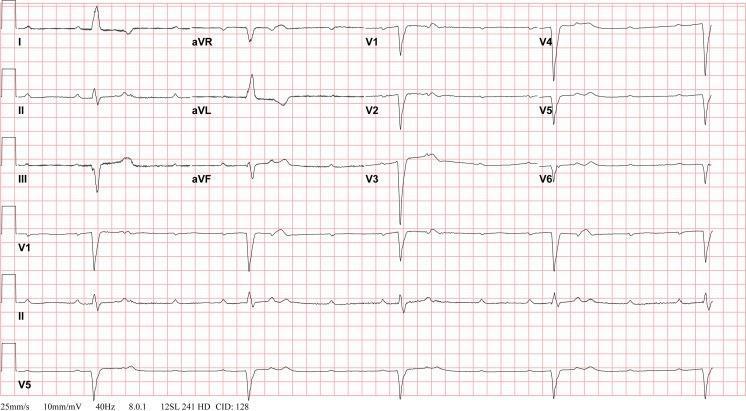
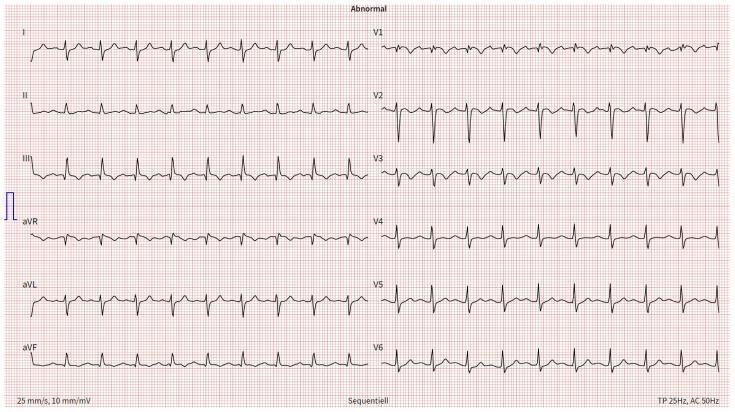
ECG Image — LVH with Strain Pattern
High Cornell voltage with prominent T-wave inversions in V4–V6 and I, aVL — classic LVH with lateral strain pattern.
9. 🔵 Hypertrophic Cardiomyopathy (HCM)
ECG Changes
- LVH voltage criteria (high amplitude QRS in precordial leads)
- Giant deep T-wave inversions in precordial leads (especially V2–V5) — most striking in apical HCM (Yamaguchi syndrome), can reach >10 mm
- Abnormal Q waves in lateral and inferior leads (septal hypertrophy)
- Left axis deviation
- ST-segment depression in lateral leads
- AF — common complication (~20% of patients)
- P-wave abnormalities (left atrial enlargement)
- High risk for sudden death — arrhythmias may be first presentation
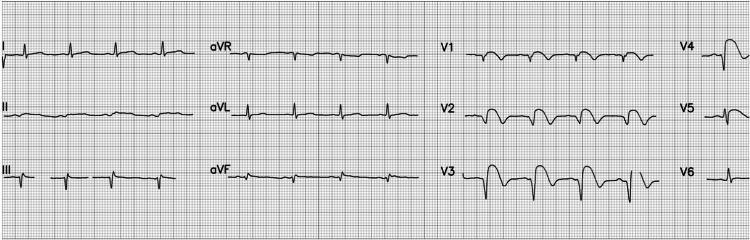
ECG Image — Apical HCM with Giant T-wave Inversions
High-voltage QRS with deep symmetric T-wave inversions V2–V5, characteristic of apical hypertrophic cardiomyopathy (Yamaguchi syndrome).
10. 🟤 Dilated Cardiomyopathy (DCM)
ECG Changes
- Left bundle branch block (LBBB) — most common pattern:
- Wide QRS ≥120 ms
- Broad monophasic R in I, aVL, V5–V6
- rS or QS in V1–V3
- Discordant ST-T changes
- Poor R-wave progression (V1–V4 — reflecting anterior wall thinning/fibrosis)
- Non-specific intraventricular conduction delay (IVCD)
- Atrial fibrillation (common due to atrial dilation)
- Pathological Q waves (mimicking prior MI — due to fibrosis)
- PVCs and non-sustained VT (common, ↑ SCD risk)
- Low voltage (if large pericardial effusion co-exists)
ECG Image — DCM with LBBB
Wide QRS with deep S waves in V1–V3 and broad monophasic R waves in lateral leads — classic LBBB pattern seen in dilated cardiomyopathy.
Quick Reference Summary Table
| # | Disease | Key ECG Hallmarks |
|---|---|---|
| 1 | STEMI | ST elevation (convex) in territory, reciprocal depression, Q waves |
| 2 | Atrial Fibrillation | Absent P waves, irregularly irregular RR, fibrillatory baseline |
| 3 | Complete Heart Block | AV dissociation, P and QRS march independently, escape rhythm |
| 4 | Acute Pericarditis | Diffuse saddle-shaped ST elevation, PR depression, Spodick's sign |
| 5 | Pulmonary Embolism | Sinus tachycardia, S1Q3T3, RBBB, T inversions V1–V4 |
| 6 | WPW Syndrome | Short PR, delta wave, wide QRS, secondary ST-T changes |
| 7 | Ventricular Tachycardia | Wide complex tachycardia, AV dissociation, fusion beats, concordance |
| 8 | LVH | Sokolow-Lyon/Cornell voltage, lateral strain (ST depression + T inversion) |
| 9 | HCM | Giant T-wave inversions (V2–V5), LVH voltage, abnormal Q waves |
| 10 | DCM | LBBB, poor R-wave progression, AF, PVCs, pathological Q waves |
Sources: Braunwald's Heart Disease (9780323722193), Goldman-Cecil Medicine (9780323930345), Rosen's Emergency Medicine (9780323757898)
Can u explain the dexona and genta inj. Usee in clinic
Reading File
Finding Sources
Finding Sources
Finding Sources
Finding Sources
Finding Sources
Finding Sources
Reading File
Finding Sources
Finding Sources
Finding Sources
You've run out of free credits. Sign up for a free account to continue using Orris.
This is a shared conversation. Sign in to Orris to start your own chat.