
Amlodipine
amlodipine hypertension cardiovascular outcomes
calcium channel blocker mechanism amlodipine dihydropyridine pharmacology diagram
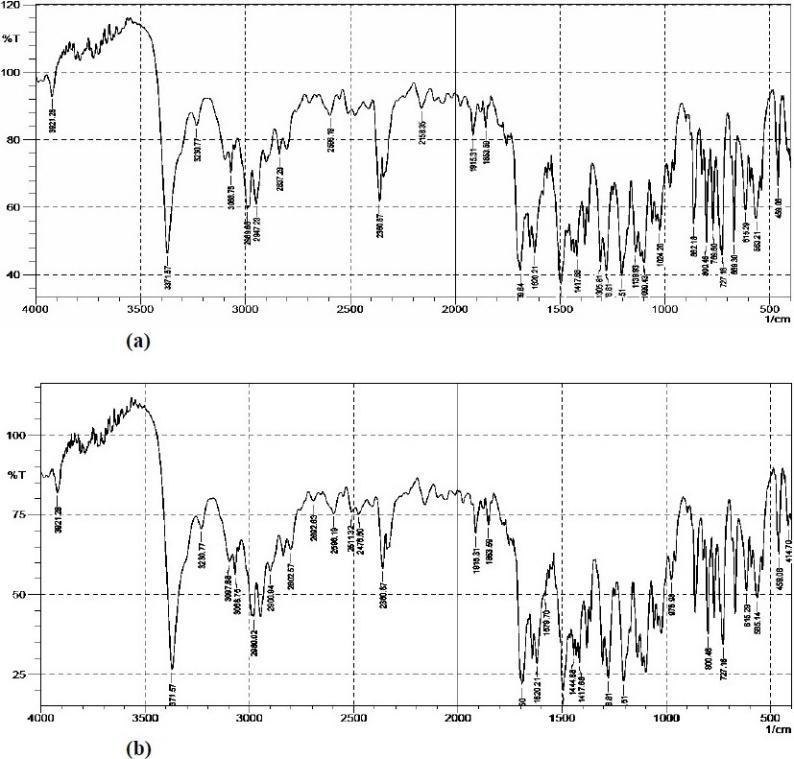
This diagnostic comparison chart displays two Fourier-transform infrared (FTIR) spectra used in pharmaceutical analysis. Graph (a) represents the spectrum of pure Felodipine (FL), a dihydropyridine calcium channel blocker, while graph (b) shows the spectrum of Spherical agglomerates FI-2, a formulation incorporating Inutec SP1 to enhance drug dissolution. Both plots utilize the vertical axis for percent transmittance (%T) and the horizontal axis for wavenumber (cm⁻¹), ranging from 4000 to 500 cm⁻¹. Key diagnostic peaks for Felodipine are visible in both spectra, including a sharp peak near 3371.57 cm⁻¹ (N-H stretching of secondary amine), aromatic C-H stretching around 3068.75 cm⁻¹, and a prominent C=O carbonyl stretching peak at 1689.64 cm⁻¹. The fingerprint region (below 1500 cm⁻¹) exhibits characteristic C-Cl stretching. The high degree of similarity between spectra (a) and (b) indicates that the chemical integrity of the active pharmaceutical ingredient is maintained during the spherical crystallization process, with no significant covalent interactions or degradation observed between the drug and the excipients.
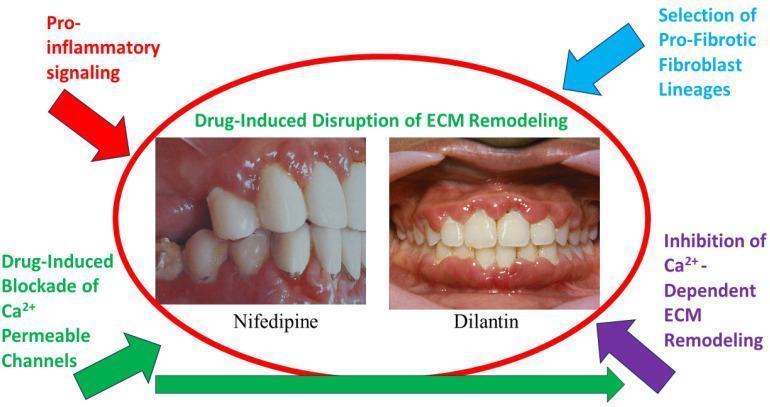
This medical visual combines clinical intraoral photographs with a conceptual diagram to illustrate drug-induced gingival overgrowth (DIGO). The central photographs compare the gingival manifestations of two specific pharmacological agents: Nifedipine (a calcium channel blocker) and Dilantin (Phenytoin, an anticonvulsant). The Nifedipine clinical image displays erythematous, swollen gingival margins with moderate hyperplasia. The Dilantin image demonstrates more severe, generalized gingival overgrowth characterized by bulbous interdental papillae and extensive coverage of the clinical crowns by thickened, lobulated gingival tissue. Surrounding these images is a pathophysiological flow diagram explaining the mechanism of extracellular matrix (ECM) disruption. Key educational concepts mapped include the drug-induced blockade of calcium-permeable channels (such as TRPV4), the inhibition of calcium-dependent ECM remodeling, and the selection of pro-fibrotic fibroblast lineages. The diagram highlights how pro-inflammatory signaling synergizes with these drug effects to disturb the homeostatic balance of collagen synthesis and degradation in periodontal tissues, leading to the observed pathological tissue enlargement.
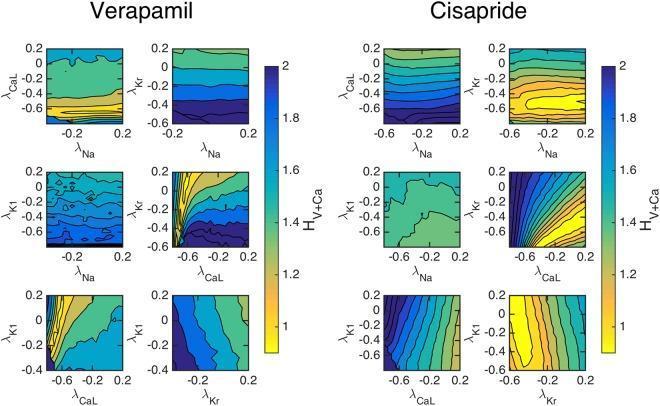
This diagnostic comparison chart displays two sets of contour plots illustrating the sensitivity of a cost function (HV+Ca) to pairwise perturbations of ion channel conductances (λNa, λCaL, λKr, λK1). The data represents electrophysiological inversion results from a cardiac Micro-Physiological System (MPS). The left panel corresponds to the effects of 100 nM Verapamil, known to block both L-type calcium (ICaL) and rapid delayed rectifier potassium (IKr) currents. The right panel represents 10 nM Cisapride, a selective IKr blocker. Each 3x2 grid shows different parameter pairings; color intensity represents the cost function value, where darker blue signifies higher values and yellow indicates a minimum (optimal fit). In the Cisapride group, the λKr vs. λCaL plot displays dense, vertical contour lines, indicating high sensitivity of the model specifically to perturbations in the IKr current. This visualization is used in cardiac pharmacology to identify drug-induced channel blockades by comparing experimental voltage and calcium transients with mathematical cell models.
Amlodipine
Drug Class & Overview
Mechanism of Action
- DHPs like amlodipine are more selective as vasodilators than verapamil or diltiazem
- Minimal effect on cardiac conduction or contractility at therapeutic doses
- Coronary artery dilation makes it effective in vasospastic (variant/Prinzmetal) angina
- The baroreceptor reflex may cause a modest reflex tachycardia (adrenergic stimulation of the SA node), although this is much less pronounced with long-acting DHP agents like amlodipine than with short-acting nifedipine
Pharmacokinetics
| Parameter | Value |
|---|---|
| Oral bioavailability | 65-90% |
| Half-life | 30-50 hours (longest among CCBs) |
| Onset | Gradual (peak effect in 6-12 h after first dose) |
| Protein binding | ~93% (highly protein-bound) |
| Metabolism | Hepatic via CYP3A4 to inactive metabolites |
| Elimination | Renal (60%) and fecal (40%) |
| Dosing | 5-10 mg orally once daily |
Indications
- Hypertension - first-line agent; effective as monotherapy or in combination
- Chronic stable angina (effort-induced) - reduces myocardial O₂ demand by reducing afterload
- Vasospastic (Prinzmetal/variant) angina - directly relaxes coronary artery spasm
- Hypertension + angina coexisting - treats both simultaneously
Preferred populations:
- Elderly patients with isolated systolic hypertension
- African American patients (CCBs often more effective than ACE inhibitors/ARBs due to low-renin physiology)
- Patients with asthma or COPD (no bronchospasm risk, unlike beta-blockers)
- Patients with peripheral arterial disease or Raynaud phenomenon
- When beta-blockers are contraindicated or not tolerated
Combination therapy:
- Amlodipine + ACE inhibitor (e.g., amlodipine + perindopril - the ASCOT trial) proved superior to atenolol + hydrochlorothiazide for cardiovascular outcomes
- Amlodipine + ACE inhibitor (benazepril - ACCOMPLISH trial) superior to ACE inhibitor + thiazide for cardiovascular events
- Combines well with beta-blockers: amlodipine reduces BP and dilates coronaries; beta-blocker slows HR and reduces contractility - complementary mechanisms
Adverse Effects
| Effect | Notes |
|---|---|
| Peripheral (ankle) edema | Most common; dose-related; due to arteriolar dilation causing capillary hypertension, not heart failure |
| Flushing, headache | Vasodilatory; usually transient |
| Dizziness | From hypotension |
| Reflex tachycardia | Mild; less than with short-acting nifedipine |
| Palpitations | Dose-related |
| Fatigue, somnolence | Less common |
| Gingival hyperplasia | Class effect of DHP CCBs (less common than nifedipine) |
| Nausea, abdominal pain | Less common |
Drug Interactions
- CYP3A4 inhibitors (protease inhibitors, azole antifungals like fluconazole/ketoconazole, amiodarone): increased amlodipine levels and toxicity
- CYP3A4 inducers (rifampicin, carbamazepine, efavirenz): decreased amlodipine effect
- Cyclosporine, tacrolimus, simvastatin: amlodipine may increase their levels - monitor closely
- Metabolism shared by most other CCBs via CYP3A4
Contraindications & Cautions
- Cardiogenic shock
- Severe aortic stenosis (reduces afterload abruptly)
- Hypersensitivity to dihydropyridines
- Use with caution in hepatic impairment - reduce dose (decreased metabolism)
- Short-acting dihydropyridines (not amlodipine itself) should be avoided post-MI due to increased mortality risk - sustained-release/long-acting agents like amlodipine are safe
Pediatric Use (Harriet Lane)
- Dose-related side effects same as in adults: edema, dizziness, flushing, fatigue, palpitations
- Present in breast milk at low levels; no adverse effects detected in breastfed infants
- Reduce dose in hepatic insufficiency; wait 5-7 days between adjustments
Overdose / Toxicity
- Profound vasodilation and hypotension
- Reflex tachycardia (initially), but bradycardia can emerge
- Noncardiogenic pulmonary edema reported
Summary Table
| Property | Amlodipine |
|---|---|
| Class | Dihydropyridine CCB |
| Channel | L-type, vascular-selective |
| Half-life | 30-50 hours |
| Dose | 5-10 mg PO once daily |
| Indications | HTN, stable angina, vasospastic angina |
| Key ADR | Ankle edema, flushing, headache |
| Metabolism | CYP3A4 (hepatic) |
| Cardiac effects | Minimal (no negative inotropy/chronotropy at therapeutic doses) |
| Key advantage | Once-daily, smooth BP control; safe in asthma/COPD/PAD |
Compare amlodipine vs other CCBs (verapamil, diltiazem, nifedipine)
calcium channel blocker classification comparison verapamil diltiazem nifedipine amlodipine cardiac vascular selectivity
This diagnostic comparison chart displays two sets of contour plots illustrating the sensitivity of a cost function (HV+Ca) to pairwise perturbations of ion channel conductances (λNa, λCaL, λKr, λK1). The data represents electrophysiological inversion results from a cardiac Micro-Physiological System (MPS). The left panel corresponds to the effects of 100 nM Verapamil, known to block both L-type calcium (ICaL) and rapid delayed rectifier potassium (IKr) currents. The right panel represents 10 nM Cisapride, a selective IKr blocker. Each 3x2 grid shows different parameter pairings; color intensity represents the cost function value, where darker blue signifies higher values and yellow indicates a minimum (optimal fit). In the Cisapride group, the λKr vs. λCaL plot displays dense, vertical contour lines, indicating high sensitivity of the model specifically to perturbations in the IKr current. This visualization is used in cardiac pharmacology to identify drug-induced channel blockades by comparing experimental voltage and calcium transients with mathematical cell models.
![This composite educational image illustrates the in vivo biodistribution of [13N]nifedipine, a radiolabeled calcium channel blocker, in a healthy rat model using preclinical PET/CT imaging. Panels A, B, and C present Maximum Intensity Projections (MIP) at sequential 10-minute intervals (0-30 min post-injection). The initial phase (0-10 min) demonstrates significant tracer accumulation in the brain (Br), carotid artery (Ca), heart (He), and liver (Li), visualized as high-intensity hotspots. Panel D provides a line graph showing quantitative mean activity (Bq/voxel) over time for the blood, heart, liver, and brain. The data indicates that the brain achieves the highest peak activity (~0.8 Bq/voxel) followed by a gradual decrease, while the heart shows early peak uptake and rapid clearance. The liver maintains a steady activity level (~0.6 Bq/voxel), reflecting hepatic metabolism. This study demonstrates the utility of nitrogen-13 labeling for investigating calcium channel function and pharmacokinetics in cardiac and neurological research without altering the drug's chemical structure.](https://cdn.orris.care/cdss_images/pmc_clinical_VQA_52b61014c18bc76821c2b2f4e0a930c519bd1f26a89f3b2e9d0fe963b6324690.jpg)
This composite educational image illustrates the in vivo biodistribution of [13N]nifedipine, a radiolabeled calcium channel blocker, in a healthy rat model using preclinical PET/CT imaging. Panels A, B, and C present Maximum Intensity Projections (MIP) at sequential 10-minute intervals (0-30 min post-injection). The initial phase (0-10 min) demonstrates significant tracer accumulation in the brain (Br), carotid artery (Ca), heart (He), and liver (Li), visualized as high-intensity hotspots. Panel D provides a line graph showing quantitative mean activity (Bq/voxel) over time for the blood, heart, liver, and brain. The data indicates that the brain achieves the highest peak activity (~0.8 Bq/voxel) followed by a gradual decrease, while the heart shows early peak uptake and rapid clearance. The liver maintains a steady activity level (~0.6 Bq/voxel), reflecting hepatic metabolism. This study demonstrates the utility of nitrogen-13 labeling for investigating calcium channel function and pharmacokinetics in cardiac and neurological research without altering the drug's chemical structure.
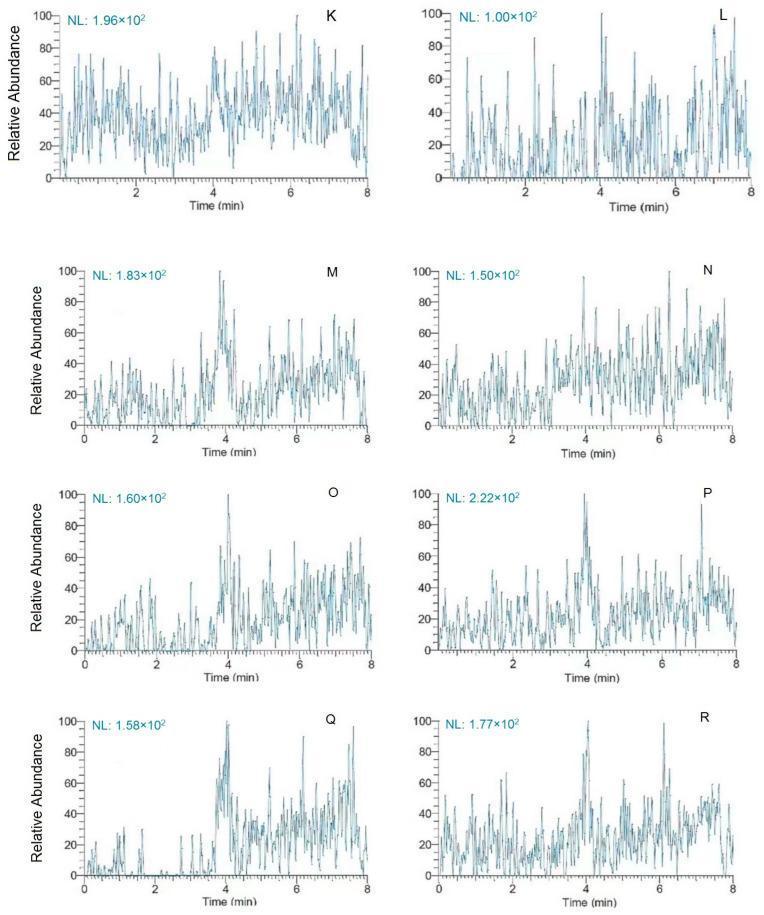
This diagnostic graphic presents a multi-panel set of mass spectrometry chromatograms labeled K through R, used for clinical biochemical analysis of calcium channel blockers (CCBs) in human plasma. Each panel illustrates a signal plot with 'Time (min)' on the x-axis (ranging from 0 to 8 minutes) and 'Relative Abundance' on the y-axis (scaled 0 to 100). The chromatograms represent blank plasma samples used to assess selectivity and carryover effects during the validation of an ultra-HPLC-MS/MS method. Key features include normalization levels (NL) indicated in the top left of each panel, ranging from approximately 1.00 x 10^2 to 2.22 x 10^2. The plots demonstrate baseline noise and the absence of significant interfering peaks at the retention times for analytes such as amlodipine, nifedipine, and nimodipine. Panels M through R specifically represent blank samples analyzed after high-concentration quality control (HQC) samples to verify minimal carryover, which is critical for ensuring the accuracy and precision of quantitative toxicological or pharmacological assays in medical diagnostics.
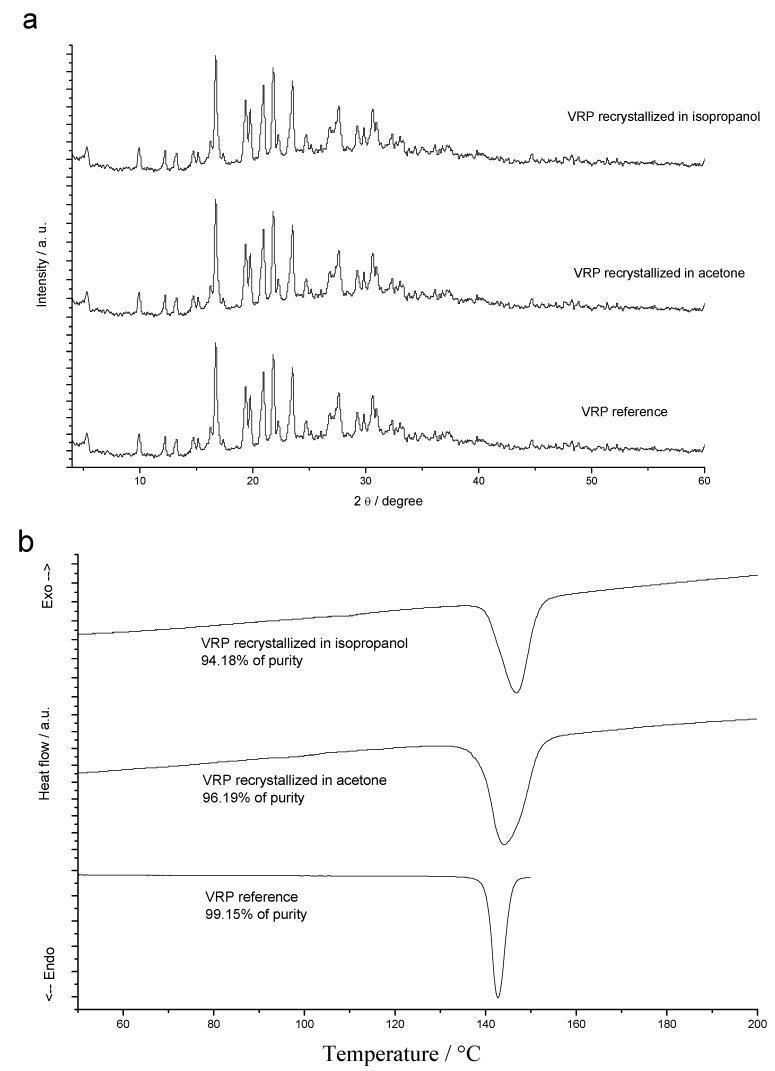
This figure presents pharmaceutical characterization data for verapamil hydrochloride (VRP), a calcium channel blocker, comparing a reference sample with samples recrystallized from acetone and isopropanol. (a) X-ray Diffraction (XRD) patterns: The three diffractograms show identical peak positions and relative intensities across the 2-theta range (approx. 5–60 degrees), confirming that the recrystallization solvents did not alter the crystalline habit or unit cell of the drug. (b) Differential Scanning Calorimetry (DSC) curves: The thermal analysis plots depict endothermic fusion peaks (melting points) around 146 °C. The VRP reference shows a sharp, narrow endotherm corresponding to a high purity of 99.15%. The recrystallized samples demonstrate broader fusion peaks and lower purity percentages (96.19% for acetone and 94.18% for isopropanol), indicating that recrystallization introduced minor impurities that widened the melting range. This material is used to teach concepts of drug stability, polymorphism, and purity assessment in pharmaceutical sciences.
Calcium Channel Blockers: Amlodipine vs Verapamil vs Diltiazem vs Nifedipine
Chemical Classes - The Foundation of All Differences
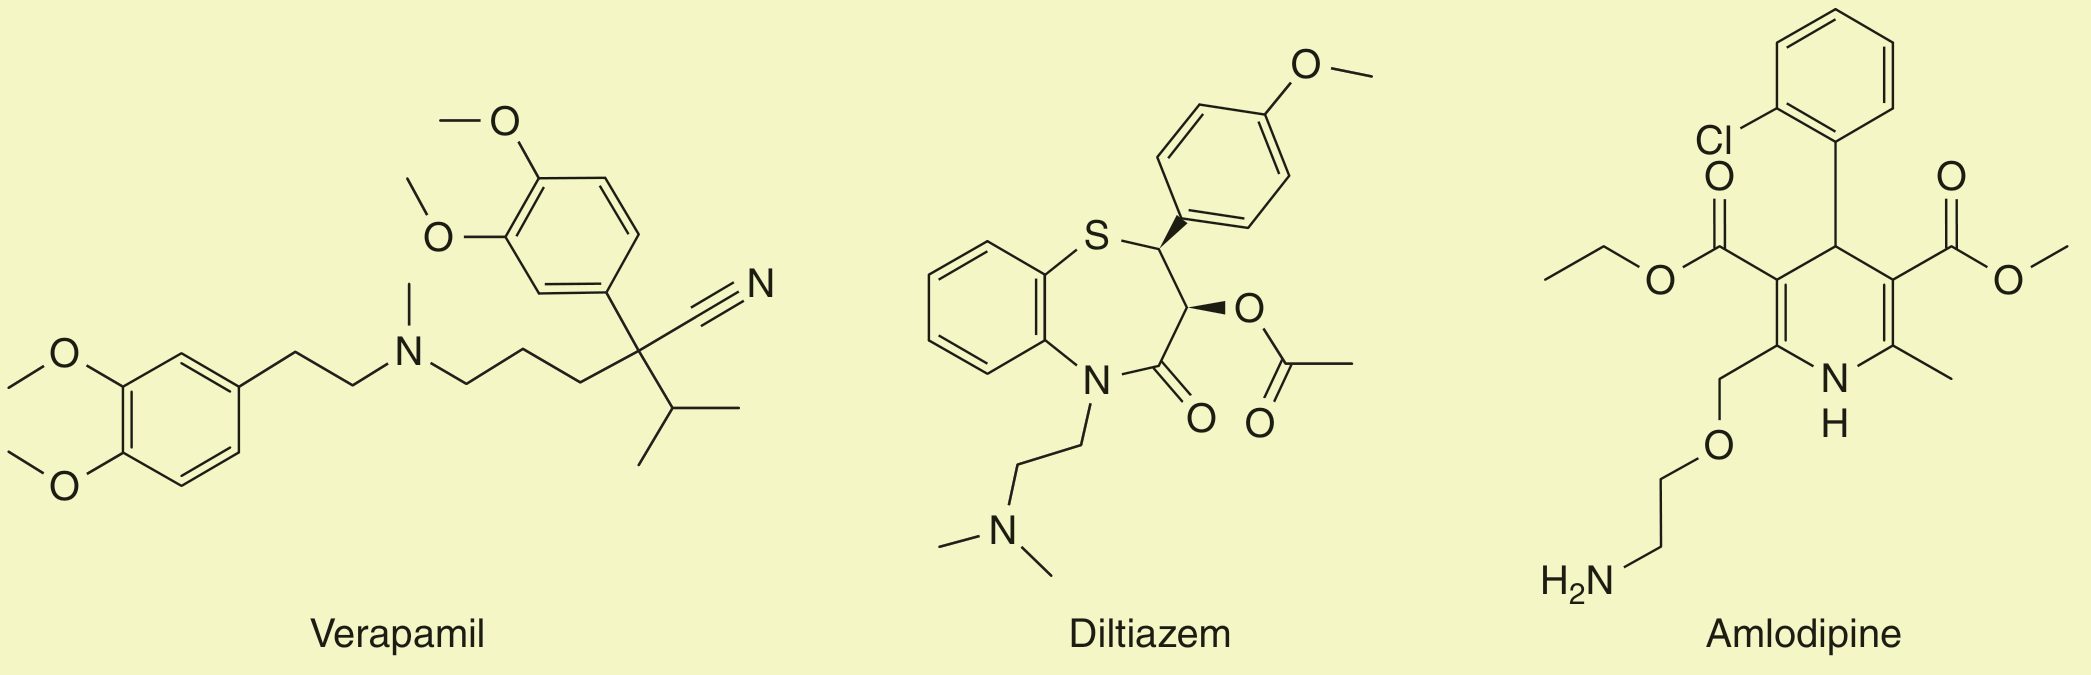
| Drug | Chemical Class | Binding Site on α₁ subunit |
|---|---|---|
| Verapamil | Phenylalkylamine | Transmembrane segment IVS6 |
| Diltiazem | Benzothiazepine | Cytoplasmic bridge between IIS and IVS |
| Amlodipine / Nifedipine | Dihydropyridine (DHP) | Transmembrane segments of domains III and IV |
The Core Comparison: Pharmacodynamic Effects
| Effect | Verapamil | Diltiazem | Amlodipine (DHP) |
|---|---|---|---|
| Vasodilation | 4 | 3 | 5 |
| ↓ Cardiac contractility | 4 | 2 | ~1 |
| ↓ SA node automaticity | 5 | 5 | ~1 |
| ↓ AV node conduction | 5 | 4 | 0 |
Pharmacokinetics Side-by-Side
| Parameter | Amlodipine | Nifedipine (IR) | Diltiazem | Verapamil |
|---|---|---|---|---|
| Bioavailability | 65-90% | 45-70% | 40-65% | 20-35% |
| Half-life | 30-50 h | 4 h | 3-4 h | 6 h |
| Dosing frequency | Once daily | 3x/day (IR); once daily (XL) | Every 6-8 h (IR) | Every 8 h (IR) |
| Onset of BP effect | Slow, gradual | Fast (minutes, IR) | Intermediate | Intermediate |
| Metabolism | CYP3A4 | CYP3A4 | CYP3A4 | CYP3A4 |
- No first-dose BP crash
- No rebound if a dose is missed
- Takes 5-7 days to reach steady state (wait before adjusting dose)
- Smooth 24-hour BP coverage without peaks and troughs
Indications: Where Each Drug Fits
| Indication | Amlodipine | Nifedipine XL | Diltiazem | Verapamil |
|---|---|---|---|---|
| Hypertension | ✅ First-line | ✅ | ✅ | ✅ |
| Stable exertional angina | ✅ | ✅ | ✅ | ✅ |
| Vasospastic (Prinzmetal) angina | ✅ Excellent | ✅ Excellent | ✅ | ✅ |
| Rate control in AF/flutter | ❌ | ❌ | ✅ | ✅ |
| SVT (paroxysmal) | ❌ | ❌ | ✅ IV | ✅ IV |
| Hypertrophic obstructive CM | ❌ | ❌ | ✅ | ✅ |
| Raynaud phenomenon | ✅ | ✅ | ✅ | - |
| Migraine prophylaxis | - | - | - | ✅ |
Contraindications: The Critical Differences
| Contraindication | Amlodipine | Nifedipine | Diltiazem | Verapamil |
|---|---|---|---|---|
| HFrEF (reduced EF) | Acceptable* | Acceptable* | AVOID | AVOID |
| 2nd/3rd degree AV block | Safe | Safe | AVOID | AVOID |
| Sick sinus syndrome | Safe | Safe | AVOID | AVOID |
| Wolff-Parkinson-White + AF | Safe | Safe | AVOID | AVOID |
| Severe bradycardia | Safe | Safe | AVOID | AVOID |
| With beta-blockers | Safe | Safe | Caution | AVOID |
| Short-acting IR in HTN/CAD | N/A | AVOID | N/A | N/A |
Adverse Effects Compared
| Adverse Effect | Amlodipine | Nifedipine | Diltiazem | Verapamil |
|---|---|---|---|---|
| Peripheral edema | ++ | ++ | + | + |
| Flushing / headache | + | +++ (worse with IR) | + | + |
| Reflex tachycardia | Mild | +++ (with IR) | Minimal | Bradycardia |
| Constipation | Rare | Rare | + | +++ (hallmark) |
| Bradycardia | No | No | + | +++ |
| AV block | No | No | ++ | +++ |
| Negative inotropy/worsening HF | No | No | ++ | +++ |
| Gingival hyperplasia | + | ++ | + | + |
Special Clinical Scenarios
- Choose amlodipine - will lower BP and dilate coronaries without further slowing HR
- Avoid diltiazem or verapamil - would dangerously compound bradycardia (Lippincott case, 12.5)
- Choose beta-blocker first (proven mortality benefit post-MI)
- If CCB needed (e.g., beta-blocker intolerant): use amlodipine, not verapamil/diltiazem
- Beta-blockers have proven post-MI survival benefit; CCBs have not (Harrison's, 22nd ed.)
- All CCBs effective; DHPs (amlodipine, nifedipine XL) are first preference
- Beta-blockers are not only ineffective but may worsen vasospasm (unopposed alpha-mediated spasm)
- CCBs (especially amlodipine) are often more effective than ACE inhibitors/ARBs as monotherapy due to low-renin physiology (Goodman & Gilman's)
- Amlodipine is ideal - no effect on bronchial tone
- Beta-blockers are relatively or absolutely contraindicated
- Amlodipine + benazepril (ACE inhibitor) was superior to benazepril + hydrochlorothiazide for cardiovascular events (Goodman & Gilman's)
Summary "One-liner" for Each Drug
| Drug | One-liner |
|---|---|
| Amlodipine | Long-acting DHP; most vascular-selective; once daily; safe in HF, asthma, bradycardia; best for HTN + angina combination |
| Nifedipine IR | Avoid - too rapid, causes reflex tachycardia and increased MI risk; only XL/SR formulations acceptable |
| Nifedipine XL | Acceptable DHP for HTN/angina; shorter half-life than amlodipine; useful in Raynaud |
| Diltiazem | Intermediate; rate-controlling in AF/SVT; good for angina; avoid in HFrEF, AV block; causes less constipation than verapamil |
| Verapamil | Most cardiac; best rate control; hallmark SE is constipation; avoid with beta-blockers, in HFrEF, AV block, WPW; useful in HOCM, migraines, SVT |
Acnae VALGARIS
acne vulgaris clinical photo comedones papules pustules nodules grades severity
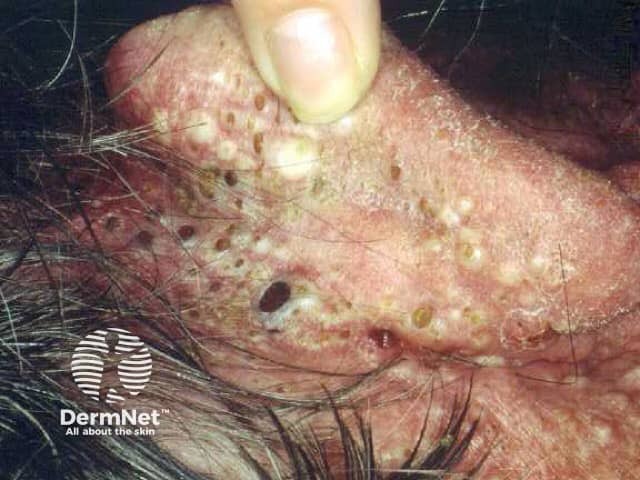
Clinical photograph of the face focusing on pilosebaceous units in the central facial region. This high-magnification close-up reveals multiple open comedones with keratin plugs, several closed comedones, and inflammatory papules and pustules. Deeper nodules or cystic lesions are present, producing a nodular aspect with surrounding erythema and oily, sebaceous-active skin. The distribution is characteristic of acne vulgaris, predominantly involving the cheeks and perioral areas. The image captures a spectrum from noninflammatory comedones to inflammatory and nodulocystic components, reflecting follicular obstruction and sebaceous gland hyperactivity. Clinically, this pattern is associated with acne severity that can lead to scarring if inadequately treated. Differential considerations include folliculitis and rosacea (rosacea less likely given comedones), sebaceous hyperplasia, and keratosis pilaris with follicular involvement. This photo is valuable for dermatology education, patient counseling, and research on acne pathophysiology and treatment response. Potential applications encompass training in recognition of open and closed comedones, assessment of inflammatory burden, and monitoring response to topical therapies (retinoids, benzoyl peroxide) and systemic options (antibiotics, isotretinoin). Additional observations include follicular plugging, surface scale, microcrusting, post-inflammatory hyperpigmentation, and signs of early scarring potential. The close view supports standardized lesion counting and severity grading for clinical trials and educational demonstrations, as well as patient-specific treatment planning and outcome tracking.
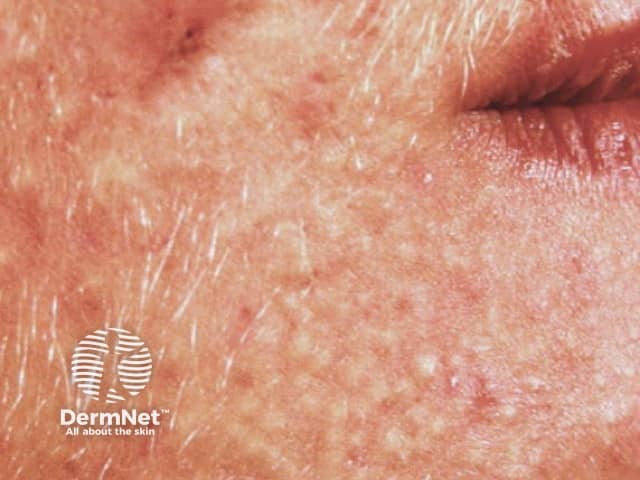
Clinical photograph of adult facial skin showing acne vulgaris. Modality: color digital photography; close-up frontal view of left cheek and perioral region. The skin shows numerous small inflammatory papules and closed comedones within erythematous background. Surface shows rough texture, post-inflammatory hyperpigmentation; no visible pustules or nodules beyond papules; sebaceous prominence; mild focal scarring. The distribution is predominantly in the central to lower cheek and perioral zones; symmetric involvement is suspected though lateralization not certain in this single frame. The visual features correspond to acne vulgaris, predominantly non-inflammatory comedones and mild inflammatory papules; differential includes rosacea (erythema with flushing and telangiectasia), folliculitis, perioral dermatitis. Clinically significant due to risk of scarring if untreated; management typically includes topical retinoids (tretinoin, adapalene), benzoyl peroxide, salicylic acid, topical/oral antibiotics, hormonal therapy in women; isotretinoin in severe cases. This image provides educational reference for adult-onset facial acne assessment, severity grading (milDer-type with comedones and papules), and therapy planning. Notable clinical context: identify pilosebaceous unit involvement, comedone formation, and post-inflammatory hyperpigmentation. Educational value includes recognizing lesion morphology, distinguishing acne from similar mimics, and selecting appropriate imaging-assisted documentation for follow-up, patient education, and clinical trials evaluating novel anti-acne therapies. This supports standardized severity assessment and treatment planning.
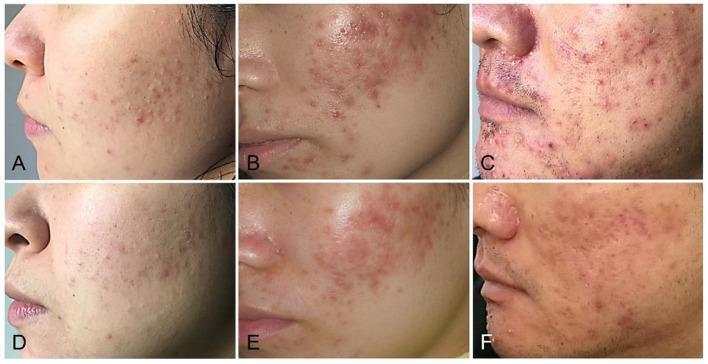
A series of clinical photographs illustrating the treatment of acne vulgaris categorized by severity. The top row (A, B, C) shows 'before' images, and the bottom row (D, E, F) shows 'after' images following a 2-month combined therapy. Panels A and D represent a mild case, showing a reduction in small, scattered inflammatory papules and comedones. Panels B and E depict a moderate case, showing a significant decrease in the density of erythematous papules and pustules on the cheek. Panels C and F represent a severe case, demonstrating an improvement in widespread inflammatory lesions, nodules, and post-inflammatory hyperpigmentation. Overall, the post-treatment images (D-F) show marked improvement in skin texture, a reduction in total lesion count, and a decrease in associated erythema across different grades of acne severity.
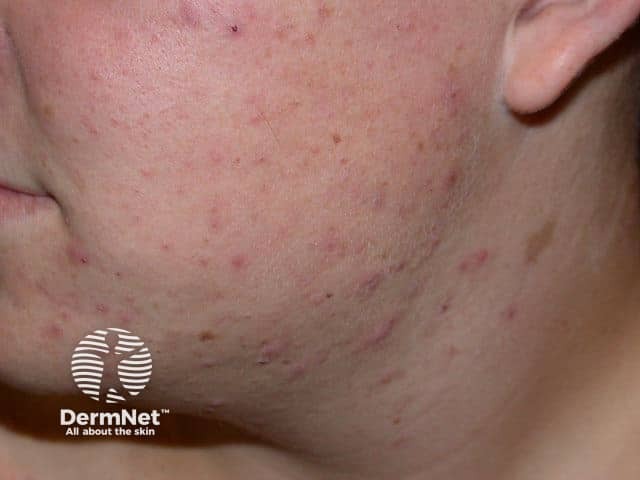
Clinical photography of the left facial skin demonstrates an acneiform eruption involving the left cheek and mandible. Modality: Digital clinical photography; technique: standard unpolarized light, frontal-left oblique perspective capturing the dermal and pilosebaceous units. Anatomical location includes facial skin in the dermal and epidermal compartments with emphasis on the zygomatic and mandibular regions. Visual features: scattered erythematous papules and pustules of varying size scattered across the malar region and jawline, with some small open comedones. Adjacent areas show macular hyperpigmentation consistent with post-inflammatory hyperpigmentation. Skin texture is uneven with mild edema, and there may be shallow scarring or atrophic changes in chronic lesions. Pathophysiology: acne vulgaris affecting pilosebaceous units; inflammation ranges from papular to pustular, with follicular plugging producing comedones. Clinical significance: typical adolescent-to-young-adult acne; differential includes rosacea (erythematous papules, flushing), folliculitis, and keratosis pilaris; imaging not used for diagnosis but this photo is instrumental for clinical assessment and treatment planning. Potential clinical use: educational dermatology resource, baseline documentation for therapy response (topical retinoids, benzoyl peroxide, antibiotics, hormonal therapy as indicated), patient counseling, research on acne severity scoring. This image may aid clarity for students learning acne morphology, helps distinguish inflammatory papules from nodules, and supports standardized lesion counting and grading scales used in clinical trials.
Acne Vulgaris
Definition & Epidemiology
Pathogenesis - Four Key Factors
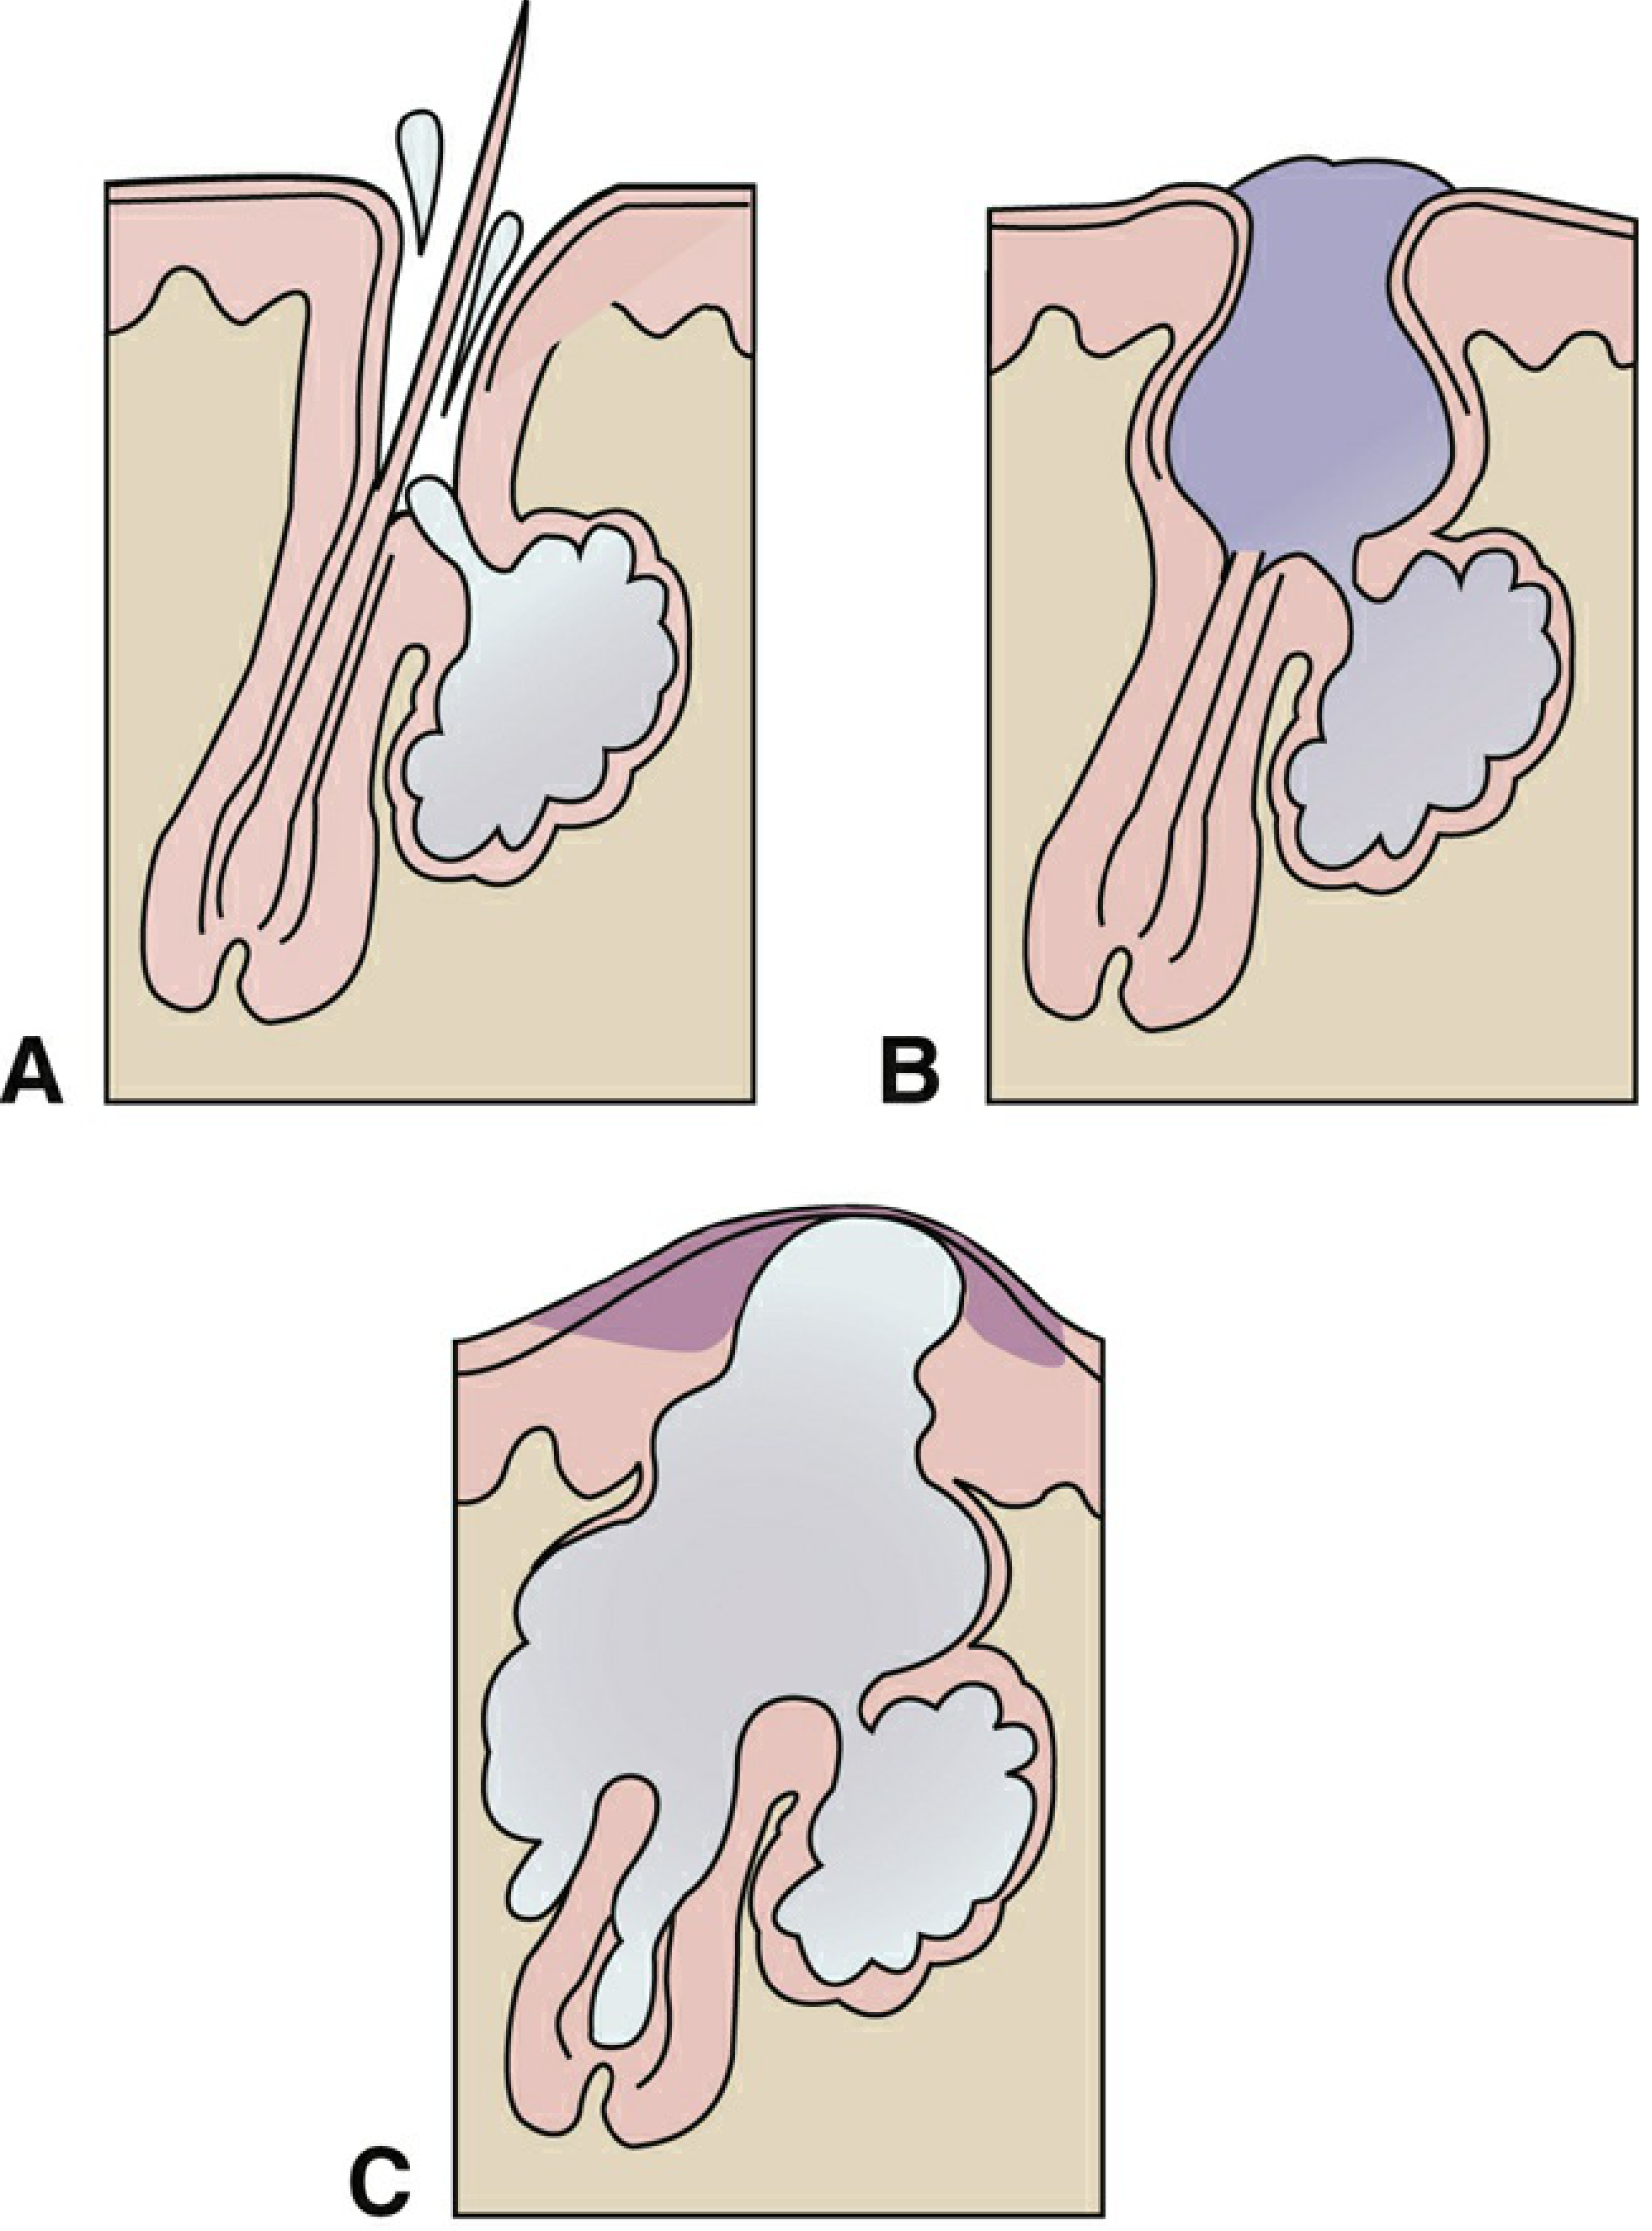
1. Abnormal Follicular Keratinization
2. Excess Sebum Production (Seborrhea)
- Sebaceous glands are stimulated by androgens, particularly dihydrotestosterone (DHT)
- DHT is converted from testosterone in the skin; this conversion is 30 times higher in acne-prone skin vs. normal skin
- In women, androstenedione is the main androgen precursor for DHT
- The onset of puberty triggers increased androgen production, explaining why acne peaks in adolescence
- Eunuchs (no testicular androgen) do not develop acne - historical proof of androgen dependence
- Key point: Excess sebum alone is insufficient. Patients with Parkinson disease have severe seborrhea but no acne - follicular keratinization must also be abnormal
3. Cutibacterium acnes Colonization
- C. acnes (formerly Propionibacterium acnes) is a gram-positive anaerobe that is a normal resident of the pilosebaceous unit
- The obstructed, lipid-rich, low-O₂ environment of the plugged follicle promotes its proliferation
- C. acnes produces lipases that cleave triglycerides in sebum into free fatty acids (FFAs)
- FFAs:
- Alter the keratinization pattern within the infundibulum
- Are chemotactic for neutrophils (driving inflammation)
- Trigger cytokine release
- Note: High-dose vitamin B12 supplementation increases porphyrin production by C. acnes, worsening acne
4. Inflammation
- Follicular wall weakening leads to rupture, extruding oily/keratinous debris into the dermis
- A foreign-body inflammatory reaction develops with lymphocytes, macrophages, and neutrophils
- Dermal abscesses can form, leading to scarring
- Inflammatory mediators including IL-1, TNF-α, and TLR-2 signaling are involved
Clinical Features & Lesion Types
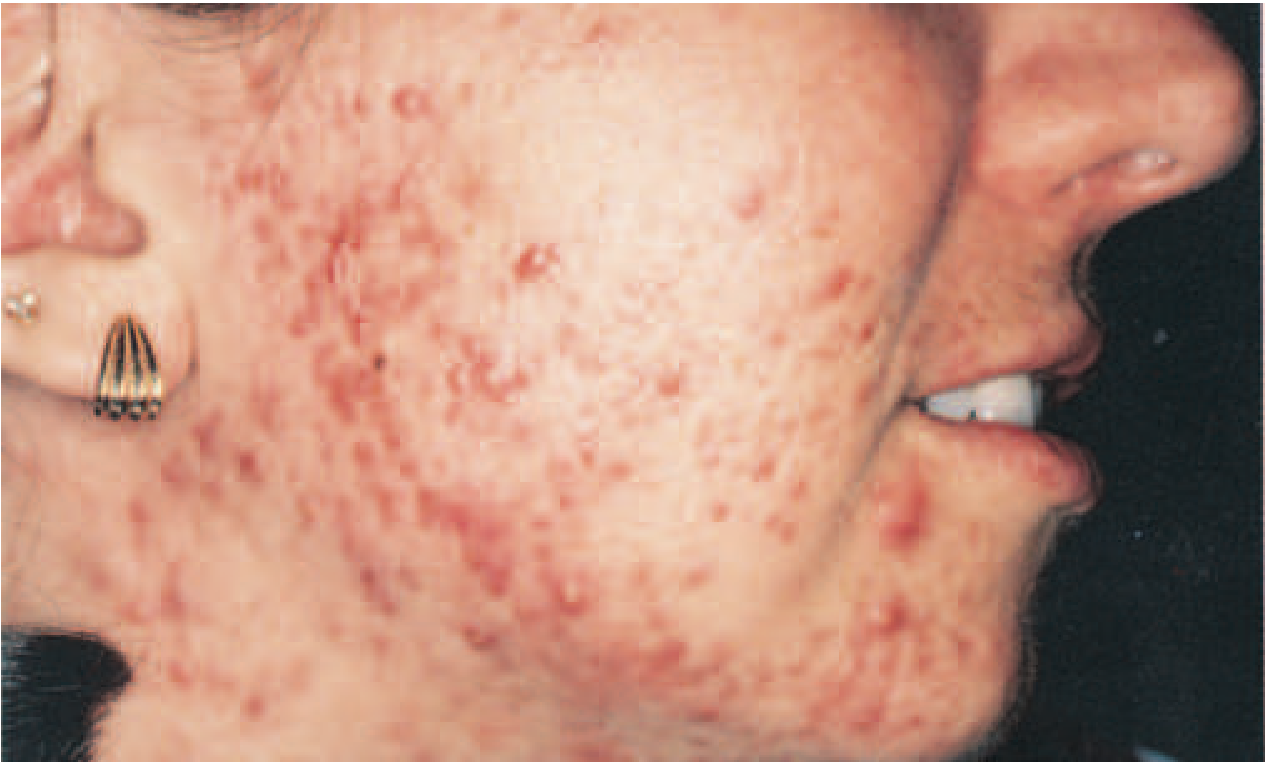
Non-Inflammatory Lesions
| Lesion | Description |
|---|---|
| Closed comedone (whitehead) | 1-2 mm pebbly white papule; follicular orifice closed; contents not easily expressed; precursor of inflammatory lesions |
| Open comedone (blackhead) | Dilated follicular orifice filled with oxidized, darkened debris; black color due to melanin oxidation (NOT dirt); rarely leads to inflammatory lesions |
Inflammatory Lesions
| Lesion | Description |
|---|---|
| Papule | Small, solid, raised red lesion; early inflammatory |
| Pustule | Papule with visible pus; neutrophil-rich |
| Nodule | Deep, large (>5 mm), firm, painful; may last weeks; high scarring risk |
| Cyst | Fluctuant, deeper; true cystic contents |
Severe Variants
- Acne conglobata: Interconnected nodules and abscesses; sinus tract formation; severe scarring
- Acne fulminans: Acute onset, systemic symptoms (fever, arthralgia); rare
Distribution
- Face most common (forehead first in adolescence, then cheeks, nose, chin)
- Chest and back also frequently involved (areas with highest sebaceous gland density)
Severity Grading
| Grade | Features |
|---|---|
| Mild | Predominantly comedonal; few papules/pustules; no nodules |
| Moderate | Multiple papules and pustules; few nodules; limited scarring |
| Severe | Many papules/pustules; nodules and cysts; significant scarring potential |
| Very severe | Conglobata/fulminans; systemic features |
Exacerbating Factors
- Mechanical friction - headbands, chin straps, tight collars
- Comedogenic products - certain cosmetics, hair products (occlusion)
- Drugs: Glucocorticoids (topical or systemic), testosterone, anabolic steroids, lithium, phenytoin, iodides, bromides, EGFR inhibitors (cetuximab, gefitinib - cause follicular hyperkeratosis)
- Occupational: Cutting oils, chlorinated hydrocarbons, coal tar
- Hormonal: PCOS, congenital adrenal hyperplasia, androgen-secreting tumors
- Hereditary component: Familial clustering observed
Treatment - Stepwise Approach
Treatment Algorithm (Fitzpatrick's Dermatology, 5th ed.)
| Severity | First-Line | Second-Line | Female Add-on | Procedures |
|---|---|---|---|---|
| Mild (comedonal) | Topical retinoid | Dapsone / azelaic acid / salicylic acid | - | Comedone extraction |
| Moderate (papulopustular) | Topical retinoid + topical antimicrobial | Dapsone / azelaic acid | - | Comedone extraction; laser/light therapy |
| Severe (papulopustular) | Oral antibiotic + topical retinoid ± BPO | Oral antibiotic ± topical retinoid ± BPO | Oral contraceptive/antiandrogen | Same + photodynamic therapy |
| Nodular | Oral antibiotic + topical retinoid ± BPO | Oral isotretinoin or oral AB + retinoid | Oral contraceptive/antiandrogen | Intralesional corticosteroid |
| Conglobata/Fulminans | Oral isotretinoin ± oral corticosteroids | High-dose oral AB + retinoid + BPO | Oral contraceptive/antiandrogen | Intralesional CS; laser |
| Maintenance (all) | Topical retinoid ± BPO | - | - | - |
Pharmacology of Acne Agents
1. Retinoids (Vitamin A Derivatives)
| Agent | Route | Use |
|---|---|---|
| Tretinoin | Topical | Mild-moderate acne |
| Adapalene | Topical | Mild-moderate acne; better tolerated |
| Tazarotene | Topical | Mild-moderate; more potent, more irritating |
| Isotretinoin (13-cis-retinoic acid) | Oral | Severe nodular/cystic acne; conglobata |
- Dramatically reduces sebaceous gland size and sebum output
- Also comedolytic, anti-inflammatory, and reduces C. acnes
- Dosing: weight-based, cumulative total dose dictates duration
- Adverse effects: Dry skin (very common), cheilitis (dry cracked lips), elevated triglycerides, hepatotoxicity (monitor LFTs), night vision changes, arthralgias
- Teratogenicity: Category X - absolutely contraindicated in pregnancy. Requires enrollment in the iPLEDGE program (US): two negative pregnancy tests before starting, negative test before each monthly refill, two contraception methods simultaneously
- Prescribers must be registered in iPLEDGE
2. Benzoyl Peroxide (BPO)
- Mechanism: Oxidizing bactericidal agent - lethal to C. acnes; also comedolytic and anti-inflammatory
- Key advantage: No bacterial resistance develops (unlike antibiotics)
- Available as washes, foams, creams, gels
- Adverse effects: Dry skin, irritation, bleaching of fabrics/bedding, contact dermatitis
- Should be combined with topical antibiotics to prevent resistance
3. Antibiotics (Topical and Oral)
- Clindamycin (solution or gel) - most commonly used
- Erythromycin (cream, gel, lotion)
- Minocycline topical foam - newer option
- Should always be combined with BPO to prevent resistance
- Doxycycline 100 mg BID (or low-dose extended-release) - first choice
- Minocycline 100 mg BID
- Sarecycline - newer, narrower spectrum tetracycline; less GI flora disruption; FDA approved for moderate-severe acne
- Macrolides (erythromycin, azithromycin) - alternatives in pregnancy (tetracyclines contraindicated in pregnancy)
- Adequate response expected at 3 months
- Use for shortest duration possible; discontinue once lesions clear; switch to topical maintenance
- Key concern: Antibiotic resistance - growing clinical problem
4. Azelaic Acid
- Naturally occurring dicarboxylic acid
- Multiple mechanisms: Antibacterial (inhibits C. acnes protein synthesis), anti-inflammatory, comedolytic, and inhibits keratinocyte differentiation
- Bonus: Lightening effect on hyperpigmented skin - useful for post-inflammatory hyperpigmentation (PIH) after acne
- Available as cream and gel
- Well tolerated; mild transient burning/stinging/tingling
5. Dapsone
- Sulfone with anti-inflammatory (reduces TNF-α, inhibits neutrophil function) and antibacterial activity
- Topical gel formulation
- Reduces both inflammatory and non-inflammatory lesion counts
- Adverse effects: transient oiliness, dryness, erythema
6. Salicylic Acid
- Keratolytic; promotes comedolysis
- Useful in mild comedonal acne
- OTC available; well-tolerated
7. Hormonal Therapy (Females Only)
- Decrease circulating free androgens → reduce sebum production
- Multiple FDA-approved OCPs for acne (e.g., Ortho Tri-Cyclen, Yaz)
- Used in moderate-severe acne in females
- Antiandrogen (blocks androgen receptors in sebaceous glands)
- "Safe, effective, and durable" treatment in women (Harrison's)
- Not used in males (gynecomastia)
- Topical antiandrogen receptor antagonist
- FDA-approved for acne; acts locally without systemic antiandrogenic effects
Pathology (Histology)
| Stage | Microscopic Features |
|---|---|
| Open comedone | Large, wide (patulous) follicular orifice; no significant inflammation |
| Closed comedone | Orifice identifiable only microscopically; potential for rupture |
| Papule/Pustule | Lymphocyte/macrophage infiltrate around follicle; neutrophilic acute inflammation |
| Rupture | Follicular wall disruption; dermal abscess; foreign body giant cells |
| Late/Severe | Dermal scarring; sinus tracts (in acne conglobata) |
Complications
- Scarring - from nodular/cystic acne or picking; can be atrophic (icepick, rolling, boxcar) or hypertrophic/keloid
- Post-inflammatory hyperpigmentation (PIH) - especially in darker skin types
- Post-inflammatory erythema
- Psychosocial impact - significant effects on self-esteem, anxiety, and depression; independent of severity
Refractory Acne - Workup
- Poor compliance (check first)
- Gram-negative folliculitis (mimics acne; treat with isotretinoin or appropriate antibiotics)
- In females: PCOS, adrenal or ovarian androgen-secreting tumors, congenital adrenal hyperplasia (CAH)
- In males: Exogenous androgen use (anabolic steroids); rarely CAH