
Generate a pdf of 30 marks answer with diagrams for Postgraduate Anaesthesia exam on the topic buffer systems
buffer system bicarbonate Henderson-Hasselbalch diagram acid base
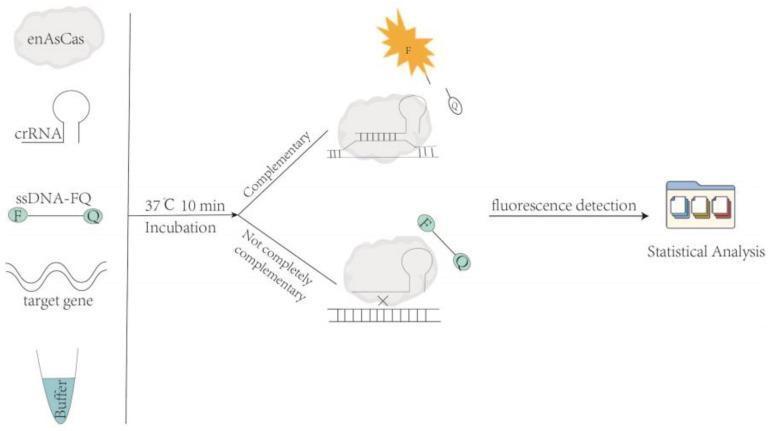
This pathophysiology diagram illustrates the in vitro mechanism of the CRISPR/enAsCas12a assay system used for nucleic acid detection and Single Nucleotide Polymorphism (SNP) identification. The workflow begins on the left with initial components: enAsCas12a protein (cloud-like shape), crRNA (hairpin structure), an ssDNA-FQ reporter (fluorophore-linker-quencher), a target gene (wavy DNA strand), and reaction buffer. Following incubation at 37°C for 10 minutes, the algorithm branches into two outcomes based on crRNA-target complementarity. In the 'Complementary' pathway, the crRNA binds perfectly to the target within the enAsCas complex, activating its trans-cleavage activity; this results in the cleavage of the ssDNA-FQ reporter, releasing a fluorescent signal (depicted by a starburst 'F'). In the 'Not completely complementary' pathway (representing an SNP mismatch, marked by an 'X'), the enzyme remains inactive, the reporter stays intact, and no fluorescence is generated. Both pathways culminate in fluorescence detection and statistical analysis, represented by a data folder icon. The diagram highlights the system's specificity for molecular diagnostics and genetic analysis.
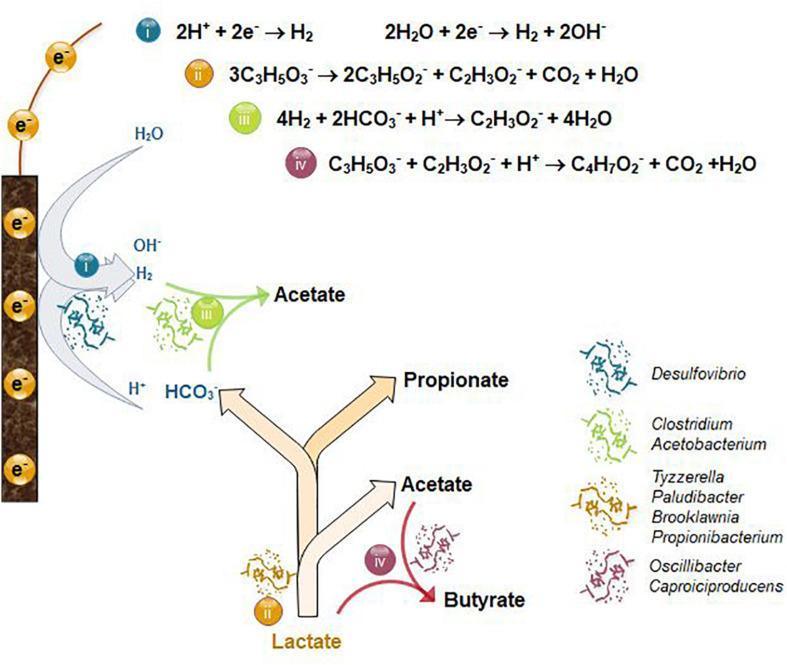
This pathophysiology diagram illustrates the metabolic pathways of cathodic electrofermentation of lactate within a bioelectrochemical system. The diagram is organized into four key reactions (i-iv) involving specific microbial genera. Reaction (i) shows bioelectrochemical hydrogen production (H2) at a cathode electrode, catalyzed by Desulfovibrio. Reaction (ii) depicts lactate fermentation into propionate, acetate, and CO2, associated with Tyzzerella, Paludibacter, Brooklawnia, and Propionibacterium. Reaction (iii) illustrates homoacetogenesis, where H2 and bicarbonate (HCO3-) are converted to acetate by Clostridium and Acetobacterium. Reaction (iv) shows butyrate production via chain elongation from lactate and acetate, involving Oscillibacter and Caproiciproducens. The visual flow highlights the synergy between the electrode's electron (e-) transfer and microbial metabolism. The diagram serves as an educational tool for understanding anaerobic microbiology, microbial electrosynthesis (MES), and the industrial application of volatile fatty acid (VFA) production.
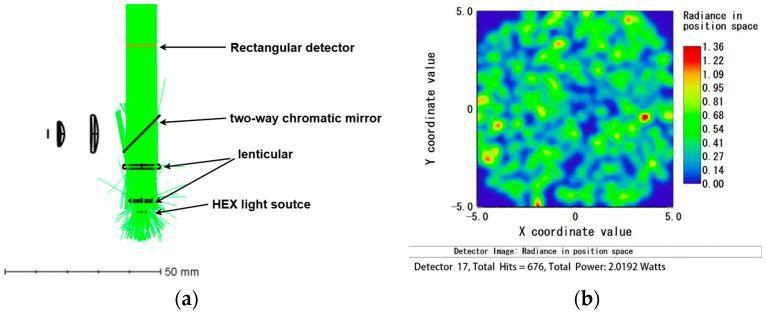
This figure illustrates the optical path simulation for an automated nucleic acid detection system using fluorescence sensing. Panel (a) is an optical system diagram showing the HEX light source path. The assembly includes a light source at the base, followed by a lenticular lens to focus the beam. The light travels vertically through a two-way chromatic (dichroic) mirror toward a rectangular detector positioned at the top. Two additional lenses are visible to the left of the main vertical path, representing components of a multi-channel excitation system. Panel (b) is a heat map displaying the 'Radiance in position space' on the detector window. The plot uses a color gradient from blue (0.00) to red (1.36) to show the spatial distribution of light intensity. The pattern is mottled, indicating non-uniform radiance across the 10x10 mm detection area (X and Y coordinates from -5.0 to 5.0). The simulation data notes a total power of 2.0192 Watts and 676 hits. This setup is clinically relevant for RT-LAMP or PCR-based point-of-care diagnostics, specifically for detecting viral targets like SARS-CoV-2 via fluorescent dye excitation.
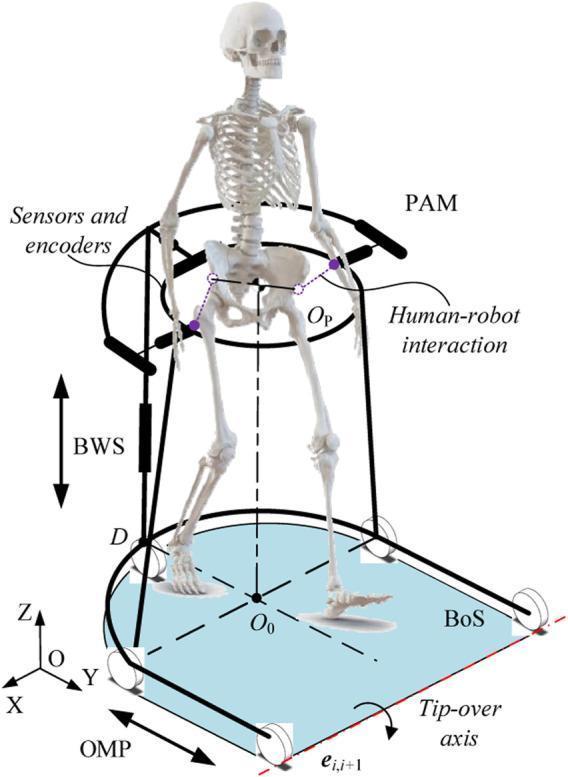
Anatomical diagram and conceptual model of a robotic walker designed for gait assistance and rehabilitation. The illustration features a human skeletal model positioned within a three-part robotic system. The base is an Omnidirectional Mobile Platform (OMP) equipped with three uniformly distributed wheels for multi-directional mobility, defining the Base of Support (BoS). Rising from the base is a Body Weight Support (BWS) system, indicated by vertical arrows representing height adjustment for offloading weight. At the waist level, a Pelvic Assist Mechanism (PAM) is shown, featuring sensors and encoders to detect pelvic rotation and obliquity. Dashed lines illustrate the human-robot interaction point at the pelvic center. The diagram includes a 3D coordinate system (OXYZ) and a tip-over axis indicator to demonstrate the device's mechanical stability. This visual is intended for physical therapy and biomedical engineering education, focusing on assistive technology for lower extremity motor function recovery.
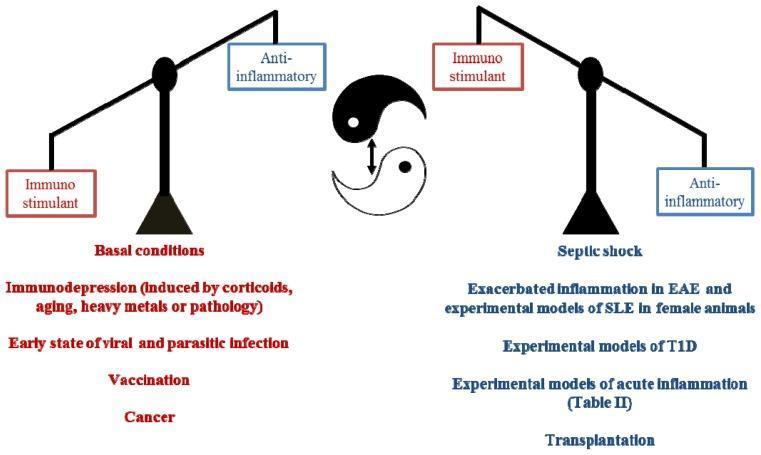
A pathophysiology diagram illustrating the dual role of melatonin as an 'immunological buffer.' The visual is organized into two contrasting sections separated by a central yin-yang symbol with a double-headed arrow, representing dynamic equilibrium. The left side, labeled 'Basal conditions' in red text, features a balance scale weighted toward 'Immunostimulant' (red box) over 'Anti-inflammatory' (blue box). It lists scenarios requiring immune enhancement: immunodepression (due to corticoids, aging, or pathology), early viral/parasitic infections, vaccination, and cancer. The right side, labeled 'Septic shock' in blue text, features a scale weighted toward 'Anti-inflammatory' (blue box) over 'Immunostimulant' (red box). This side lists conditions of exacerbated inflammation, including experimental models of SLE, EAE, Type 1 Diabetes (T1D), acute inflammation, and transplantation. The diagram demonstrates melatonin's pleiotropic ability to stimulate the immune system under basal/suppressed states while providing anti-inflammatory regulation during hyper-inflammatory crises.
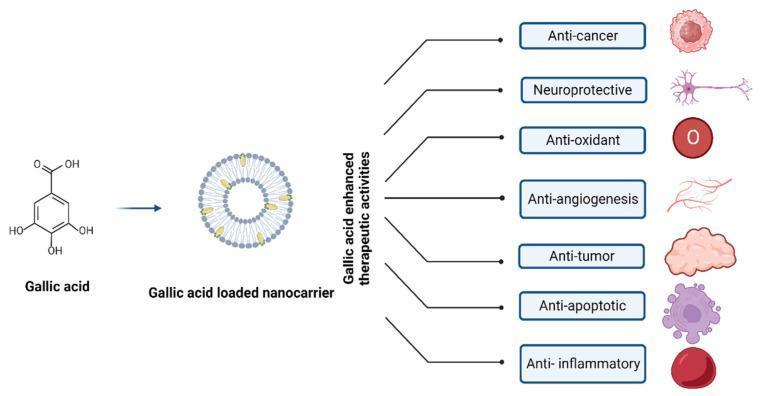
This medical pharmacology diagram illustrates the drug delivery and therapeutic profile of gallic acid (GA) when formulated within a nanocarrier system. The process begins with the chemical structure of gallic acid, a triphenolic compound, which is then encapsulated into a spherical nanocarrier, depicted as a vesicular or liposomal lipid bilayer structure. The central part of the diagram indicates that this nanocarrier system enhances the bioavailability and pharmacological efficacy of the molecule. The right side of the infographic lists seven key therapeutic activities, each paired with a representative icon: Anti-cancer (cancerous cell), Neuroprotective (neuron), Anti-oxidant (oxygen molecule symbol), Anti-angiogenesis (capillary network), Anti-tumor (tumor mass), Anti-apoptotic (apoptotic cell with blebbing), and Anti-inflammatory (red blood cell/inflammatory context). The diagram summarizes how nanotechnology-based delivery of this herbal polyphenol can be leveraged across oncology, neurology, and inflammatory medicine to improve clinical outcomes.
mkdir -p /tmp/workspace/buffer-systems-exam && ls /tmp/workspace/
~/buffer-systems-exam/generate_pdf.py
#!/usr/bin/env python3
"""
Generate a comprehensive 30-mark PG Anaesthesia exam answer on Buffer Systems
with diagrams using ReportLab.
"""
import urllib.request
import io
import os
from reportlab.lib.pagesizes import A4
from reportlab.lib import colors
from reportlab.lib.units import cm, mm
from reportlab.lib.styles import getSampleStyleSheet, ParagraphStyle
from reportlab.lib.enums import TA_CENTER, TA_LEFT, TA_JUSTIFY
from reportlab.platypus import (
SimpleDocTemplate, Paragraph, Spacer, Table, TableStyle,
HRFlowable, KeepTogether, Image, PageBreak
)
from reportlab.platypus.flowables import Flowable
from reportlab.graphics.shapes import Drawing, Rect, Line, String, Circle, Polygon, PolyLine, Arrow
from reportlab.graphics.charts.lineplots import LinePlot
from reportlab.graphics import renderPDF
from reportlab.pdfgen import canvas
import math
# ─── Page setup ─────────────────────────────────────────────────────────────
OUTPUT = "/tmp/workspace/buffer-systems-exam/Buffer_Systems_PG_Anaesthesia.pdf"
PAGE_W, PAGE_H = A4
MARGIN = 2.0 * cm
# ─── Colours ────────────────────────────────────────────────────────────────
DARK_BLUE = colors.HexColor("#1a3a5c")
MID_BLUE = colors.HexColor("#2563a8")
LIGHT_BLUE = colors.HexColor("#dbeafe")
TEAL = colors.HexColor("#0d9488")
LIGHT_TEAL = colors.HexColor("#ccfbf1")
GOLD = colors.HexColor("#b45309")
LIGHT_GOLD = colors.HexColor("#fef3c7")
RED = colors.HexColor("#b91c1c")
LIGHT_RED = colors.HexColor("#fee2e2")
LIGHT_GREY = colors.HexColor("#f1f5f9")
MID_GREY = colors.HexColor("#94a3b8")
DARK_GREY = colors.HexColor("#334155")
WHITE = colors.white
# ─── Styles ──────────────────────────────────────────────────────────────────
styles = getSampleStyleSheet()
def make_style(name, parent="Normal", **kw):
return ParagraphStyle(name, parent=styles[parent], **kw)
title_style = make_style("ExamTitle", "Normal",
fontSize=18, leading=24, textColor=WHITE,
fontName="Helvetica-Bold", alignment=TA_CENTER)
subtitle_style = make_style("ExamSubtitle", "Normal",
fontSize=11, leading=14, textColor=colors.HexColor("#bfdbfe"),
fontName="Helvetica", alignment=TA_CENTER)
marks_style = make_style("Marks", "Normal",
fontSize=10, leading=13, textColor=WHITE,
fontName="Helvetica-BoldOblique", alignment=TA_CENTER)
h1_style = make_style("H1", "Normal",
fontSize=13, leading=17, textColor=WHITE,
fontName="Helvetica-Bold", alignment=TA_LEFT,
leftIndent=4, spaceBefore=4)
h2_style = make_style("H2", "Normal",
fontSize=11, leading=15, textColor=DARK_BLUE,
fontName="Helvetica-Bold", alignment=TA_LEFT,
spaceBefore=8, spaceAfter=3)
h3_style = make_style("H3", "Normal",
fontSize=10, leading=14, textColor=MID_BLUE,
fontName="Helvetica-Bold", alignment=TA_LEFT,
spaceBefore=5, spaceAfter=2)
body_style = make_style("Body", "Normal",
fontSize=9.5, leading=14, textColor=DARK_GREY,
fontName="Helvetica", alignment=TA_JUSTIFY,
spaceAfter=4)
equation_style = make_style("Eq", "Normal",
fontSize=10, leading=15, textColor=DARK_BLUE,
fontName="Helvetica-Bold", alignment=TA_CENTER,
spaceBefore=4, spaceAfter=4)
bullet_style = make_style("Bullet", "Normal",
fontSize=9.5, leading=13.5, textColor=DARK_GREY,
fontName="Helvetica", leftIndent=14, bulletIndent=4,
spaceAfter=2)
caption_style = make_style("Caption", "Normal",
fontSize=8.5, leading=12, textColor=MID_GREY,
fontName="Helvetica-Oblique", alignment=TA_CENTER,
spaceAfter=6)
table_header_style = make_style("TH", "Normal",
fontSize=9, leading=12, textColor=WHITE,
fontName="Helvetica-Bold", alignment=TA_CENTER)
table_cell_style = make_style("TC", "Normal",
fontSize=9, leading=12, textColor=DARK_GREY,
fontName="Helvetica", alignment=TA_LEFT)
section_num_style = make_style("SecNum", "Normal",
fontSize=9, leading=12, textColor=GOLD,
fontName="Helvetica-Bold", alignment=TA_LEFT)
highlight_style = make_style("Highlight", "Normal",
fontSize=9.5, leading=13.5, textColor=DARK_BLUE,
fontName="Helvetica-BoldOblique", alignment=TA_CENTER,
spaceBefore=3, spaceAfter=3)
note_style = make_style("Note", "Normal",
fontSize=9, leading=13, textColor=colors.HexColor("#92400e"),
fontName="Helvetica-Oblique", alignment=TA_JUSTIFY,
leftIndent=8, rightIndent=8, spaceAfter=4)
# ─── Helper flowables ────────────────────────────────────────────────────────
class SectionHeader(Flowable):
"""Coloured banner for section headings."""
def __init__(self, text, sub="", bg=DARK_BLUE, width=None):
super().__init__()
self.text = text
self.sub = sub
self.bg = bg
self._w = width or (PAGE_W - 2 * MARGIN)
self._h = 28 if not sub else 38
def wrap(self, aw, ah):
return self._w, self._h
def draw(self):
c = self.canv
c.setFillColor(self.bg)
c.roundRect(0, 0, self._w, self._h, 5, fill=1, stroke=0)
c.setFillColor(WHITE)
c.setFont("Helvetica-Bold", 11)
y = self._h - 18 if self.sub else (self._h - 11) / 2 + 3
c.drawString(8, y, self.text)
if self.sub:
c.setFont("Helvetica-Oblique", 8.5)
c.setFillColor(colors.HexColor("#bfdbfe"))
c.drawString(10, 7, self.sub)
class ColorBox(Flowable):
"""Coloured background box for highlighted content."""
def __init__(self, content_height, bg=LIGHT_BLUE, width=None, radius=4):
super().__init__()
self._h = content_height
self.bg = bg
self._w = width or (PAGE_W - 2 * MARGIN)
self.radius = radius
def wrap(self, aw, ah):
return self._w, self._h
def draw(self):
c = self.canv
c.setFillColor(self.bg)
c.roundRect(0, 0, self._w, self._h, self.radius, fill=1, stroke=0)
def hline(color=MID_GREY, thickness=0.5):
return HRFlowable(width="100%", thickness=thickness, color=color, spaceAfter=4, spaceBefore=4)
def sp(h=6):
return Spacer(1, h)
def bullet(text, style=None):
st = style or bullet_style
return Paragraph(f"• {text}", st)
# ─── DIAGRAMS ────────────────────────────────────────────────────────────────
def diagram_buffer_definition():
"""Simple conceptual diagram: weak acid / conjugate base equilibrium."""
W, H = 460, 90
d = Drawing(W, H)
# Background
d.add(Rect(0, 0, W, H, fillColor=LIGHT_BLUE, strokeColor=None))
# Left box: Weak Acid (HA)
d.add(Rect(10, 20, 110, 50, fillColor=MID_BLUE, strokeColor=None, rx=6))
d.add(String(30, 52, "HA", fontName="Helvetica-Bold", fontSize=14, fillColor=WHITE))
d.add(String(16, 37, "(Weak Acid)", fontName="Helvetica", fontSize=8, fillColor=colors.HexColor("#bfdbfe")))
# Right box: Conjugate Base (A-)
d.add(Rect(340, 20, 110, 50, fillColor=TEAL, strokeColor=None, rx=6))
d.add(String(360, 52, "A⁻", fontName="Helvetica-Bold", fontSize=14, fillColor=WHITE))
d.add(String(348, 37, "(Conj. Base)", fontName="Helvetica", fontSize=8, fillColor=colors.HexColor("#a7f3d0")))
# Middle: H+ ion
d.add(Circle(230, 45, 20, fillColor=colors.HexColor("#f59e0b"), strokeColor=None))
d.add(String(222, 41, "H⁺", fontName="Helvetica-Bold", fontSize=12, fillColor=WHITE))
# Arrows
# Forward arrow (HA -> H+ + A-)
d.add(Line(122, 55, 208, 55, strokeColor=DARK_BLUE, strokeWidth=1.5))
d.add(Polygon([208, 55, 200, 60, 200, 50], fillColor=DARK_BLUE, strokeColor=None))
d.add(String(145, 60, "Release H⁺", fontName="Helvetica", fontSize=7.5, fillColor=DARK_GREY))
# Reverse arrow (A- + H+ -> HA)
d.add(Line(252, 38, 338, 38, strokeColor=TEAL, strokeWidth=1.5))
d.add(Polygon([252, 38, 260, 43, 260, 33], fillColor=TEAL, strokeColor=None))
d.add(String(270, 26, "Accept H⁺", fontName="Helvetica", fontSize=7.5, fillColor=TEAL))
# Title
d.add(String(130, 78, "BUFFER = Weak Acid + Conjugate Base Pair", fontName="Helvetica-Bold", fontSize=9, fillColor=DARK_BLUE))
return d
def diagram_bicarbonate_system():
"""CO2/HCO3- buffer system chain reaction diagram."""
W, H = 480, 120
d = Drawing(W, H)
d.add(Rect(0, 0, W, H, fillColor=colors.HexColor("#f0f9ff"), strokeColor=None))
boxes = [
(10, 40, 70, 40, "CO₂\n+ H₂O", MID_BLUE),
(120, 40, 70, 40, "H₂CO₃", colors.HexColor("#1e40af")),
(240, 40, 70, 40, "H⁺", colors.HexColor("#b91c1c")),
(350, 40, 80, 40, "HCO₃⁻", TEAL),
]
for (x, y, w, h, lbl, col) in boxes:
d.add(Rect(x, y, w, h, fillColor=col, strokeColor=None, rx=5))
lines = lbl.split('\n')
if len(lines) == 2:
d.add(String(x + w/2 - len(lines[0])*3.2, y + 26, lines[0], fontName="Helvetica-Bold", fontSize=10, fillColor=WHITE))
d.add(String(x + w/2 - len(lines[1])*2.8, y + 14, lines[1], fontName="Helvetica", fontSize=8.5, fillColor=WHITE))
else:
d.add(String(x + w/2 - len(lbl)*3.2, y + 18, lbl, fontName="Helvetica-Bold", fontSize=11, fillColor=WHITE))
# Arrows between boxes
arrow_data = [
(80, 60, 120, 60),
(190, 60, 240, 60),
(310, 60, 350, 60),
]
for (x1, y1, x2, y2) in arrow_data:
d.add(Line(x1, y1, x2-8, y1, strokeColor=DARK_GREY, strokeWidth=1.5))
d.add(Polygon([x2, y1, x2-8, y1+4, x2-8, y1-4], fillColor=DARK_GREY, strokeColor=None))
# Reverse arrow under the chain
d.add(Line(430, 28, 82, 28, strokeColor=GOLD, strokeWidth=1.2))
d.add(Polygon([82, 28, 90, 32, 90, 24], fillColor=GOLD, strokeColor=None))
d.add(String(220, 16, "← Carbonic Anhydrase catalyses reverse reaction", fontName="Helvetica-Oblique", fontSize=7.5, fillColor=GOLD))
# Labels above
d.add(String(85, 68, "Carbonic", fontName="Helvetica", fontSize=7, fillColor=MID_GREY))
d.add(String(83, 76, "Anhydrase", fontName="Helvetica", fontSize=7, fillColor=MID_GREY))
d.add(String(205, 72, "Ionises", fontName="Helvetica", fontSize=7, fillColor=MID_GREY))
# Title
d.add(String(100, 105, "Bicarbonate Buffer System: CO₂ ⇌ H₂CO₃ ⇌ H⁺ + HCO₃⁻", fontName="Helvetica-Bold", fontSize=9, fillColor=DARK_BLUE))
return d
def diagram_henderson_hasselbalch():
"""Visual representation of the Henderson-Hasselbalch equation."""
W, H = 460, 140
d = Drawing(W, H)
d.add(Rect(0, 0, W, H, fillColor=colors.HexColor("#fffbeb"), strokeColor=None))
# Main equation box
d.add(Rect(30, 60, 400, 55, fillColor=DARK_BLUE, strokeColor=None, rx=8))
d.add(String(50, 97, "pH = pKa + log", fontName="Helvetica-Bold", fontSize=13, fillColor=WHITE))
# Fraction
d.add(String(295, 102, "[HCO₃⁻]", fontName="Helvetica-Bold", fontSize=11, fillColor=colors.HexColor("#86efac")))
d.add(Line(293, 96, 380, 96, strokeColor=WHITE, strokeWidth=1.5))
d.add(String(295, 80, "0.03 × PaCO₂", fontName="Helvetica-Bold", fontSize=10, fillColor=colors.HexColor("#fca5a5")))
# pKa label
d.add(Rect(30, 30, 100, 25, fillColor=GOLD, strokeColor=None, rx=4))
d.add(String(36, 40, "pKa = 6.1", fontName="Helvetica-Bold", fontSize=10, fillColor=WHITE))
# Normal values
d.add(Rect(160, 30, 130, 25, fillColor=TEAL, strokeColor=None, rx=4))
d.add(String(165, 40, "[HCO₃⁻] = 24 mEq/L", fontName="Helvetica-Bold", fontSize=9, fillColor=WHITE))
d.add(Rect(310, 30, 120, 25, fillColor=MID_BLUE, strokeColor=None, rx=4))
d.add(String(315, 40, "PaCO₂ = 40 mmHg", fontName="Helvetica-Bold", fontSize=9, fillColor=WHITE))
# pH result
d.add(String(50, 14, "Normal pH = 6.1 + log(24 / 1.2) = 6.1 + log(20) = 6.1 + 1.3 = 7.40", fontName="Helvetica-Bold", fontSize=8.5, fillColor=DARK_GREY))
d.add(String(100, 128, "Henderson-Hasselbalch Equation for Bicarbonate Buffer", fontName="Helvetica-Bold", fontSize=9, fillColor=DARK_BLUE))
return d
def diagram_buffer_compartments():
"""Body fluid compartments and their buffer systems."""
W, H = 460, 160
d = Drawing(W, H)
d.add(Rect(0, 0, W, H, fillColor=LIGHT_GREY, strokeColor=None))
compartments = [
(10, 20, 130, 120, "BLOOD", [
"Bicarbonate (53%)",
"Haemoglobin (35%)",
"Plasma proteins (7%)",
"Phosphate (5%)",
], MID_BLUE, LIGHT_BLUE),
(160, 20, 130, 120, "INTERSTITIAL\nFLUID", [
"Bicarbonate (main)",
"Proteins (minor)",
"Phosphate (minor)",
], TEAL, LIGHT_TEAL),
(310, 20, 140, 120, "INTRACELLULAR\nFLUID", [
"Proteins (main)",
"Phosphate (high conc.)",
"Bicarbonate",
"Haemoglobin (RBC)",
], GOLD, LIGHT_GOLD),
]
for (x, y, w, h, title, items, hdr_col, bg_col) in compartments:
d.add(Rect(x, y, w, h, fillColor=bg_col, strokeColor=hdr_col, strokeWidth=1.2, rx=6))
# Header
d.add(Rect(x, y + h - 22, w, 22, fillColor=hdr_col, strokeColor=None, rx=5))
lines = title.split('\n')
if len(lines) == 2:
d.add(String(x + 5, y + h - 10, lines[0], fontName="Helvetica-Bold", fontSize=8, fillColor=WHITE))
d.add(String(x + 5, y + h - 20, lines[1], fontName="Helvetica-Bold", fontSize=8, fillColor=WHITE))
else:
d.add(String(x + 5, y + h - 13, title, fontName="Helvetica-Bold", fontSize=9, fillColor=WHITE))
for i, item in enumerate(items):
d.add(String(x + 7, y + h - 36 - i * 18, "• " + item, fontName="Helvetica", fontSize=7.5, fillColor=DARK_GREY))
d.add(String(100, 148, "Buffer Distribution Across Body Fluid Compartments", fontName="Helvetica-Bold", fontSize=9, fillColor=DARK_BLUE))
return d
def diagram_buffering_capacity():
"""pH titration curve-style diagram showing buffering zone."""
W, H = 420, 180
d = Drawing(W, H)
d.add(Rect(0, 0, W, H, fillColor=WHITE, strokeColor=None))
# Axes
ax_x, ax_y = 50, 30
ax_w, ax_h = 340, 120
d.add(Line(ax_x, ax_y, ax_x, ax_y + ax_h, strokeColor=DARK_GREY, strokeWidth=1.5))
d.add(Line(ax_x, ax_y, ax_x + ax_w, ax_y, strokeColor=DARK_GREY, strokeWidth=1.5))
# Axis labels
d.add(String(ax_x - 40, ax_y + ax_h/2, "pH", fontName="Helvetica-Bold", fontSize=9, fillColor=DARK_GREY))
d.add(String(ax_x + ax_w/2 - 40, ax_y - 20, "Added Strong Acid / Base (mEq/L)", fontName="Helvetica", fontSize=8, fillColor=DARK_GREY))
# pH values on Y axis
ph_vals = [6.0, 6.5, 7.0, 7.4, 7.5, 8.0]
for ph in ph_vals:
y = ax_y + (ph - 5.5) / 3.5 * ax_h
d.add(Line(ax_x - 4, y, ax_x, y, strokeColor=DARK_GREY, strokeWidth=0.8))
d.add(String(ax_x - 32, y - 4, f"{ph:.1f}", fontName="Helvetica", fontSize=7.5, fillColor=DARK_GREY))
# X-axis ticks (acid on left, base on right, 0 in middle)
for i, lbl in enumerate(["−20", "−10", "0", "+10", "+20"]):
x = ax_x + i * ax_w / 4
d.add(Line(x, ax_y - 4, x, ax_y, strokeColor=DARK_GREY, strokeWidth=0.8))
d.add(String(x - 8, ax_y - 15, lbl, fontName="Helvetica", fontSize=7.5, fillColor=DARK_GREY))
# Sigmoidal titration curve (approximated with polyline)
pts = [
(ax_x, ax_y + ax_h * 0.95), # high pH, strong base
(ax_x + 40, ax_y + ax_h * 0.88),
(ax_x + 80, ax_y + ax_h * 0.75),
(ax_x + 120, ax_y + ax_h * 0.60), # buffering zone upper
(ax_x + 170, ax_y + ax_h * 0.50), # pKa / centre
(ax_x + 220, ax_y + ax_h * 0.40), # buffering zone lower
(ax_x + 260, ax_y + ax_h * 0.25),
(ax_x + 300, ax_y + ax_h * 0.12),
(ax_x + 340, ax_y + ax_h * 0.05), # high acid
]
for i in range(len(pts) - 1):
d.add(Line(pts[i][0], pts[i][1], pts[i+1][0], pts[i+1][1], strokeColor=MID_BLUE, strokeWidth=2.0))
# Highlight buffering zone
bzone_x1, bzone_x2 = ax_x + 100, ax_x + 240
d.add(Rect(bzone_x1, ax_y, bzone_x2 - bzone_x1, ax_h, fillColor=colors.HexColor("#dbeafe80"), strokeColor=None))
d.add(String(bzone_x1 + 10, ax_y + ax_h * 0.55 + 5, "Buffering", fontName="Helvetica-Bold", fontSize=8, fillColor=MID_BLUE))
d.add(String(bzone_x1 + 18, ax_y + ax_h * 0.55 - 7, "Zone", fontName="Helvetica-Bold", fontSize=8, fillColor=MID_BLUE))
# pKa line
pka_y = ax_y + ax_h * 0.50
d.add(Line(ax_x, pka_y, ax_x + ax_w, pka_y, strokeColor=GOLD, strokeWidth=1, strokeDashArray=[4, 3]))
d.add(String(ax_x + ax_w + 4, pka_y - 4, "pKa", fontName="Helvetica-Bold", fontSize=8, fillColor=GOLD))
# Normal blood pH line
norm_y = ax_y + (7.4 - 5.5) / 3.5 * ax_h
d.add(Line(ax_x, norm_y, ax_x + ax_w, norm_y, strokeColor=RED, strokeWidth=1, strokeDashArray=[3, 3]))
d.add(String(ax_x + ax_w + 4, norm_y - 4, "7.40", fontName="Helvetica-Bold", fontSize=7.5, fillColor=RED))
d.add(String(100, 165, "Buffer Titration Curve - Maximum Buffering at pKa ± 1 pH Unit", fontName="Helvetica-Bold", fontSize=9, fillColor=DARK_BLUE))
return d
def diagram_isohydric_principle():
"""Diagram showing all buffer systems in equilibrium via [H+]."""
W, H = 440, 160
d = Drawing(W, H)
d.add(Rect(0, 0, W, H, fillColor=colors.HexColor("#f0fdf4"), strokeColor=None))
# Central H+ circle
cx, cy = 220, 80
d.add(Circle(cx, cy, 35, fillColor=RED, strokeColor=None))
d.add(String(cx - 14, cy + 5, "[H⁺]", fontName="Helvetica-Bold", fontSize=13, fillColor=WHITE))
d.add(String(cx - 32, cy - 10, "Common Ion", fontName="Helvetica", fontSize=7, fillColor=colors.HexColor("#fecaca")))
# Surrounding buffer systems
buffers = [
(60, 130, "Bicarbonate\nHCO₃⁻/H₂CO₃", MID_BLUE),
(60, 30, "Phosphate\nHPO₄²⁻/H₂PO₄⁻", TEAL),
(330, 130, "Haemoglobin\nHb/HHb", colors.HexColor("#7c3aed")),
(330, 30, "Plasma\nProteins", GOLD),
]
for (bx, by, label, col) in buffers:
d.add(Rect(bx - 40, by - 18, 80, 36, fillColor=col, strokeColor=None, rx=5))
lines = label.split('\n')
d.add(String(bx - 35, by + 4, lines[0], fontName="Helvetica-Bold", fontSize=8, fillColor=WHITE))
d.add(String(bx - 35, by - 8, lines[1], fontName="Helvetica", fontSize=7, fillColor=WHITE))
# Line from buffer to centre
# Calculate direction
dx = cx - bx
dy = cy - by
length = math.sqrt(dx*dx + dy*dy)
ux, uy = dx/length, dy/length
x1 = bx + ux * 42
y1 = by + uy * 20
x2 = cx - ux * 37
y2 = cy - uy * 37
d.add(Line(x1, y1, x2, y2, strokeColor=col, strokeWidth=1.5))
d.add(String(80, 148, "Isohydric Principle: All Buffer Systems Equilibrate Through [H⁺]", fontName="Helvetica-Bold", fontSize=9, fillColor=DARK_BLUE))
return d
def diagram_renal_respiratory():
"""Diagram showing renal and respiratory regulation of buffers."""
W, H = 460, 170
d = Drawing(W, H)
d.add(Rect(0, 0, W, H, fillColor=colors.HexColor("#fafafa"), strokeColor=None))
# Lungs box
d.add(Rect(10, 60, 130, 80, fillColor=colors.HexColor("#e0f2fe"), strokeColor=MID_BLUE, strokeWidth=1.5, rx=8))
d.add(Rect(10, 118, 130, 22, fillColor=MID_BLUE, strokeColor=None, rx=5))
d.add(String(30, 125, "LUNGS", fontName="Helvetica-Bold", fontSize=10, fillColor=WHITE))
d.add(String(14, 106, "Regulate PaCO₂", fontName="Helvetica-Bold", fontSize=8.5, fillColor=DARK_BLUE))
d.add(String(14, 93, "Response: Minutes", fontName="Helvetica", fontSize=8, fillColor=DARK_GREY))
d.add(String(14, 80, "↑Ventilation → ↓PaCO₂", fontName="Helvetica", fontSize=7.5, fillColor=DARK_GREY))
d.add(String(14, 68, "↓Ventilation → ↑PaCO₂", fontName="Helvetica", fontSize=7.5, fillColor=DARK_GREY))
# Central: H+/pH box
d.add(Rect(165, 65, 130, 70, fillColor=RED, strokeColor=None, rx=8))
d.add(String(185, 115, "ACID-BASE", fontName="Helvetica-Bold", fontSize=10, fillColor=WHITE))
d.add(String(185, 101, "BALANCE", fontName="Helvetica-Bold", fontSize=10, fillColor=WHITE))
d.add(String(178, 85, "pH 7.35 – 7.45", fontName="Helvetica-Bold", fontSize=9, fillColor=colors.HexColor("#fecaca")))
d.add(String(176, 72, "[H⁺] = 35–45 nEq/L", fontName="Helvetica", fontSize=8, fillColor=WHITE))
# Kidneys box
d.add(Rect(320, 60, 130, 80, fillColor=colors.HexColor("#ecfdf5"), strokeColor=TEAL, strokeWidth=1.5, rx=8))
d.add(Rect(320, 118, 130, 22, fillColor=TEAL, strokeColor=None, rx=5))
d.add(String(346, 125, "KIDNEYS", fontName="Helvetica-Bold", fontSize=10, fillColor=WHITE))
d.add(String(324, 106, "Regulate HCO₃⁻", fontName="Helvetica-Bold", fontSize=8.5, fillColor=TEAL))
d.add(String(324, 93, "Response: Hours–Days", fontName="Helvetica", fontSize=8, fillColor=DARK_GREY))
d.add(String(324, 80, "Acidosis → Retain HCO₃⁻", fontName="Helvetica", fontSize=7.5, fillColor=DARK_GREY))
d.add(String(324, 68, "Alkalosis → Excrete HCO₃⁻", fontName="Helvetica", fontSize=7.5, fillColor=DARK_GREY))
# Arrows lung -> centre
d.add(Line(140, 100, 163, 100, strokeColor=MID_BLUE, strokeWidth=1.5))
d.add(Polygon([163, 100, 155, 104, 155, 96], fillColor=MID_BLUE, strokeColor=None))
# Arrows kidney -> centre
d.add(Line(318, 100, 297, 100, strokeColor=TEAL, strokeWidth=1.5))
d.add(Polygon([297, 100, 305, 104, 305, 96], fillColor=TEAL, strokeColor=None))
# Chemical equation below
d.add(Rect(80, 10, 300, 44, fillColor=LIGHT_BLUE, strokeColor=MID_BLUE, strokeWidth=0.8, rx=5))
d.add(String(90, 37, "pH = 6.1 + log [HCO₃⁻] = 6.1 + log KIDNEY", fontName="Helvetica-Bold", fontSize=9, fillColor=DARK_BLUE))
d.add(Line(280, 33, 330, 33, strokeColor=DARK_BLUE, strokeWidth=1))
d.add(String(90, 20, " 0.03 × PaCO₂ LUNGS", fontName="Helvetica", fontSize=9, fillColor=DARK_GREY))
d.add(String(100, 155, "Physiological Regulation of pH by Lungs and Kidneys", fontName="Helvetica-Bold", fontSize=9, fillColor=DARK_BLUE))
return d
# ─── DOCUMENT BUILDER ────────────────────────────────────────────────────────
def add_header_footer(canvas_obj, doc):
"""Add page header and footer."""
canvas_obj.saveState()
w, h = doc.pagesize
# Footer
canvas_obj.setFillColor(DARK_BLUE)
canvas_obj.rect(MARGIN, 8*mm, w - 2*MARGIN, 0.4*mm, fill=1, stroke=0)
canvas_obj.setFillColor(MID_GREY)
canvas_obj.setFont("Helvetica", 7.5)
canvas_obj.drawString(MARGIN, 5*mm, "PG Anaesthesia Examination — Buffer Systems")
canvas_obj.drawRightString(w - MARGIN, 5*mm, f"Page {doc.page}")
# Header (except first page)
if doc.page > 1:
canvas_obj.setFillColor(DARK_BLUE)
canvas_obj.rect(MARGIN, h - 14*mm, w - 2*MARGIN, 0.4*mm, fill=1, stroke=0)
canvas_obj.setFillColor(MID_GREY)
canvas_obj.setFont("Helvetica-Oblique", 7.5)
canvas_obj.drawString(MARGIN, h - 12*mm, "Buffer Systems in Anaesthesia — 30 Marks")
canvas_obj.drawRightString(w - MARGIN, h - 12*mm, "Postgraduate Anaesthesia Examination")
canvas_obj.restoreState()
def build_pdf():
doc = SimpleDocTemplate(
OUTPUT,
pagesize=A4,
rightMargin=MARGIN, leftMargin=MARGIN,
topMargin=MARGIN + 5*mm, bottomMargin=MARGIN + 5*mm,
title="Buffer Systems — PG Anaesthesia 30-Mark Answer",
author="Orris Medical AI",
subject="Postgraduate Anaesthesia Examination — Buffer Systems"
)
story = []
W = PAGE_W - 2 * MARGIN
# ═══════════════════════════════════════════════════════════
# TITLE PAGE BANNER
# ═══════════════════════════════════════════════════════════
class TitleBanner(Flowable):
def wrap(self, aw, ah):
return aw, 110
def draw(self):
c = self.canv
aw = W
# Gradient-like background (stacked rectangles)
for i in range(12):
frac = i / 12
r = int(26 + frac * 10)
g = int(58 + frac * 20)
b = int(92 + frac * 20)
c.setFillColorRGB(r/255, g/255, b/255)
c.rect(0, i * (110/12), aw, 110/12 + 1, fill=1, stroke=0)
# Top accent bar
c.setFillColor(GOLD)
c.rect(0, 104, aw, 6, fill=1, stroke=0)
# Text
c.setFillColor(WHITE)
c.setFont("Helvetica-Bold", 20)
c.drawCentredString(aw/2, 74, "BUFFER SYSTEMS")
c.setFont("Helvetica", 12)
c.setFillColor(colors.HexColor("#bfdbfe"))
c.drawCentredString(aw/2, 54, "Postgraduate Anaesthesia Examination")
c.setFillColor(WHITE)
c.setFont("Helvetica-BoldOblique", 11)
c.drawCentredString(aw/2, 36, "Model Answer — 30 Marks")
c.setFont("Helvetica", 9)
c.setFillColor(colors.HexColor("#93c5fd"))
c.drawCentredString(aw/2, 18, "Sources: Morgan & Mikhail | Guyton & Hall | Ganong | Miller's Anesthesia | Costanzo Physiology")
story.append(TitleBanner())
story.append(sp(12))
# Marking scheme overview table
ms_data = [
[Paragraph("<b>Section</b>", table_header_style),
Paragraph("<b>Topic</b>", table_header_style),
Paragraph("<b>Marks</b>", table_header_style)],
[Paragraph("1", table_cell_style), Paragraph("Definition and Principles of Buffering", table_cell_style), Paragraph("3", table_cell_style)],
[Paragraph("2", table_cell_style), Paragraph("Bicarbonate Buffer System", table_cell_style), Paragraph("6", table_cell_style)],
[Paragraph("3", table_cell_style), Paragraph("Non-Bicarbonate Buffers (Hb, Phosphate, Protein)", table_cell_style), Paragraph("6", table_cell_style)],
[Paragraph("4", table_cell_style), Paragraph("Isohydric Principle", table_cell_style), Paragraph("3", table_cell_style)],
[Paragraph("5", table_cell_style), Paragraph("Physiological Regulation (Respiratory & Renal)", table_cell_style), Paragraph("6", table_cell_style)],
[Paragraph("6", table_cell_style), Paragraph("Buffer Base, Standard Bicarbonate & Base Excess", table_cell_style), Paragraph("3", table_cell_style)],
[Paragraph("7", table_cell_style), Paragraph("Anaesthetic Relevance & Clinical Applications", table_cell_style), Paragraph("3", table_cell_style)],
[Paragraph("<b>TOTAL</b>", table_header_style), Paragraph("", table_cell_style), Paragraph("<b>30</b>", table_header_style)],
]
ms_table = Table(ms_data, colWidths=[1.5*cm, 12*cm, 2.5*cm])
ms_table.setStyle(TableStyle([
("BACKGROUND", (0,0), (-1,0), DARK_BLUE),
("BACKGROUND", (0,-1), (-1,-1), DARK_BLUE),
("BACKGROUND", (0,1), (-1,1), LIGHT_BLUE),
("BACKGROUND", (0,2), (-1,2), WHITE),
("BACKGROUND", (0,3), (-1,3), LIGHT_BLUE),
("BACKGROUND", (0,4), (-1,4), WHITE),
("BACKGROUND", (0,5), (-1,5), LIGHT_BLUE),
("BACKGROUND", (0,6), (-1,6), WHITE),
("BACKGROUND", (0,7), (-1,7), LIGHT_BLUE),
("ROWBACKGROUNDS", (0,0), (-1,-1), [LIGHT_BLUE, WHITE]),
("GRID", (0,0), (-1,-1), 0.4, MID_GREY),
("ALIGN", (2,0), (2,-1), "CENTER"),
("VALIGN", (0,0), (-1,-1), "MIDDLE"),
("TOPPADDING", (0,0), (-1,-1), 5),
("BOTTOMPADDING", (0,0), (-1,-1), 5),
("LEFTPADDING", (0,0), (-1,-1), 8),
]))
story.append(ms_table)
story.append(sp(16))
# ═══════════════════════════════════════════════════════════
# SECTION 1: DEFINITION AND PRINCIPLES
# ═══════════════════════════════════════════════════════════
story.append(SectionHeader("SECTION 1 Definition and Principles of Buffering", sub="[3 Marks]", bg=DARK_BLUE))
story.append(sp(6))
story.append(Paragraph("<b>Definition of a Buffer</b>", h2_style))
story.append(Paragraph(
"A buffer is a solution containing a weak acid and its conjugate base (or a weak base and its conjugate acid) "
"that resists significant changes in [H⁺] when small amounts of acid or alkali are added to it. "
"The body maintains arterial pH within the narrow range of 7.35–7.45 (normal 7.40) "
"despite continuous endogenous acid production of approximately 15,000 mmol of CO₂ and 80 mEq of fixed acids per day.",
body_style))
story.append(Paragraph("<b>Henderson-Hasselbalch Equation (General Form)</b>", h2_style))
story.append(Paragraph("pH = pKa + log [A⁻] / [HA]", equation_style))
story.append(Paragraph("<b>Properties of an Ideal Buffer</b>", h2_style))
items1 = [
"pKa close to the pH being buffered (maximum efficiency when pKa = pH ± 1 unit)",
"Present in high concentration in the compartment being buffered",
"Ability to be regenerated or eliminated by physiological processes (open system)",
"Non-toxic and compatible with normal cellular function",
]
for item in items1:
story.append(bullet(item))
story.append(sp(6))
story.append(Paragraph("<b>Diagram 1: Buffer Concept — Weak Acid / Conjugate Base Equilibrium</b>", caption_style))
story.append(diagram_buffer_definition())
story.append(Paragraph("Figure 1. A buffer resists pH change by accepting excess H⁺ (acting as base) or releasing H⁺ (acting as acid).", caption_style))
story.append(sp(8))
story.append(Paragraph("<b>Buffering Capacity (Van Slyke)</b>", h2_style))
story.append(Paragraph(
"Buffering capacity (β) is defined as the amount of strong acid or base (in mEq) required to change pH by "
"one unit in 1 litre of solution. It is maximal when pH = pKa and when buffer concentration is high.",
body_style))
story.append(Paragraph("β = ΔB / ΔpH", equation_style))
story.append(sp(10))
# ═══════════════════════════════════════════════════════════
# SECTION 2: BICARBONATE BUFFER SYSTEM
# ═══════════════════════════════════════════════════════════
story.append(SectionHeader("SECTION 2 Bicarbonate Buffer System", sub="[6 Marks]", bg=MID_BLUE))
story.append(sp(6))
story.append(Paragraph(
"The bicarbonate buffer system is the most important extracellular buffer. Although its pKa of 6.1 "
"is well below the normal blood pH of 7.40 (making it theoretically inefficient), it is highly "
"effective in vivo because it functions as an <b>open system</b>: PaCO₂ is regulated by the lungs "
"and [HCO₃⁻] is regulated by the kidneys.",
body_style))
story.append(Paragraph("<b>Diagram 2: Bicarbonate Equilibrium Chain</b>", caption_style))
story.append(diagram_bicarbonate_system())
story.append(Paragraph("Figure 2. CO₂ + H₂O ⇌ H₂CO₃ ⇌ H⁺ + HCO₃⁻ (catalysed by carbonic anhydrase).", caption_style))
story.append(sp(6))
story.append(Paragraph("<b>Henderson-Hasselbalch Equation for Bicarbonate</b>", h2_style))
story.append(Paragraph("pH = 6.1 + log [HCO₃⁻] / (0.03 × PaCO₂)", equation_style))
story.append(Paragraph("Clinical form: [H⁺] (nEq/L) = 24 × PaCO₂ / [HCO₃⁻]", equation_style))
story.append(Paragraph("<b>Diagram 3: Henderson-Hasselbalch Equation (Visual)</b>", caption_style))
story.append(diagram_henderson_hasselbalch())
story.append(Paragraph("Figure 3. Normal values: [HCO₃⁻] = 24 mEq/L, PaCO₂ = 40 mmHg → pH = 7.40.", caption_style))
story.append(sp(6))
story.append(Paragraph("<b>Normal Values and pH–[H⁺] Relationship</b>", h2_style))
ph_h_data = [
[Paragraph("<b>pH</b>", table_header_style),
Paragraph("<b>[H⁺] nEq/L</b>", table_header_style),
Paragraph("<b>Clinical State</b>", table_header_style)],
[Paragraph("< 7.35", table_cell_style), Paragraph("> 45", table_cell_style), Paragraph("Acidaemia", table_cell_style)],
[Paragraph("7.35–7.45", table_cell_style), Paragraph("35–45", table_cell_style), Paragraph("Normal", table_cell_style)],
[Paragraph("7.40", table_cell_style), Paragraph("40", table_cell_style), Paragraph("Normal (exact)", table_cell_style)],
[Paragraph("> 7.45", table_cell_style), Paragraph("< 35", table_cell_style), Paragraph("Alkalaemia", table_cell_style)],
]
ph_table = Table(ph_h_data, colWidths=[4*cm, 5*cm, 7*cm])
ph_table.setStyle(TableStyle([
("BACKGROUND", (0,0), (-1,0), DARK_BLUE),
("ROWBACKGROUNDS", (0,1), (-1,-1), [LIGHT_BLUE, WHITE]),
("GRID", (0,0), (-1,-1), 0.4, MID_GREY),
("ALIGN", (0,0), (-1,-1), "CENTER"),
("VALIGN", (0,0), (-1,-1), "MIDDLE"),
("TOPPADDING", (0,0), (-1,-1), 5),
("BOTTOMPADDING", (0,0), (-1,-1), 5),
]))
story.append(ph_table)
story.append(sp(6))
story.append(Paragraph("<b>Action of Bicarbonate Buffer Against Acid and Base Loads</b>", h2_style))
story.append(Paragraph(
"<b>Acid load</b> (e.g. HCl added): HCl + NaHCO₃ → NaCl + H₂O + CO₂ "
"The strong acid HCl is converted to the weak acid H₂CO₃, which dissociates to CO₂ and H₂O. "
"Excess CO₂ is expelled by the lungs — minimal pH change.",
body_style))
story.append(Paragraph(
"<b>Alkali load</b> (e.g. NaOH added): NaOH + H₂CO₃ → NaHCO₃ + H₂O "
"The strong base is replaced by the weak base NaHCO₃ — minimal pH change.",
body_style))
story.append(Paragraph(
"<b>Key limitation</b>: The bicarbonate buffer is effective against metabolic (non-volatile) acid-base disturbances "
"but is NOT effective against respiratory (volatile acid/CO₂) disturbances, because a rise in PaCO₂ "
"does not appreciably change [HCO₃⁻].",
note_style))
story.append(sp(10))
# ═══════════════════════════════════════════════════════════
# SECTION 3: NON-BICARBONATE BUFFERS
# ═══════════════════════════════════════════════════════════
story.append(SectionHeader("SECTION 3 Non-Bicarbonate Buffers", sub="Haemoglobin, Phosphate, Plasma Proteins [6 Marks]", bg=TEAL))
story.append(sp(6))
story.append(Paragraph("<b>Diagram 4: Buffer Distribution Across Body Fluid Compartments</b>", caption_style))
story.append(diagram_buffer_compartments())
story.append(Paragraph("Figure 4. Approximate percentage contributions of buffers in blood, interstitial fluid and intracellular fluid.", caption_style))
story.append(sp(8))
# Haemoglobin
story.append(Paragraph("3A. Haemoglobin Buffer", h2_style))
story.append(Paragraph(
"Haemoglobin (Hb) is the most important non-bicarbonate (non-carbonic) intravascular buffer and accounts "
"for approximately 35% of total blood buffering capacity. It exists in red blood cells as a weak acid (HHb) "
"and its potassium salt (KHb).",
body_style))
hb_items = [
"Rich in <b>histidine residues</b> (38 per molecule) — pKa of imidazole group ≈ 6.8, effective over pH 5.7–7.7",
"Buffers BOTH carbonic (CO₂) and non-carbonic (fixed) acids — unlike bicarbonate buffer",
"<b>Deoxyhemoglobin (Hb)</b> is a weaker acid than oxyhaemoglobin (HbO₂) → better buffer",
"The Haldane effect: deoxygenation of Hb in tissues releases O₂ and takes up H⁺, facilitating CO₂ transport",
"Reaction: H⁺ + KHb ⇌ HHb + K⁺ and H₂CO₃ + KHb ⇌ HHb + HCO₃⁻",
"Buffering capacity 6× greater than plasma proteins on a molar basis",
]
for item in hb_items:
story.append(bullet(item))
story.append(sp(4))
# Phosphate
story.append(Paragraph("3B. Phosphate Buffer System", h2_style))
story.append(Paragraph(
"The phosphate buffer pair consists of dihydrogen phosphate (H₂PO₄⁻, weak acid) and "
"monohydrogen phosphate (HPO₄²⁻, conjugate base). Its pKa is 6.8 — close to physiological pH "
"making it an efficient buffer, but its plasma concentration is low (~1 mmol/L), limiting its role in blood.",
body_style))
phos_items = [
"Minor role in plasma (only ~5% of blood buffering); major role intracellularly and in renal tubular fluid",
"Intracellular: high phosphate concentration and lower intracellular pH (≈6.9) brings operating pH close to pKa",
"Renal tubule: phosphate is concentrated in tubular fluid; acts as titratable acid for H⁺ excretion",
"Reactions: HCl + Na₂HPO₄ → NaH₂PO₄ + NaCl (acid buffered); NaOH + NaH₂PO₄ → Na₂HPO₄ + H₂O (base buffered)",
]
for item in phos_items:
story.append(bullet(item))
story.append(sp(4))
# Plasma Proteins
story.append(Paragraph("3C. Plasma Protein Buffers", h2_style))
story.append(Paragraph(
"Plasma proteins (principally albumin) contribute approximately 7% of blood buffering capacity. "
"They act as buffers via their ionisable amino acid residues, particularly histidine imidazole groups, "
"lysine, arginine and free carboxyl/amino terminal groups.",
body_style))
prot_items = [
"Albumin (pKa ≈ 7.0): most important plasma protein buffer",
"Buffer action slower than bicarbonate; maximal intracellular buffering takes 2–4 hours",
"Bone acts as a large reservoir — carbonate and phosphate in bone crystal exchange H⁺; accounts for up to 40–60% of buffering in chronic acidosis",
]
for item in prot_items:
story.append(bullet(item))
story.append(sp(4))
# Buffer comparison table
story.append(Paragraph("<b>Comparative Summary of Buffer Systems</b>", h2_style))
comp_data = [
[Paragraph("<b>Buffer System</b>", table_header_style),
Paragraph("<b>pKa</b>", table_header_style),
Paragraph("<b>Location</b>", table_header_style),
Paragraph("<b>% Blood</b>", table_header_style),
Paragraph("<b>Buffers CO₂?</b>", table_header_style)],
[Paragraph("Bicarbonate/CO₂", table_cell_style), Paragraph("6.1", table_cell_style),
Paragraph("ECF (mainly)", table_cell_style), Paragraph("53%", table_cell_style),
Paragraph("No (open system)", table_cell_style)],
[Paragraph("Haemoglobin", table_cell_style), Paragraph("6.8", table_cell_style),
Paragraph("RBCs", table_cell_style), Paragraph("35%", table_cell_style),
Paragraph("Yes", table_cell_style)],
[Paragraph("Plasma Proteins", table_cell_style), Paragraph("~7.0", table_cell_style),
Paragraph("Plasma", table_cell_style), Paragraph("7%", table_cell_style),
Paragraph("Partially", table_cell_style)],
[Paragraph("Phosphate", table_cell_style), Paragraph("6.8", table_cell_style),
Paragraph("ICF, Renal tubule", table_cell_style), Paragraph("5%", table_cell_style),
Paragraph("No", table_cell_style)],
[Paragraph("Bone Carbonate", table_cell_style), Paragraph("—", table_cell_style),
Paragraph("Bone", table_cell_style), Paragraph("Chronic only", table_cell_style),
Paragraph("No", table_cell_style)],
]
comp_table = Table(comp_data, colWidths=[3.8*cm, 1.8*cm, 3.8*cm, 2.2*cm, 4.4*cm])
comp_table.setStyle(TableStyle([
("BACKGROUND", (0,0), (-1,0), DARK_BLUE),
("ROWBACKGROUNDS", (0,1), (-1,-1), [LIGHT_TEAL, WHITE]),
("GRID", (0,0), (-1,-1), 0.4, MID_GREY),
("ALIGN", (1,0), (1,-1), "CENTER"),
("ALIGN", (3,0), (3,-1), "CENTER"),
("ALIGN", (4,0), (4,-1), "CENTER"),
("VALIGN", (0,0), (-1,-1), "MIDDLE"),
("TOPPADDING", (0,0), (-1,-1), 5),
("BOTTOMPADDING", (0,0), (-1,-1), 5),
("LEFTPADDING", (0,0), (-1,-1), 6),
]))
story.append(comp_table)
story.append(sp(10))
# ═══════════════════════════════════════════════════════════
# SECTION 4: ISOHYDRIC PRINCIPLE
# ═══════════════════════════════════════════════════════════
story.append(SectionHeader("SECTION 4 Isohydric Principle", sub="[3 Marks]", bg=colors.HexColor("#7c3aed")))
story.append(sp(6))
story.append(Paragraph(
"The isohydric principle (Van Slyke) states that all buffer systems in a common solution "
"are in simultaneous equilibrium with the same H⁺ concentration. Because [H⁺] is common "
"to all buffer reactions, a change in the balance of any one buffer system changes the balance "
"of all other buffer systems simultaneously.",
body_style))
story.append(Paragraph("[H⁺] = K₁ × [HA₁]/[A₁⁻] = K₂ × [HA₂]/[A₂⁻] = K₃ × [HA₃]/[A₃⁻]", equation_style))
story.append(Paragraph("<b>Diagram 5: Isohydric Principle</b>", caption_style))
story.append(diagram_isohydric_principle())
story.append(Paragraph("Figure 5. All buffer systems equilibrate through the common [H⁺] ion — measuring any one system reflects all others.", caption_style))
story.append(sp(6))
story.append(Paragraph(
"<b>Clinical implication</b>: Because of this principle, measurement of just one buffer pair "
"(the bicarbonate system via pH, PaCO₂ and [HCO₃⁻]) provides information about the status "
"of all buffer systems in the body. This is why arterial blood gas analysis is so clinically useful.",
note_style))
story.append(sp(10))
# ═══════════════════════════════════════════════════════════
# SECTION 5: PHYSIOLOGICAL REGULATION
# ═══════════════════════════════════════════════════════════
story.append(SectionHeader("SECTION 5 Physiological Regulation of Acid-Base Balance", sub="Respiratory & Renal Mechanisms [6 Marks]", bg=colors.HexColor("#0f766e")))
story.append(sp(6))
story.append(Paragraph(
"Buffer systems are the first line of defence against pH change (immediate, seconds). "
"Physiological regulation provides ongoing correction through respiratory and renal compensation.",
body_style))
story.append(Paragraph("<b>Diagram 6: Three Lines of Defence Against pH Change</b>", caption_style))
# Three lines of defence table-diagram
tld_data = [
[Paragraph("<b>Line of Defence</b>", table_header_style),
Paragraph("<b>Mechanism</b>", table_header_style),
Paragraph("<b>Speed</b>", table_header_style),
Paragraph("<b>Effectiveness</b>", table_header_style)],
[Paragraph("1st — Chemical Buffers", table_cell_style),
Paragraph("Immediate H⁺ binding by buffer pairs", table_cell_style),
Paragraph("Seconds", table_cell_style),
Paragraph("Partial — reduces but does not eliminate disturbance", table_cell_style)],
[Paragraph("2nd — Respiratory", table_cell_style),
Paragraph("Adjust PaCO₂ via alveolar ventilation", table_cell_style),
Paragraph("Minutes (1–15 min)", table_cell_style),
Paragraph("75% correction; cannot fully normalise pH", table_cell_style)],
[Paragraph("3rd — Renal", table_cell_style),
Paragraph("Adjust HCO₃⁻ excretion/retention, H⁺ excretion", table_cell_style),
Paragraph("Hours to days", table_cell_style),
Paragraph("Near-complete normalisation of pH", table_cell_style)],
]
tld_table = Table(tld_data, colWidths=[3.5*cm, 5.5*cm, 3*cm, 4*cm])
tld_table.setStyle(TableStyle([
("BACKGROUND", (0,0), (-1,0), DARK_BLUE),
("ROWBACKGROUNDS", (0,1), (-1,-1), [LIGHT_BLUE, LIGHT_TEAL, LIGHT_GOLD]),
("GRID", (0,0), (-1,-1), 0.4, MID_GREY),
("VALIGN", (0,0), (-1,-1), "MIDDLE"),
("TOPPADDING", (0,0), (-1,-1), 6),
("BOTTOMPADDING", (0,0), (-1,-1), 6),
("LEFTPADDING", (0,0), (-1,-1), 6),
]))
story.append(tld_table)
story.append(sp(8))
story.append(Paragraph("<b>Diagram 7: Pulmonary and Renal Regulation of pH</b>", caption_style))
story.append(diagram_renal_respiratory())
story.append(Paragraph("Figure 7. Lungs regulate PaCO₂ (numerator), kidneys regulate [HCO₃⁻] (denominator) — together they control pH.", caption_style))
story.append(sp(6))
story.append(Paragraph("5A. Respiratory Regulation", h2_style))
resp_items = [
"Peripheral chemoreceptors (carotid and aortic bodies): respond to ↓pH, ↑PaCO₂, ↓PaO₂",
"Central chemoreceptors (medullary): respond primarily to ↑PCO₂ / ↓pH of CSF",
"Acidosis → ↑ventilation → ↓PaCO₂ → ↑pH (respiratory compensation for metabolic acidosis)",
"Alkalosis → ↓ventilation → ↑PaCO₂ → ↓pH (respiratory compensation for metabolic alkalosis)",
"Respiratory response is limited: cannot fully normalise pH (respiratory compensation is never complete)",
"CO₂/H₂CO₃ buffer is unique — the only buffer where one component (CO₂) is directly regulated",
]
for item in resp_items:
story.append(bullet(item))
story.append(sp(4))
story.append(Paragraph("5B. Renal Regulation", h2_style))
renal_items = [
"Kidneys regulate [HCO₃⁻] by: (i) reabsorption of filtered HCO₃⁻ (mainly proximal tubule, carbonic anhydrase-dependent)",
" (ii) New HCO₃⁻ generation via H⁺ excretion as NH₄⁺ (ammonium) and titratable acid (H₂PO₄⁻)",
"Acidosis → ↑H⁺ secretion, ↑NH₄⁺ excretion, ↑HCO₃⁻ reabsorption → pH correction",
"Alkalosis → ↓H⁺ secretion, ↑HCO₃⁻ excretion → pH correction",
"Renal compensation takes 2–5 days to complete but can near-fully correct pH",
"Carbonic anhydrase inhibitors (e.g. acetazolamide) impair renal HCO₃⁻ handling",
]
for item in renal_items:
story.append(bullet(item))
story.append(sp(6))
# Expected compensatory responses table
story.append(Paragraph("<b>Expected Compensatory Responses (for examination)</b>", h2_style))
comp_resp_data = [
[Paragraph("<b>Disorder</b>", table_header_style),
Paragraph("<b>Primary Change</b>", table_header_style),
Paragraph("<b>Compensation</b>", table_header_style),
Paragraph("<b>Expected Formula</b>", table_header_style)],
[Paragraph("Metabolic Acidosis", table_cell_style), Paragraph("↓ HCO₃⁻", table_cell_style),
Paragraph("↓ PaCO₂", table_cell_style), Paragraph("PaCO₂ = 1.5 × [HCO₃⁻] + 8 ± 2 (Winter's)", table_cell_style)],
[Paragraph("Metabolic Alkalosis", table_cell_style), Paragraph("↑ HCO₃⁻", table_cell_style),
Paragraph("↑ PaCO₂", table_cell_style), Paragraph("PaCO₂ = 0.7 × [HCO₃⁻] + 21 ± 2", table_cell_style)],
[Paragraph("Respiratory Acidosis\n(acute)", table_cell_style), Paragraph("↑ PaCO₂", table_cell_style),
Paragraph("↑ HCO₃⁻", table_cell_style), Paragraph("HCO₃⁻ ↑ 1 mEq/L per 10 mmHg ↑PaCO₂", table_cell_style)],
[Paragraph("Respiratory Acidosis\n(chronic)", table_cell_style), Paragraph("↑ PaCO₂", table_cell_style),
Paragraph("↑ HCO₃⁻", table_cell_style), Paragraph("HCO₃⁻ ↑ 3.5 mEq/L per 10 mmHg ↑PaCO₂", table_cell_style)],
[Paragraph("Respiratory Alkalosis\n(acute)", table_cell_style), Paragraph("↓ PaCO₂", table_cell_style),
Paragraph("↓ HCO₃⁻", table_cell_style), Paragraph("HCO₃⁻ ↓ 2 mEq/L per 10 mmHg ↓PaCO₂", table_cell_style)],
[Paragraph("Respiratory Alkalosis\n(chronic)", table_cell_style), Paragraph("↓ PaCO₂", table_cell_style),
Paragraph("↓ HCO₃⁻", table_cell_style), Paragraph("HCO₃⁻ ↓ 5 mEq/L per 10 mmHg ↓PaCO₂", table_cell_style)],
]
comp_resp_table = Table(comp_resp_data, colWidths=[3.5*cm, 3*cm, 3*cm, 6.5*cm])
comp_resp_table.setStyle(TableStyle([
("BACKGROUND", (0,0), (-1,0), DARK_BLUE),
("ROWBACKGROUNDS", (0,1), (-1,-1), [LIGHT_BLUE, WHITE]),
("GRID", (0,0), (-1,-1), 0.4, MID_GREY),
("VALIGN", (0,0), (-1,-1), "MIDDLE"),
("TOPPADDING", (0,0), (-1,-1), 5),
("BOTTOMPADDING", (0,0), (-1,-1), 5),
("LEFTPADDING", (0,0), (-1,-1), 6),
]))
story.append(comp_resp_table)
story.append(sp(10))
# ═══════════════════════════════════════════════════════════
# SECTION 6: BUFFER BASE, STANDARD BICARBONATE, BASE EXCESS
# ═══════════════════════════════════════════════════════════
story.append(SectionHeader("SECTION 6 Buffer Base, Standard Bicarbonate & Base Excess", sub="[3 Marks]", bg=GOLD))
story.append(sp(6))
story.append(Paragraph("<b>Buffer Base (BB)</b>", h2_style))
story.append(Paragraph(
"Buffer base is the sum of all buffer anions in whole blood (HCO₃⁻, Hb, plasma proteins, "
"phosphate). Normal value is 48 mEq/L in whole blood. It represents total buffering capacity "
"and is unaffected by changes in PaCO₂ — it changes only with metabolic disturbances.",
body_style))
story.append(Paragraph("BB = [HCO₃⁻] + [Hb-buffer] + [plasma proteins] + [phosphate] ≈ 48 mEq/L", equation_style))
story.append(Paragraph("<b>Standard Bicarbonate</b>", h2_style))
story.append(Paragraph(
"Standard bicarbonate is the plasma [HCO₃⁻] measured at a standardised PaCO₂ of 40 mmHg, "
"temperature 37°C, and full haemoglobin saturation. It eliminates the respiratory component "
"and reflects only the metabolic component of acid-base status. Normal = 22–26 mEq/L.",
body_style))
story.append(Paragraph("<b>Base Excess (BE)</b>", h2_style))
story.append(Paragraph(
"Base excess (Astrup/Siggaard-Andersen) is the amount of strong acid or base (mEq/L) required "
"to restore pH to 7.40 at PaCO₂ 40 mmHg and 37°C. It is independent of respiratory changes "
"and thus reflects the metabolic component of acid-base disturbance.",
body_style))
be_data = [
[Paragraph("<b>Parameter</b>", table_header_style),
Paragraph("<b>Normal Range</b>", table_header_style),
Paragraph("<b>Significance</b>", table_header_style)],
[Paragraph("Base Excess (BE)", table_cell_style), Paragraph("−2 to +2 mEq/L", table_cell_style),
Paragraph("Positive = metabolic alkalosis; Negative = metabolic acidosis", table_cell_style)],
[Paragraph("Std. Bicarbonate", table_cell_style), Paragraph("22–26 mEq/L", table_cell_style),
Paragraph("Reflects metabolic component only", table_cell_style)],
[Paragraph("Actual HCO₃⁻", table_cell_style), Paragraph("22–26 mEq/L", table_cell_style),
Paragraph("Affected by both metabolic and respiratory changes", table_cell_style)],
[Paragraph("Buffer Base", table_cell_style), Paragraph("48 mEq/L (whole blood)", table_cell_style),
Paragraph("Sum of all buffer anions; metabolic disturbances only", table_cell_style)],
]
be_table = Table(be_data, colWidths=[4*cm, 4*cm, 8*cm])
be_table.setStyle(TableStyle([
("BACKGROUND", (0,0), (-1,0), DARK_BLUE),
("ROWBACKGROUNDS", (0,1), (-1,-1), [LIGHT_GOLD, WHITE]),
("GRID", (0,0), (-1,-1), 0.4, MID_GREY),
("VALIGN", (0,0), (-1,-1), "MIDDLE"),
("TOPPADDING", (0,0), (-1,-1), 5),
("BOTTOMPADDING", (0,0), (-1,-1), 5),
("LEFTPADDING", (0,0), (-1,-1), 6),
]))
story.append(be_table)
story.append(sp(10))
# ═══════════════════════════════════════════════════════════
# SECTION 7: ANAESTHETIC RELEVANCE
# ═══════════════════════════════════════════════════════════
story.append(SectionHeader("SECTION 7 Anaesthetic Relevance & Clinical Applications", sub="[3 Marks]", bg=colors.HexColor("#be185d")))
story.append(sp(6))
story.append(Paragraph("<b>Intraoperative Acid-Base Changes</b>", h2_style))
anaes_items = [
"<b>Hypoventilation</b> (e.g. opioids, airway obstruction): ↑PaCO₂ → respiratory acidosis; Hb/protein buffers provide initial defence",
"<b>Hyperventilation</b> (e.g. controlled ventilation, anxiety): ↓PaCO₂ → respiratory alkalosis; HCO₃⁻ falls slightly, Ca²⁺ ionisation ↓ → tetany",
"<b>Metabolic acidosis in theatre</b>: prolonged surgery, massive transfusion, hypoperfusion, lactic acidosis — bicarbonate buffer most stressed",
"<b>Massive transfusion</b>: citrate → alkalosis then metabolic acidosis; stored blood contains lactic acid",
"<b>Sodium bicarbonate use</b>: indicated in severe metabolic acidosis (pH < 7.1), cardiac arrest with documented acidosis, TCA overdose, hyperkalaemia; must maintain adequate ventilation (CO₂ produced must be expelled)",
"<b>THAM (tromethamine)</b>: alternative buffer that does NOT generate CO₂; useful when ventilation impaired; renally excreted",
"<b>Carbonic anhydrase inhibitors</b> (acetazolamide): used in altitude sickness — inhibit renal HCO₃⁻ reabsorption producing metabolic acidosis → compensatory hyperventilation → ↑PaO₂",
"<b>Alpha-stat vs. pH-stat</b>: during hypothermic bypass — alpha-stat maintains protein buffer function by allowing pH to rise slightly with ↓temperature; pH-stat corrects pH to 7.40 at measured temperature",
]
for item in anaes_items:
story.append(bullet(item))
story.append(sp(6))
story.append(Paragraph("<b>Timing of Buffer Responses — Clinical Summary</b>", h2_style))
timing_data = [
[Paragraph("<b>Buffer Response</b>", table_header_style),
Paragraph("<b>Onset</b>", table_header_style),
Paragraph("<b>Example</b>", table_header_style)],
[Paragraph("Plasma bicarbonate & proteins", table_cell_style), Paragraph("Immediate (seconds)", table_cell_style), Paragraph("Sudden HCl infusion", table_cell_style)],
[Paragraph("Interstitial bicarbonate", table_cell_style), Paragraph("15–20 minutes", table_cell_style), Paragraph("Metabolic acidosis spreading", table_cell_style)],
[Paragraph("Respiratory compensation", table_cell_style), Paragraph("1–15 minutes", table_cell_style), Paragraph("Hyperventilation in DKA", table_cell_style)],
[Paragraph("Intracellular proteins & Hb", table_cell_style), Paragraph("2–4 hours", table_cell_style), Paragraph("Prolonged acidosis", table_cell_style)],
[Paragraph("Bone buffering", table_cell_style), Paragraph("Hours–days", table_cell_style), Paragraph("Chronic renal acidosis", table_cell_style)],
[Paragraph("Renal compensation", table_cell_style), Paragraph("Hours–days (full: 2–5 d)", table_cell_style), Paragraph("COPD (chronic resp. acidosis)", table_cell_style)],
]
timing_table = Table(timing_data, colWidths=[5*cm, 4*cm, 7*cm])
timing_table.setStyle(TableStyle([
("BACKGROUND", (0,0), (-1,0), colors.HexColor("#be185d")),
("ROWBACKGROUNDS", (0,1), (-1,-1), [LIGHT_RED, WHITE]),
("GRID", (0,0), (-1,-1), 0.4, MID_GREY),
("VALIGN", (0,0), (-1,-1), "MIDDLE"),
("TOPPADDING", (0,0), (-1,-1), 5),
("BOTTOMPADDING", (0,0), (-1,-1), 5),
("LEFTPADDING", (0,0), (-1,-1), 6),
]))
story.append(timing_table)
story.append(sp(10))
# ═══════════════════════════════════════════════════════════
# BUFFERING CAPACITY DIAGRAM
# ═══════════════════════════════════════════════════════════
story.append(SectionHeader("Supplementary Diagram Buffering Capacity and Titration Curve", bg=DARK_GREY))
story.append(sp(6))
story.append(diagram_buffering_capacity())
story.append(Paragraph(
"Figure 8. Buffer titration curve showing that maximum buffering capacity (flattest slope) occurs at pH = pKa. "
"The red dashed line shows normal blood pH (7.40). The blue shaded zone represents the effective buffering range (pKa ± 1).",
caption_style))
story.append(sp(6))
story.append(Paragraph(
"<b>Significance for Bicarbonate Buffer</b>: Although pKa = 6.1 means blood pH (7.40) lies outside the optimal buffering zone "
"of the bicarbonate system (5.1–7.1), the system remains highly effective because it is an <i>open system</i> — "
"pulmonary and renal regulation continuously shift the equilibrium, effectively extending the buffering range.",
note_style))
story.append(sp(10))
# ═══════════════════════════════════════════════════════════
# KEY POINTS SUMMARY BOX
# ═══════════════════════════════════════════════════════════
story.append(hline(DARK_BLUE, 1))
story.append(sp(4))
story.append(Paragraph("KEY EXAMINATION POINTS — Buffer Systems", h2_style))
story.append(sp(4))
key_points = [
"A buffer minimises pH change on addition of acid or alkali. Efficacy is maximal when pH = pKa.",
"The bicarbonate buffer (pKa 6.1) is the dominant ECF buffer. Its effectiveness depends on lung (CO₂) and kidney (HCO₃⁻) regulation — the open-system advantage.",
"Henderson-Hasselbalch: pH = 6.1 + log [HCO₃⁻] / (0.03 × PaCO₂). Clinical form: [H⁺] = 24 × PaCO₂ / [HCO₃⁻].",
"Haemoglobin is the most important non-bicarbonate buffer in blood (35%); it buffers both CO₂ and fixed acids. Deoxyhaemoglobin is a better buffer than oxyhaemoglobin.",
"Phosphate buffer (pKa 6.8): minor plasma role but major in ICF and renal tubular fluid.",
"Isohydric principle: all buffers are in equilibrium via [H⁺]; measuring the bicarbonate system reflects all others.",
"Three lines of defence: chemical buffers (seconds) → respiratory (minutes) → renal (hours to days).",
"Base excess (normal ±2 mEq/L) and standard bicarbonate (22–26 mEq/L) reflect metabolic component independent of PaCO₂.",
"Bicarbonate buffer is ineffective against respiratory acid-base disturbances (volatile acid). Haemoglobin buffers both.",
"Alpha-stat management during CPB preserves protein buffer function; pH-stat maintains normal pH at measured temperature.",
]
for i, pt in enumerate(key_points, 1):
story.append(Paragraph(f"<b>{i}.</b> {pt}", body_style))
story.append(sp(6))
# References
story.append(hline(MID_GREY))
story.append(Paragraph("<b>References</b>", h3_style))
refs = [
"Morgan & Mikhail's Clinical Anesthesiology, 7e — Chapter 50: Acid-Base Management",
"Guyton & Hall Textbook of Medical Physiology, 14e — Chapter 31: Acid-Base Regulation",
"Ganong's Review of Medical Physiology, 26e — Chapter 35: Regulation of Extracellular Fluid Composition",
"Miller's Anesthesia, 10e — Pediatric Resuscitation (Buffer Solutions section)",
"Costanzo Physiology, 7e — Chapter 7: Acid-Base Physiology",
]
for ref in refs:
story.append(Paragraph(f"• {ref}", bullet_style))
# Build
doc.build(story, onFirstPage=add_header_footer, onLaterPages=add_header_footer)
print(f"PDF generated: {OUTPUT}")
if __name__ == "__main__":
build_pdf()
cd /tmp/workspace/buffer-systems-exam && python3 generate_pdf.py 2>&1
~/buffer-systems-exam/generate_pdf.py
Successfully replaced 1 instance(s) of the string in '/tmp/workspace/buffer-systems-exam/generate_pdf.py'
cd /tmp/workspace/buffer-systems-exam && python3 generate_pdf.py 2>&1
ls -lh /tmp/workspace/buffer-systems-exam/Buffer_Systems_PG_Anaesthesia.pdf
Buffer Systems PG Anaesthesia
PDF Document · PDF
What's Inside (30 Marks, 7 Sections)
| Section | Topic | Marks |
|---|---|---|
| 1 | Definition, Buffer Principles, Van Slyke Buffering Capacity | 3 |
| 2 | Bicarbonate Buffer System, Henderson-Hasselbalch, Open System | 6 |
| 3 | Non-Bicarbonate Buffers — Haemoglobin, Phosphate, Plasma Proteins | 6 |
| 4 | Isohydric Principle | 3 |
| 5 | Physiological Regulation — Respiratory & Renal with Compensation Formulae | 6 |
| 6 | Buffer Base, Standard Bicarbonate, Base Excess | 3 |
| 7 | Anaesthetic Relevance — NaHCO₃, THAM, Alpha-stat vs pH-stat | 3 |
- Buffer concept (weak acid ⇌ conjugate base)
- Bicarbonate equilibrium chain (CO₂ → H₂CO₃ → H⁺ + HCO₃⁻)
- Henderson-Hasselbalch equation visual with normal values
- Buffer distribution across ECF/ICF/Blood compartments
- Buffer titration curve with pKa and buffering zone
- Isohydric principle (all buffers linked via [H⁺])
- Pulmonary and renal regulation of pH
- Three lines of defence comparison table