

98aff4dc-95e5-4038-aa8b-ade000175067.jpeg
discussion about the chat in viva
Reading File
This image shows the visual pathway diagram - a classic anatomy/neurology topic. Let me search the medical library for detailed content while also analysing the image.
analyse_media
Finding Sources
Finding Sources
Finding Sources
Reading File
Reading File
Loading Image
Reading File
This is exactly the diagram in your image. Here is a complete viva-ready discussion:
The Visual Pathway and Lesion-Field Defects
This is the classic diagram of the visual pathway from the retina to the occipital cortex, showing four lesion sites (A-D) and their corresponding visual field defects.
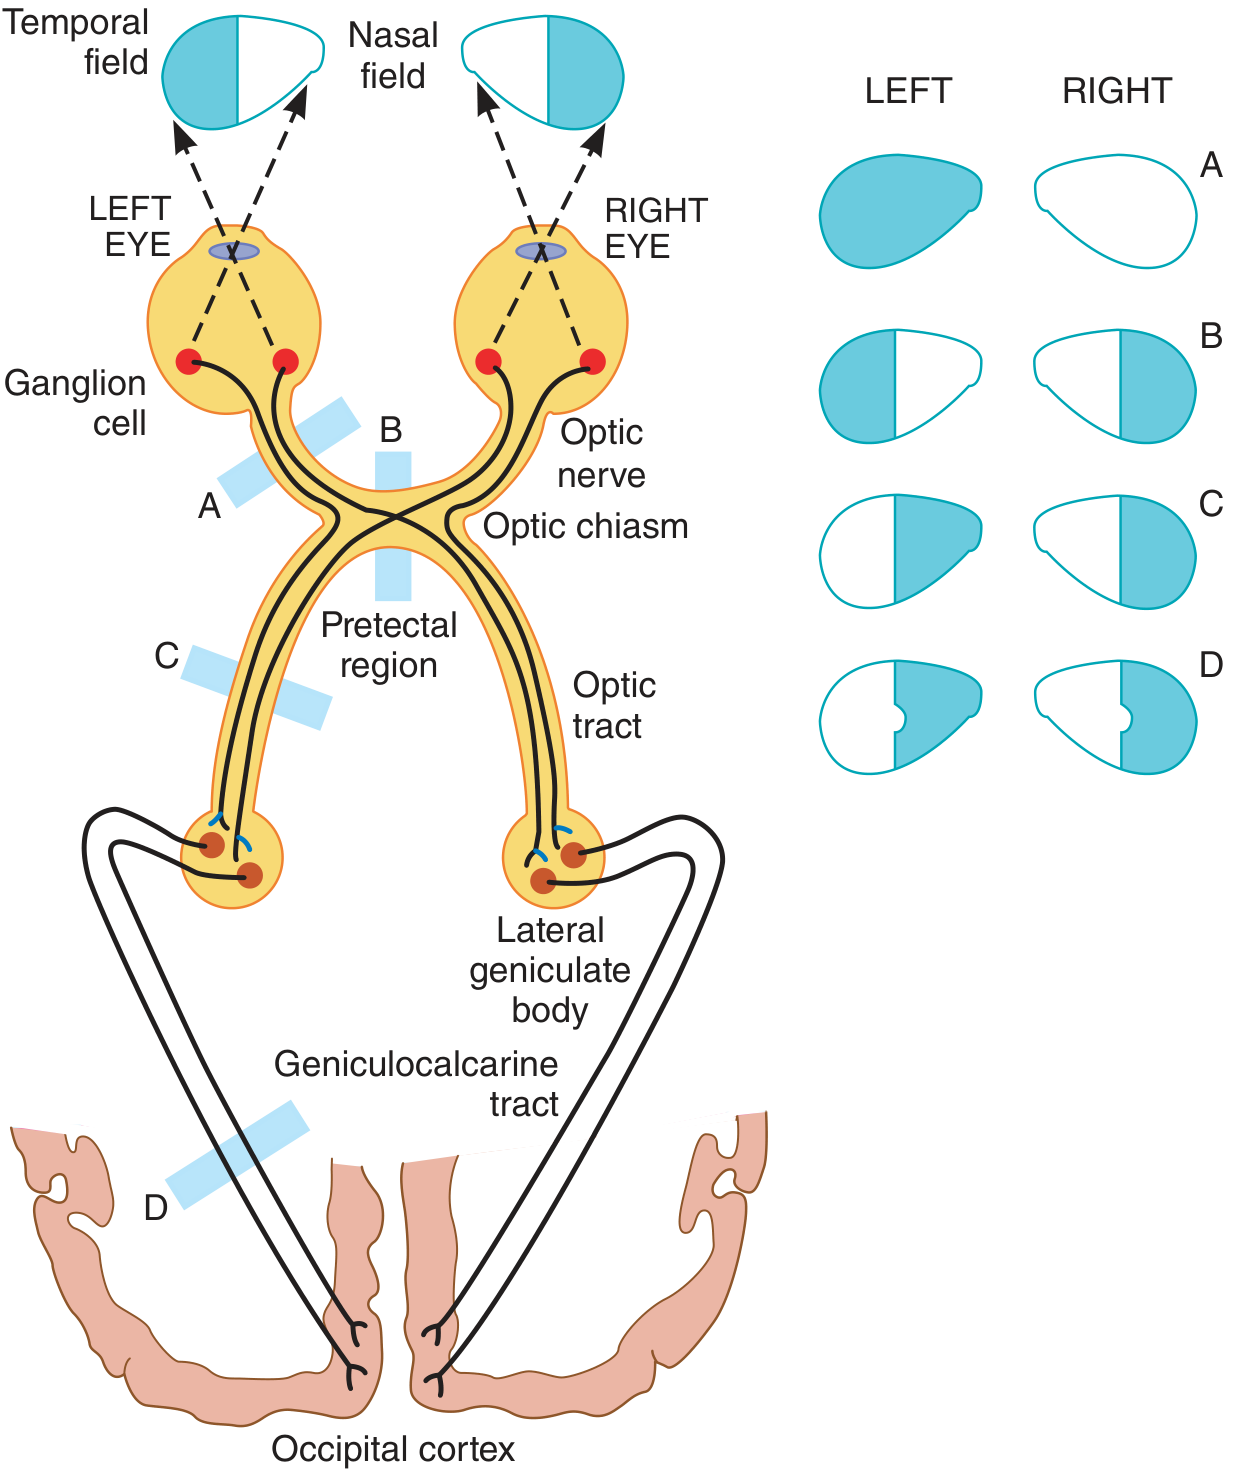
Structures in the Pathway (top to bottom)
| Structure | Role |
|---|---|
| Retinal ganglion cells | Origin of the pathway; axons form the optic nerve |
| Optic nerve | Carries all visual info from one eye |
| Optic chiasm | Crossing point - only nasal (medial) hemiretinal fibers decussate |
| Optic tract | Post-chiasmal; carries temporal fibers from same side + nasal fibers from opposite side |
| Pretectal region | Relay for the pupillary light reflex |
| Lateral geniculate body (LGB) | Thalamic relay; 6 laminated layers |
| Geniculocalcarine tract (optic radiations) | Projects to occipital cortex via temporal and parietal lobes |
| Occipital (calcarine) cortex | Primary visual cortex (V1); area 17 |
Key Anatomical Principle: The Decussation Rule
- Nasal (medial) hemiretina fibers cross at the optic chiasm
- Temporal (lateral) hemiretina fibers stay ipsilateral
- After the chiasm, each optic tract carries visual information from the contralateral visual field of both eyes
- The left cortex "sees" the right visual field, and vice versa
Lesion Sites and Visual Field Defects
Lesion A - Left Optic Nerve (before the chiasm)
- Defect: Complete blindness in the left eye only (monocular blindness / amaurosis)
- Right eye is normal
- This is because no decussation has occurred yet
- Key viva point: The Marcus Gunn (RAPD - relative afferent pupillary defect) will be positive in the left eye
Lesion B - Optic Chiasm (central, e.g. pituitary tumor)
- Defect: Bitemporal hemianopia - loss of the outer (temporal) visual fields of both eyes
- This is a heteronymous hemianopia (defects are on opposite sides of the vertical meridian)
- Caused by destruction of the crossing nasal fibers from both retinas
- Classic cause: pituitary macroadenoma growing superiorly; also craniopharyngioma, meningioma of tuberculum sellae, aneurysm of anterior circle of Willis
- Key viva point: This is the ONLY lesion that produces bitemporal hemianopia - "Only a lesion of the optic chiasm causes true bitemporal hemianopia" (Bradley and Daroff's Neurology)
Lesion C - Left Optic Tract (pretectal region, post-chiasm)
- Defect: Right homonymous hemianopia - loss of right half of visual field in BOTH eyes
- Homonymous = same side of the vertical meridian in both eyes
- Often incongruous (asymmetric between the two eyes) because fibers from both eyes are not yet tightly interdigitated
- The left tract carries: temporal fibers from left eye + nasal fibers from right eye (both serving the right visual field)
- Key viva point: Retrochiasmal lesions always produce homonymous defects. The more anterior in the retrochiasmal pathway, the more incongruous the defect.
Lesion D - Left Occipital Cortex / Geniculocalcarine Tract
- Defect: Right homonymous hemianopia with macular sparing
- Notice in the diagram that a central island of vision is preserved on the right side for both eyes
- Macular sparing occurs because the macular cortex at the occipital pole has dual blood supply from both the MCA and PCA - occlusion of the PCA (most common cause of occipital infarct) spares the pole
- Defect is congruous (identical in both eyes) because fibers are tightly packed at the cortex
- Key viva point: Macular sparing = occipital cortex lesion (most commonly PCA territory infarct). If the macula is NOT spared, it is more likely to be an optic tract or radiation lesion.
Summary Table for Viva
| Site | Lesion | Visual Field Defect | Congruity | Common Cause |
|---|---|---|---|---|
| A - Optic nerve | Monocular blindness (left) | Unilateral | N/A | Optic neuritis, trauma, optic glioma |
| B - Optic chiasm | Bitemporal hemianopia | Heteronymous | N/A | Pituitary adenoma |
| C - Optic tract | Contralateral homonymous hemianopia | Incongruous | Stroke, tumor | |
| D - Occipital cortex | Contralateral homonymous hemianopia + macular sparing | Congruous | PCA infarct |
Additional Viva Points
-
Meyer's loop: The inferior optic radiation fibers loop anteriorly through the temporal lobe. A temporal lobe lesion causes a contralateral superior quadrantanopia ("pie in the sky" defect).
-
Parietal lobe lesions: Affect inferior optic radiations, causing contralateral inferior quadrantanopia ("pie on the floor").
-
Pupillary reflex: The pupillary light reflex pathway branches off at the pretectal region (before the LGB). So retrogeniculate (cortical) lesions - even causing complete hemianopia - do NOT affect the pupillary reflex.
-
RAPD testing: A lesion of the optic nerve or optic tract (pre-LGB) can cause a relative afferent pupillary defect (RAPD), detectable with the swinging flashlight test.
-
Pituitary tumor growth pattern: As a pituitary adenoma enlarges superiorly, it first compresses the inferior chiasmal fibers, causing upper bitemporal quadrantanopia first, then progressing to full bitemporal hemianopia.
- Ganong's Review of Medical Physiology, Figure 10-14
- Adams and Victor's Principles of Neurology, 12th Ed - Lesions of the Chiasm, Optic Tract, and Geniculocalcarine Pathway
- Bradley and Daroff's Neurology in Clinical Practice - Box 16.2 General Rules of Visual Field


+12 more
discussion in viva reference from guyton
I can clearly see all 8 images. Let me identify them and search the medical library simultaneously.
The charts shown are:
- Sarcomere structure (Z line, sarcomere, thick myosin, thin actin)
- Convergence (synaptic property)
- Taste Bud (A=taste pore, B=taste receptor cell, C=basal cell, D=afferent nerve)
- Facilitated diffusion (carrier protein transport)
- Na-K ATPase pump (with Ouabain, significance in heart failure)
- Action potential (membrane potential graph, phases 1-4)
- Olfactory pathway (OG, PG, Gr, M, T, CP)
- Long-term potentiation / synaptic plasticity (NMDA, AMPA, retrograde messenger NO)
Let me search Guyton for all these topics now.
Reading File
Finding Sources
Guyton and Hall is in the library. Now let me search all 8 topics simultaneously.
Finding Sources
Finding Sources
Finding Sources
Finding Sources
Finding Sources
Finding Sources
Finding Sources
Finding Sources
Reading File
Reading File
Reading File
Loading Image
Loading Image
I have the Guyton textbook images and content. Now I have all the material needed to compile comprehensive viva discussions for all 8 charts.Here is the complete viva discussion for all 8 charts, with Guyton and Hall references throughout:
Viva Discussion - All Charts (Guyton & Hall Reference)
CHART 1 - Sarcomere Structure (Slide 11)
Identify the spotter:
This is a diagram of the Sarcomere - the basic contractile unit of skeletal muscle.
What do 1, 2, 3 & 4 represent?
- 1 - Z Line (Z disk): Cross-filamentous proteins that anchor actin filaments; the sarcomere lies between two successive Z disks
- 2 - Sarcomere: The functional unit of muscle, from one Z disk to the next (~2 micrometers at full contraction)
- 3 - Thick Myosin Filament: Each myofibril contains ~1500 myosin filaments; forms the A band (dark, anisotropic to polarized light)
- 4 - Thin Actin Filament: Each myofibril contains ~3000 actin filaments; forms the I band (light, isotropic to polarized light)
Viva points:
- The A band = myosin + overlapping actin ends (dark)
- The I band = actin filaments only (light)
- The H zone = region of myosin not overlapped by actin
- Titin (connectin) molecules hold myosin filaments in place, act as molecular springs
- Maximal force is generated at sarcomere length ~2.2 µm (optimal overlap)
- Cross-bridges project from myosin and interact with actin to produce contraction (sliding filament mechanism)
Reference: Guyton and Hall, Chapter 6 - Contraction of Skeletal Muscle
CHART 2 - Convergence (Slide 13)
Identify this synaptic property:
This is Convergence - a synaptic property where multiple presynaptic neurons (shown as triangular neurons at the bottom) synapse onto a single postsynaptic neuron (single arrow at the top).
Significance:
- Modifies the activity of the postsynaptic neuron - the output depends on the summation of all inputs
- Allows spatial summation - simultaneous firing of multiple inputs can reach threshold even if no single input can
- Allows temporal summation - repeated inputs from the same source can accumulate
- Convergence is the neural basis for integration - the CNS receives and integrates information from many sources before deciding on a response
- Example: A motor neuron receives converging inputs from the corticospinal tract, vestibulospinal tract, reticulospinal tract, and sensory afferents
Reference: Guyton and Hall, Chapter 45 - Organization of the Nervous System, Basic Functions of Synapses
CHART 3 - Taste Bud (Slides 14 & 15)
Identify the spotter: This is a Taste Bud
What are A, B, C and D?
- A - Taste Pore: The small opening at the surface of the taste bud where dissolved substances (tastants) enter
- B - Taste Receptor Cell: Specialized receptor cells with microvilli (taste hairs) projecting through the pore; contain receptor proteins that bind taste molecules
- C - Basal Cell: Stem cells that regenerate taste receptor cells approximately every 10 days
- D - Afferent Nerve: Sensory fibers that transmit taste signals to the brain (CN VII, IX, X)
Viva points:
- Taste buds are located mainly on the tongue (circumvallate, fungiform, foliate papillae), also on soft palate, pharynx, epiglottis
- 5 primary taste sensations: Sweet, sour, salty, bitter, umami (glutamate)
- Taste signals travel via:
- CN VII (chorda tympani) - anterior 2/3 of tongue
- CN IX (glossopharyngeal) - posterior 1/3 of tongue
- CN X (vagus) - epiglottis and pharynx
- All converge on the nucleus tractus solitarius (NTS) in the medulla, then thalamus, then gustatory cortex (parietal/insular)
Reference: Guyton and Hall, Chapter 53 - The Chemical Senses: Taste and Smell
CHART 4 - Facilitated Diffusion (Slide 17)
Identify the chart: This is Facilitated Diffusion using membrane carrier proteins (Guyton Figure 4.8)
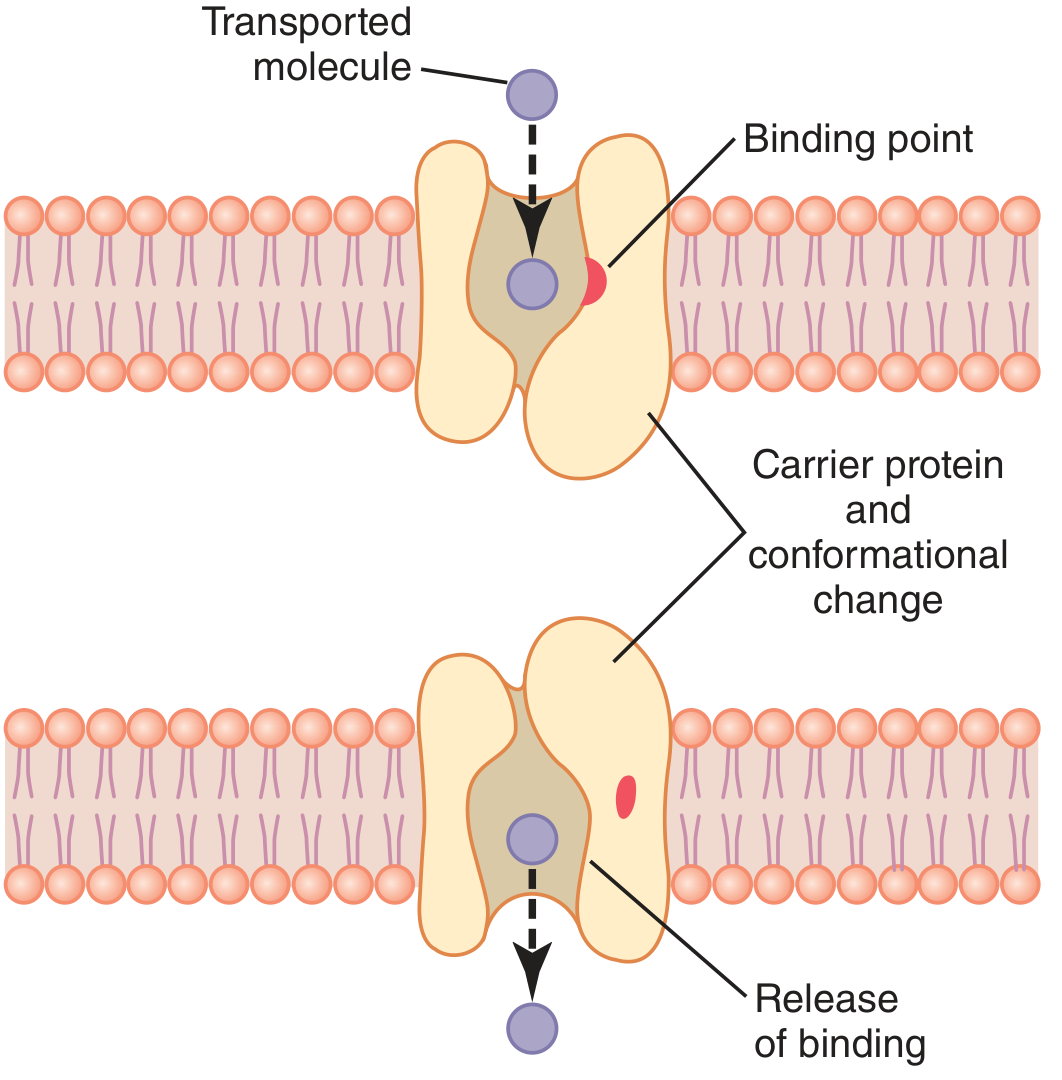
Transport mechanism:
- The transported molecule approaches the carrier protein
- It enters the pore and binds to a specific receptor/binding site
- A conformational change occurs in the carrier protein
- The pore opens on the opposite side and the molecule is released
Key difference from simple diffusion:
- Simple diffusion: rate increases linearly with concentration
- Facilitated diffusion: rate approaches a maximum (Vmax) - becomes saturated when all carrier proteins are occupied
Give one example: Glucose - transported into cells by GLUT proteins (GLUT1-4)
- GLUT4 (in skeletal muscle, adipose, heart) is stimulated by insulin, increasing glucose uptake by 10-20 fold
Other examples: Amino acids, fructose, galactose
Key point: Facilitated diffusion is passive - moves substances DOWN the concentration gradient, requires NO energy (ATP)
Reference: Guyton and Hall, Chapter 4 - Transport of Substances Through Cell Membranes
CHART 5 - Na+-K+ ATPase Pump (One of the slides)
Identify the transport mechanism: This is the Sodium-Potassium Pump (Na+-K+ ATPase) - Primary Active Transport (Guyton Figure 4.12)
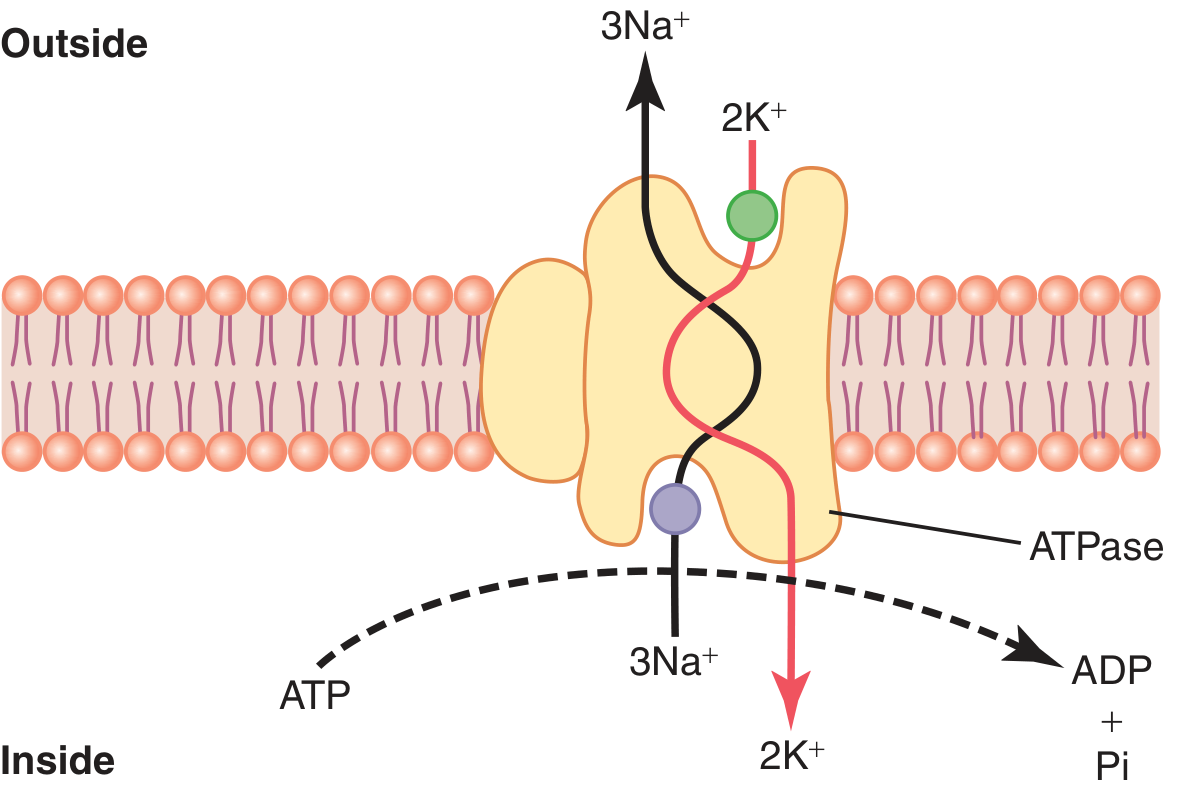
Mechanism:
- 3 Na⁺ out (from intracellular cytoplasm to ECF)
- 2 K⁺ in (from ECF into cytoplasm)
- For every cycle: 1 ATP is hydrolyzed to ADP + Pi
- The protein has ATPase activity on its inner cytoplasmic portion
- Ouabain (cardiac glycoside) blocks the K⁺ binding site on the outside, inhibiting the pump
Labeled components in the diagram:
- B = K⁺ binding site (extracellular)
- Subunits 1-5 = structural components of the alpha and beta subunits of the pump
- α = catalytic subunit (contains ATPase, Na⁺/K⁺ binding sites)
Significance in Heart Failure:
- The pump keeps intracellular [Na⁺] low and [K⁺] high - essential for maintaining resting membrane potential
- Digitalis/Ouabain inhibits Na+-K+ ATPase → intracellular Na⁺ rises → Na⁺-Ca²⁺ exchanger works less efficiently → intracellular Ca²⁺ increases → increased force of myocardial contraction (positive inotropy)
- This is the mechanism by which digoxin treats heart failure
Other functions of the pump:
- Maintains resting membrane potential (-70 mV)
- Controls cell volume - prevents osmotic swelling and lysis
- In nerve cells, 60-70% of total energy expenditure goes to this pump
Reference: Guyton and Hall, Chapter 4; Chapter 22 (Heart Failure)
CHART 6 - Action Potential (Membrane Potential Graph)
Identify the chart: This is the Action Potential of a nerve fiber, showing membrane potential (mV) vs time (ms)
Labels:
- PS = Polarized State (Resting Membrane Potential = -70 mV)
- LR = Local Response / Local Excitatory State
- Firing Level = Threshold potential (~-55 mV)
- Phase 1 (box) = Stimulus period / rising phase begins
- Phase 2 (box) = Rising phase / Depolarization (Na⁺ rushes in; peak ~+35 mV)
- Phase 3 (box) = Falling phase / Repolarization (K⁺ rushes out)
- Phase 4 (box) = After-hyperpolarization / Undershoot (membrane more negative than resting, -70 mV)
Phases in sequence:
| Phase | Event | Ion channels |
|---|---|---|
| Resting (-70 mV) | Polarized state | Leak K⁺ channels open |
| Threshold (-55 mV) | Firing level reached | Voltage-gated Na⁺ channels begin to open |
| Depolarization | Rapid rise to +35 mV | Na⁺ channels fully open, Na⁺ rushes IN |
| Repolarization | Rapid fall | Na⁺ channels inactivate; K⁺ channels open, K⁺ rushes OUT |
| After-hyperpolarization | Below -70 mV | K⁺ channels slow to close |
| Return to resting | Na⁺-K⁺ pump restores gradients | Pump active |
Refractory Periods:
- Absolute Refractory Period (ARP): During depolarization - Na⁺ channels are inactivated; NO stimulus can generate another AP
- Relative Refractory Period (RRP): During after-hyperpolarization - a STRONGER than normal stimulus can generate another AP
Reference: Guyton and Hall, Chapter 5 - Membrane Physiology, Nerve, and Muscle
CHART 7 - Olfactory Pathway (Diagram with OG, PG, Gr, M, T, CP)
Identify the chart: This is the Olfactory Bulb Neural Circuit / Olfactory Pathway
Labeled structures:
- Gr = Granule cell (yellow star-shaped) - inhibitory interneurons
- OG = Olfactory Glomerulus - spherical synaptic complexes where olfactory nerve fibers synapse
- PG = Periglomerular cell - inhibitory interneurons surrounding glomeruli
- M = Mitral cell - primary output neurons of the olfactory bulb
- T = Tufted cell - secondary output neurons
- CP = Cribriform Plate - the bony sieve through which olfactory nerve filaments pass
Pathway:
- Odorant molecules dissolve in nasal mucus → bind to olfactory receptor proteins on cilia of olfactory receptor neurons
- Signal travels up olfactory nerve filaments (CN I) through the cribriform plate of the ethmoid bone
- Synapses in olfactory glomeruli of the olfactory bulb
- Mitral and tufted cells relay signals via the olfactory tract
- Signals go to:
- Prepyriform cortex and amygdala (for emotional/behavioral responses - no thalamic relay)
- Thalamus → Orbitofrontal cortex (for conscious smell perception)
Inhibitory interneurons (Gr and PG cells) create lateral inhibition, sharpening odor discrimination
Key viva point: Olfaction is the ONLY sense that does NOT relay through the thalamus before reaching the cortex primarily
Reference: Guyton and Hall, Chapter 53 - The Chemical Senses
CHART 8 - Long-Term Potentiation / Synaptic Plasticity (Last chart: Glu, NMDA, AMPA, retrograde messenger NO)
Identify the chart: This is the diagram of Long-Term Potentiation (LTP) - the cellular basis of learning and memory
Key components in the diagram:
| Structure | Role |
|---|---|
| Glu (Glutamate) | Excitatory neurotransmitter released from presynaptic terminal |
| NMDA receptor (central green channel) | Voltage-gated + ligand-gated; blocked by Mg²⁺ at rest |
| AMPA receptor (lower green channel) | Fast ionotropic glutamate receptor; mediates baseline transmission |
| Ca²⁺/calmodulin kinase | Activated by Ca²⁺ influx through NMDA; phosphorylates proteins |
| PKC (Protein Kinase C) | Activated downstream; involved in synaptic strengthening |
| Tyrosine kinase (Fyn) | Additional signaling kinase |
| Retrograde messenger (NO?) | Nitric oxide travels BACKWARD to presynaptic terminal to enhance transmitter release |
| New AMPA receptors | Inserted into postsynaptic membrane - key mechanism of LTP |
| Enhanced transmitter release | Presynaptic effect of retrograde signaling |
Mechanism of LTP step by step:
- Weak stimulation: Glutamate activates AMPA receptors only → small depolarization
- Strong/repeated stimulation: Sufficient depolarization removes Mg²⁺ block from NMDA receptor
- NMDA receptor opens → Ca²⁺ floods into postsynaptic cell
- Ca²⁺ activates Ca²⁺/calmodulin kinase, PKC, tyrosine kinase
- These kinases trigger:
- Insertion of new AMPA receptors into the synapse (making it more sensitive)
- Production of retrograde messenger (likely Nitric Oxide, NO)
- NO diffuses backward to the presynaptic terminal → enhanced neurotransmitter release in future stimulations
- Result: The synapse is now potentiated - same input produces GREATER output
Clinical/exam significance:
- LTP is the cellular mechanism of learning and memory (especially hippocampus)
- NMDA antagonists (like ketamine, MK-801) block LTP
- NMDA receptors require BOTH glutamate binding AND depolarization (coincidence detector)
- LTP can last hours to weeks - the basis of long-term memory storage
Reference: Guyton and Hall, Chapter 74 - Behavioral and Motivational Mechanisms of the Brain; Chapter 45 - Synaptic and Neurohumoral Transmission
Summary Table for Quick Viva Recall:
| Chart | Topic | Key Guyton Chapter |
|---|---|---|
| 1 | Sarcomere (Z line, myosin, actin) | Ch. 6 |
| 2 | Convergence - synaptic property | Ch. 45 |
| 3 | Taste bud (pore, receptor, basal, nerve) | Ch. 53 |
| 4 | Facilitated diffusion (GLUT transporters) | Ch. 4 |
| 5 | Na⁺-K⁺ ATPase (3 Na out, 2 K in, Ouabain) | Ch. 4, 22 |
| 6 | Action potential (PS, LR, phases 1-4) | Ch. 5 |
| 7 | Olfactory pathway (OG, PG, Mitral, Tufted) | Ch. 53 |
| 8 | Long-term potentiation (NMDA, AMPA, NO) | Ch. 74 |
+8 more
give me a short discussion for viva take reference from guyton testbook
Here are short, viva-ready discussions for all 6 charts, referenced from Guyton & Hall:
1. ENDOCYTOSIS (Vesicle fusing with cell membrane → cytoplasm)
Identify: This is Endocytosis - a form of vesicular transport where the cell membrane engulfs extracellular material.
Mechanism (as shown):
- A vesicle containing molecules approaches the cell membrane
- The vesicle progressively fuses with the membrane
- Contents are released into the cytoplasm
Types:
- Pinocytosis - ingestion of fluid/small molecules ("cell drinking")
- Phagocytosis - ingestion of large particles like bacteria ("cell eating")
- Receptor-mediated endocytosis - specific molecules bind surface receptors, membrane invaginates and internalizes them
Example: Uptake of LDL cholesterol, insulin receptor internalization, absorption of immunoglobulins in the gut
Guyton & Hall, Ch. 2 - The Cell and Its Functions
2. Na⁺-K⁺ ATPase PUMP (with Ouabain, heart failure)
Identify the transport mechanism: This is Primary Active Transport via the Na⁺-K⁺ ATPase Pump (Guyton Figure 4.12)
Mechanism:
- 3 Na⁺ are pumped OUT of the cell (cytoplasm → ECF)
- 2 K⁺ are pumped INTO the cell (ECF → cytoplasm)
- 1 ATP is hydrolyzed to ADP + Pi per cycle
- The protein has intrinsic ATPase activity on its cytoplasmic surface
Labeled components:
- B = K⁺ binding site (extracellular)
- 3 Na⁺ out / 2 K⁺ in = electrogenic ratio (net +1 charge out → contributes to membrane potential)
- Ouabain = cardiac glycoside that blocks the extracellular K⁺ binding site, inhibiting the pump
Significance in Heart Failure:
Ouabain/Digitalis inhibits Na⁺-K⁺ ATPase → intracellular Na⁺ rises → Na⁺-Ca²⁺ exchanger works less → intracellular Ca²⁺ increases → stronger cardiac contraction (positive inotropy)
This is the mechanism of digoxin in treating heart failure.
Other functions of the pump:
- Maintains resting membrane potential (-70 mV)
- Controls cell volume (prevents osmotic swelling)
- Nerve cells use 60-70% of their energy just for this pump
Guyton & Hall, Ch. 4 - Transport of Substances Through Cell Membranes; Ch. 22 - Heart Failure
3. OLFACTORY PATHWAY (OG, PG, Gr, M, T, CP)
Identify the chart: This is the Neural Circuit of the Olfactory Bulb showing the olfactory pathway.
Labeled structures:
| Label | Structure | Function |
|---|---|---|
| Gr | Granule cell | Inhibitory interneuron (GABAergic); causes lateral inhibition |
| OG | Olfactory Glomerulus | Synaptic complex where olfactory nerve axons first synapse |
| PG | Periglomerular cell | Inhibitory interneuron surrounding glomeruli |
| M | Mitral cell | Primary output neuron of the olfactory bulb |
| T | Tufted cell | Secondary output neuron |
| CP | Cribriform Plate | Bony sieve of ethmoid through which CN I fibers pass |
Pathway:
- Odorant → dissolves in nasal mucus → binds olfactory receptor proteins on receptor cell cilia
- Signal travels via CN I through cribriform plate
- Synapses in olfactory glomeruli in the olfactory bulb
- Mitral & Tufted cells relay signals via the olfactory tract to:
- Prepyriform cortex + Amygdala (emotion, behavior - NO thalamic relay)
- Thalamus → Orbitofrontal cortex (conscious smell perception)
Key viva point: Olfaction is the ONLY sense that does NOT first relay through the thalamus before reaching the cortex.
Guyton & Hall, Ch. 53 - The Chemical Senses: Taste and Smell
4. Na⁺-K⁺ ATPase PUMP - Detailed Diagram (3Na out, 2K in, ATPase)
This is the same pump as above but shown in greater structural detail (this is directly Guyton Figure 4.12).
Key points to say in viva:
- This is primary active transport - energy from ATP is used directly
- The pump is electrogenic - creates a slight negative charge inside the cell
- 3 binding sites for Na⁺ on the intracellular face; 2 binding sites for K⁺ on the extracellular face
- ATPase activity is on the intracellular (cytoplasmic) portion
- When 3 Na⁺ bind inside and 2 K⁺ bind outside → ATPase is activated → ATP cleaved → conformational change → ions are transported
Guyton & Hall, Ch. 4
5. ACTION POTENTIAL (Membrane potential graph, PS, LR, Firing level, Phases 1-4)
Identify the chart: This is the Action Potential of a nerve fiber - a graph of membrane potential (mV) vs time (ms)
Labels explained:
- PS = Polarized State = Resting Membrane Potential = -70 mV
- LR = Local Response / Local Excitatory State (subthreshold depolarization)
- Firing Level = Threshold potential = -55 mV (the point of no return)
- Box 1 = Stimulus period (resting state, before threshold)
- Box 2 = Depolarization - Na⁺ channels open, Na⁺ rushes IN; peak reaches +35 mV
- Box 3 = Repolarization - Na⁺ channels inactivate; K⁺ channels open, K⁺ rushes OUT
- Box 4 = After-hyperpolarization - K⁺ channels slow to close; membrane briefly more negative than resting (~-80 mV), then returns to -70 mV
Refractory Periods:
- Absolute Refractory Period (ARP): During depolarization - Na⁺ channels are inactivated; NO new action potential can fire regardless of stimulus strength
- Relative Refractory Period (RRP): During after-hyperpolarization - a stronger than normal stimulus CAN fire another AP
All-or-None Law: Once threshold is reached, the action potential fires fully regardless of stimulus intensity.
Guyton & Hall, Ch. 5 - Membrane Physiology, Nerve, and Muscle
6. LONG-TERM POTENTIATION / SYNAPTIC PLASTICITY (NMDA, AMPA, NO, retrograde messenger)
Identify the chart: This is Long-Term Potentiation (LTP) - the cellular and molecular basis of learning and memory.
Key components:
| Label | Role |
|---|---|
| Glu | Glutamate - excitatory neurotransmitter from presynaptic terminal |
| NMDA receptor (upper green channel) | Ligand-gated + voltage-gated; normally blocked by Mg²⁺ at rest |
| AMPA receptor (lower green channel) | Fast glutamate receptor; mediates normal baseline synaptic transmission |
| Ca²⁺/calmodulin kinase | Activated by Ca²⁺ influx; phosphorylates postsynaptic proteins |
| PKC | Protein Kinase C; further amplifies synaptic strengthening |
| Tyrosine kinase (Fyn) | Additional signaling kinase activated during LTP |
| Retrograde messenger (NO?) | Nitric oxide travels BACK to presynaptic terminal → enhanced future transmitter release |
| New AMPA receptors | Inserted into postsynaptic membrane → the synapse becomes MORE sensitive |
Mechanism - step by step:
- Weak stimulation: Glutamate activates only AMPA receptors → small depolarization
- Strong/repeated stimulation: Enough depolarization to dislodge Mg²⁺ block from NMDA receptor
- NMDA opens → Ca²⁺ floods into postsynaptic neuron
- Ca²⁺ activates kinases (CaM kinase, PKC, Fyn)
- New AMPA receptors are inserted into the synapse → synapse is now more responsive
- Retrograde NO diffuses to presynaptic terminal → enhanced glutamate release in future
- Result: Same input now produces a greater output = the synapse is potentiated
Significance:
- LTP is the cellular mechanism of learning and memory, especially in the hippocampus
- NMDA receptor acts as a coincidence detector - requires BOTH presynaptic glutamate release AND postsynaptic depolarization simultaneously
- NMDA antagonists (ketamine) block LTP and impair memory formation
Guyton & Hall, Ch. 74 - States of Brain Activity: Sleep, Brain Waves, Epilepsy, Psychoses; Ch. 45 - Synaptic and Neurohumoral Transmission
This is a shared conversation. Sign in to Orris to start your own chat.