
Warburg effect
Warburg effect aerobic glycolysis cancer metabolism diagram
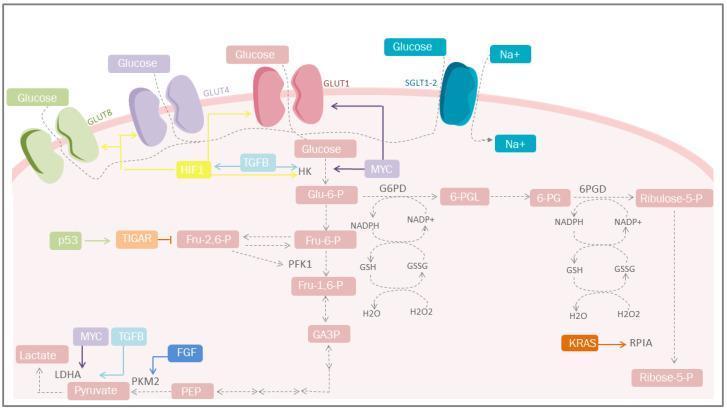
This pathophysiology diagram illustrates the metabolic reprogramming of a cell, specifically focusing on the Warburg effect and altered glucose metabolism common in cancer biology. The diagram depicts the plasma membrane featuring multiple glucose transporters, including SGLT1-2 (sodium-coupled), GLUT1, GLUT4, and GLUT8, which facilitate increased glucose uptake. The primary glycolytic pathway is shown progressing from Glucose to Glu-6-P (via HK), through Fru-6-P, Fru-1,6-P, GA3P, and PEP, ultimately leading to Pyruvate and Lactate (via LDHA). Parallel to glycolysis, the Pentose Phosphate Pathway (PPP) is detailed, converting G6P to Ribose-5-P while generating NADPH for redox homeostasis (GSH/GSSG balance) to mitigate ROS. Key regulatory mediators are highlighted: HIF-1 and MYC stimulate glucose transporters and glycolytic enzymes; TGFB and FGF influence PKM2 and LDHA activity; p53 regulates the process through TIGAR to inhibit Fru-2,6-P. The visual summarizes how oncogenic signaling (including KRAS) drives aerobic glycolysis and pentose production to support rapid cell proliferation and antioxidant defense.
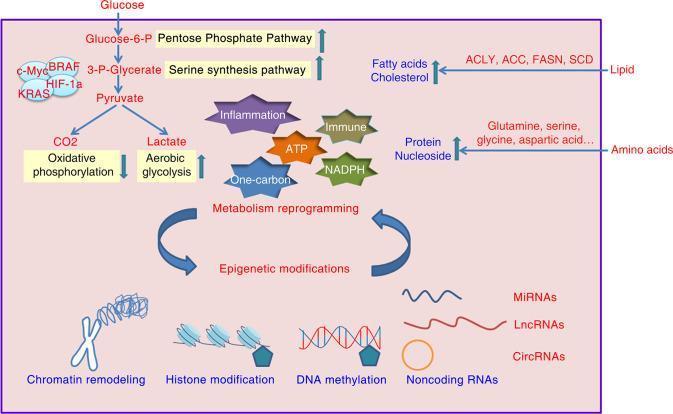
This pathophysiology diagram illustrates the bidirectional relationship between metabolic reprogramming and epigenetic modifications in cancer cells. The upper section details altered metabolic pathways, showing glucose metabolism shifting toward aerobic glycolysis (Warburg effect), the pentose phosphate pathway, and the serine synthesis pathway, while oxidative phosphorylation is downregulated. Key oncogenic drivers such as c-Myc, BRAF, KRAS, and HIF-1α are shown influencing these processes. Additionally, lipid metabolism (ACLY, ACC, FASN, SCD) and amino acid metabolism (glutamine, serine, glycine) are depicted as being enhanced to support protein, nucleoside, and fatty acid synthesis. Central metabolic outputs like ATP, NADPH, and one-carbon metabolism are shown contributing to inflammation and immune responses. The lower section identifies the mechanisms of epigenetic modification, including chromatin remodeling, histone modification, DNA methylation, and noncoding RNAs (miRNAs, lncRNAs, circRNAs). Circular arrows indicate the feedback loop where metabolic intermediates act as substrates or cofactors for epigenetic enzymes, and epigenetic changes in turn regulate the expression of metabolic enzymes.
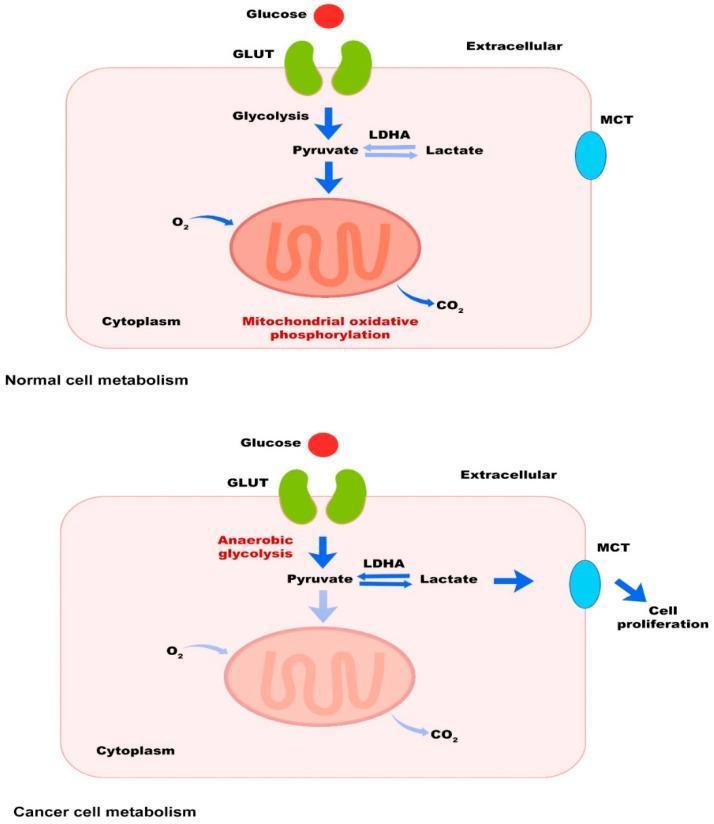
This pathophysiology diagram illustrates the metabolic differences between a normal cell and a cancer cell, specifically highlighting the Warburg effect. The top panel, 'Normal cell metabolism,' shows glucose entering the cytoplasm via GLUT transporters, undergoing glycolysis to form pyruvate, which then enters the mitochondrion for oxidative phosphorylation, consuming oxygen (O2) and releasing carbon dioxide (CO2). The bottom panel, 'Cancer cell metabolism,' depicts glucose uptake via GLUT followed by anaerobic glycolysis (even in the presence of oxygen). In this pathway, pyruvate is preferentially converted to lactate by the enzyme LDHA (lactate dehydrogenase A). The lactate is then exported from the cell through monocarboxylate transporters (MCT), a process labeled as promoting cell proliferation. This comparative diagram emphasizes the metabolic shift from efficient mitochondrial energy production in healthy tissues to rapid glycolytic processing in tumor environments, facilitating biomass accumulation and cellular growth.
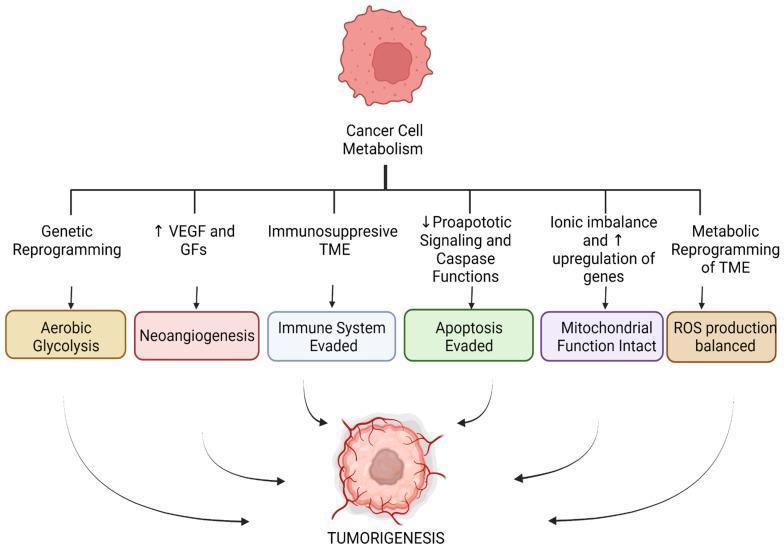
This medical flowchart illustrates the complex pathways of cancer cell metabolism and their contribution to tumorigenesis. At the apex, a single cell icon is labeled 'Cancer Cell Metabolism'. This central concept branches into six primary pathophysiological mechanisms: Genetic Reprogramming, increased VEGF and Growth Factors (GFs), Immunosuppressive Tumor Microenvironment (TME), decreased Proapoptotic Signaling and Caspase Functions, Ionic Imbalance with gene upregulation, and Metabolic Reprogramming of the TME. These mechanisms lead to specific cellular outcomes depicted in colored boxes: Aerobic Glycolysis (the Warburg effect), Neoangiogenesis, Immune System Evasion, Apoptosis Evasion, Maintenance of Mitochondrial Function, and Balanced ROS Production. Arrows from each of these outcomes converge at the bottom towards a node labeled 'TUMORIGENESIS', which is accompanied by an illustration of an advanced tumor mass with visible neovascularization. The diagram serves as an educational summary of the 'Hallmarks of Cancer' related to metabolic and microenvironmental adaptation, emphasizing how these diverse pathways collectively drive malignant progression.
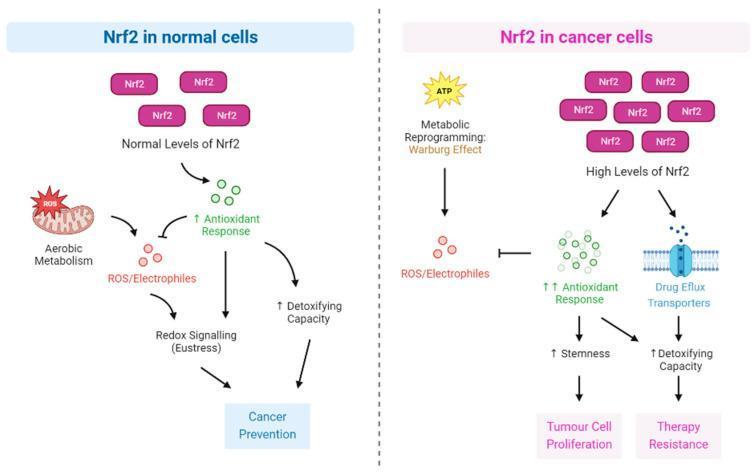
This pathophysiology diagram compares the role of the Nrf2 (nuclear factor erythroid 2-related factor 2) signaling pathway in normal versus cancer cells. The left panel shows that in normal cells, aerobic metabolism produces moderate reactive oxygen species (ROS)/electrophiles. Normal levels of Nrf2 activate an antioxidant response that maintains redox signaling (eustress) and enhances detoxifying capacity, ultimately contributing to cancer prevention. The right panel illustrates a pathological state in cancer cells characterized by the 'Warburg Effect' (metabolic reprogramming) and high levels of Nrf2. In this context, constitutively high Nrf2 significantly upregulates the antioxidant response, which suppresses ROS. However, this dysregulation also activates drug efflux transporters and promotes stemness, leading to increased detoxifying capacity, tumor cell proliferation, and therapy resistance. The diagram uses flow arrows to represent the progression from metabolic triggers to clinical outcomes, highlighting how a cytoprotective pathway is co-opted for malignancy and chemoresistance.
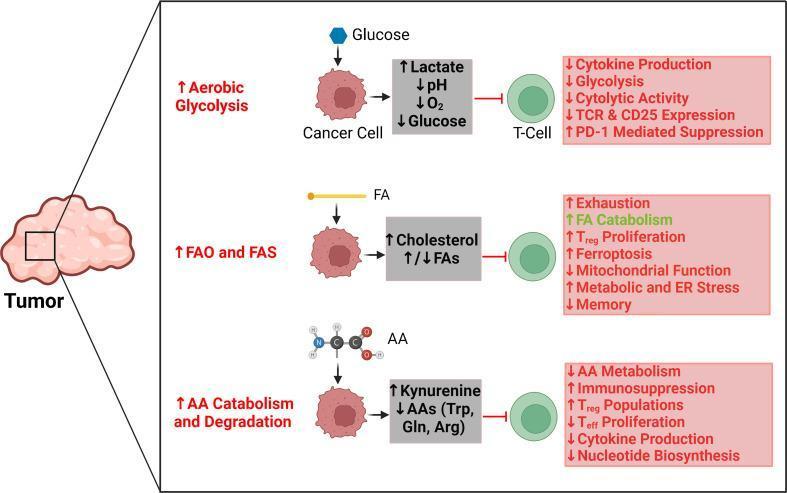
A pathophysiology diagram illustrating the metabolic competition and signaling interactions between cancer cells and T-cells within the tumor microenvironment (TME). The diagram is organized into three horizontal rows corresponding to major metabolic pathways: aerobic glycolysis, lipid metabolism (FAO and FAS), and amino acid (AA) catabolism. In the top row, increased aerobic glycolysis in cancer cells leads to high lactate, low pH, hypoxia, and glucose depletion, which inhibits T-cells, resulting in decreased cytokine production, cytolytic activity, and increased PD-1 expression. The middle row shows how upregulated fatty acid oxidation (FAO) and synthesis (FAS) increase cholesterol and alter fatty acid levels, leading to T-cell exhaustion, ferroptosis, and metabolic/ER stress, while paradoxically supporting FA catabolism and Treg proliferation. The bottom row depicts AA catabolism and degradation (involving Trp, Gln, and Arg), which increases kynurenine levels and suppresses T-cell effector functions (Teff proliferation and cytokine production) while promoting Treg populations. Visual cues include red inhibition arrows and boxes representing immunosuppressive effects, and green text indicating supportive metabolic activities. This educational figure highlights how tumor-driven metabolic reprogramming subverts antitumor immunity.
Warburg effect aerobic glycolysis cancer metabolism
The Warburg Effect
Historical Background
Normal vs. Cancer Cell Energy Metabolism
| Normal Quiescent Cell | Cancer Cell (Warburg) | |
|---|---|---|
| O₂ present | OXPHOS (36 ATP/glucose) | Glycolysis → Lactate (~2-4 ATP/glucose) |
| ATP yield | High | Much lower per glucose |
| Glycolysis rate | Basal | Up to 200x higher |
| End product | CO₂ + H₂O | Lactate (exported via MCT) |
| Mitochondria | Primary energy source | Biosynthetic intermediates |
Why Do Cancer Cells "Choose" Glycolysis?
1. Biosynthetic Precursors (Most Important Reason)
- Glucose-6-phosphate → pentose phosphate pathway → ribose-5-phosphate (nucleotide synthesis) + NADPH
- 3-phosphoglycerate → serine → one-carbon metabolism → purine and pyrimidine synthesis
- Citrate (from TCA cycle) → exported to cytoplasm → acetyl-CoA → lipid biosynthesis
- Alpha-ketoglutarate from glutamine → amino acid synthesis
2. Speed of ATP Generation
3. NADPH Production
4. Acidification of the Tumor Microenvironment (TME)
- Promotes cellular migration and invasion
- Suppresses cytotoxic T-cell function (immune evasion)
- Selects for more aggressive tumor phenotypes
5. Epigenetic Remodeling
Molecular Drivers
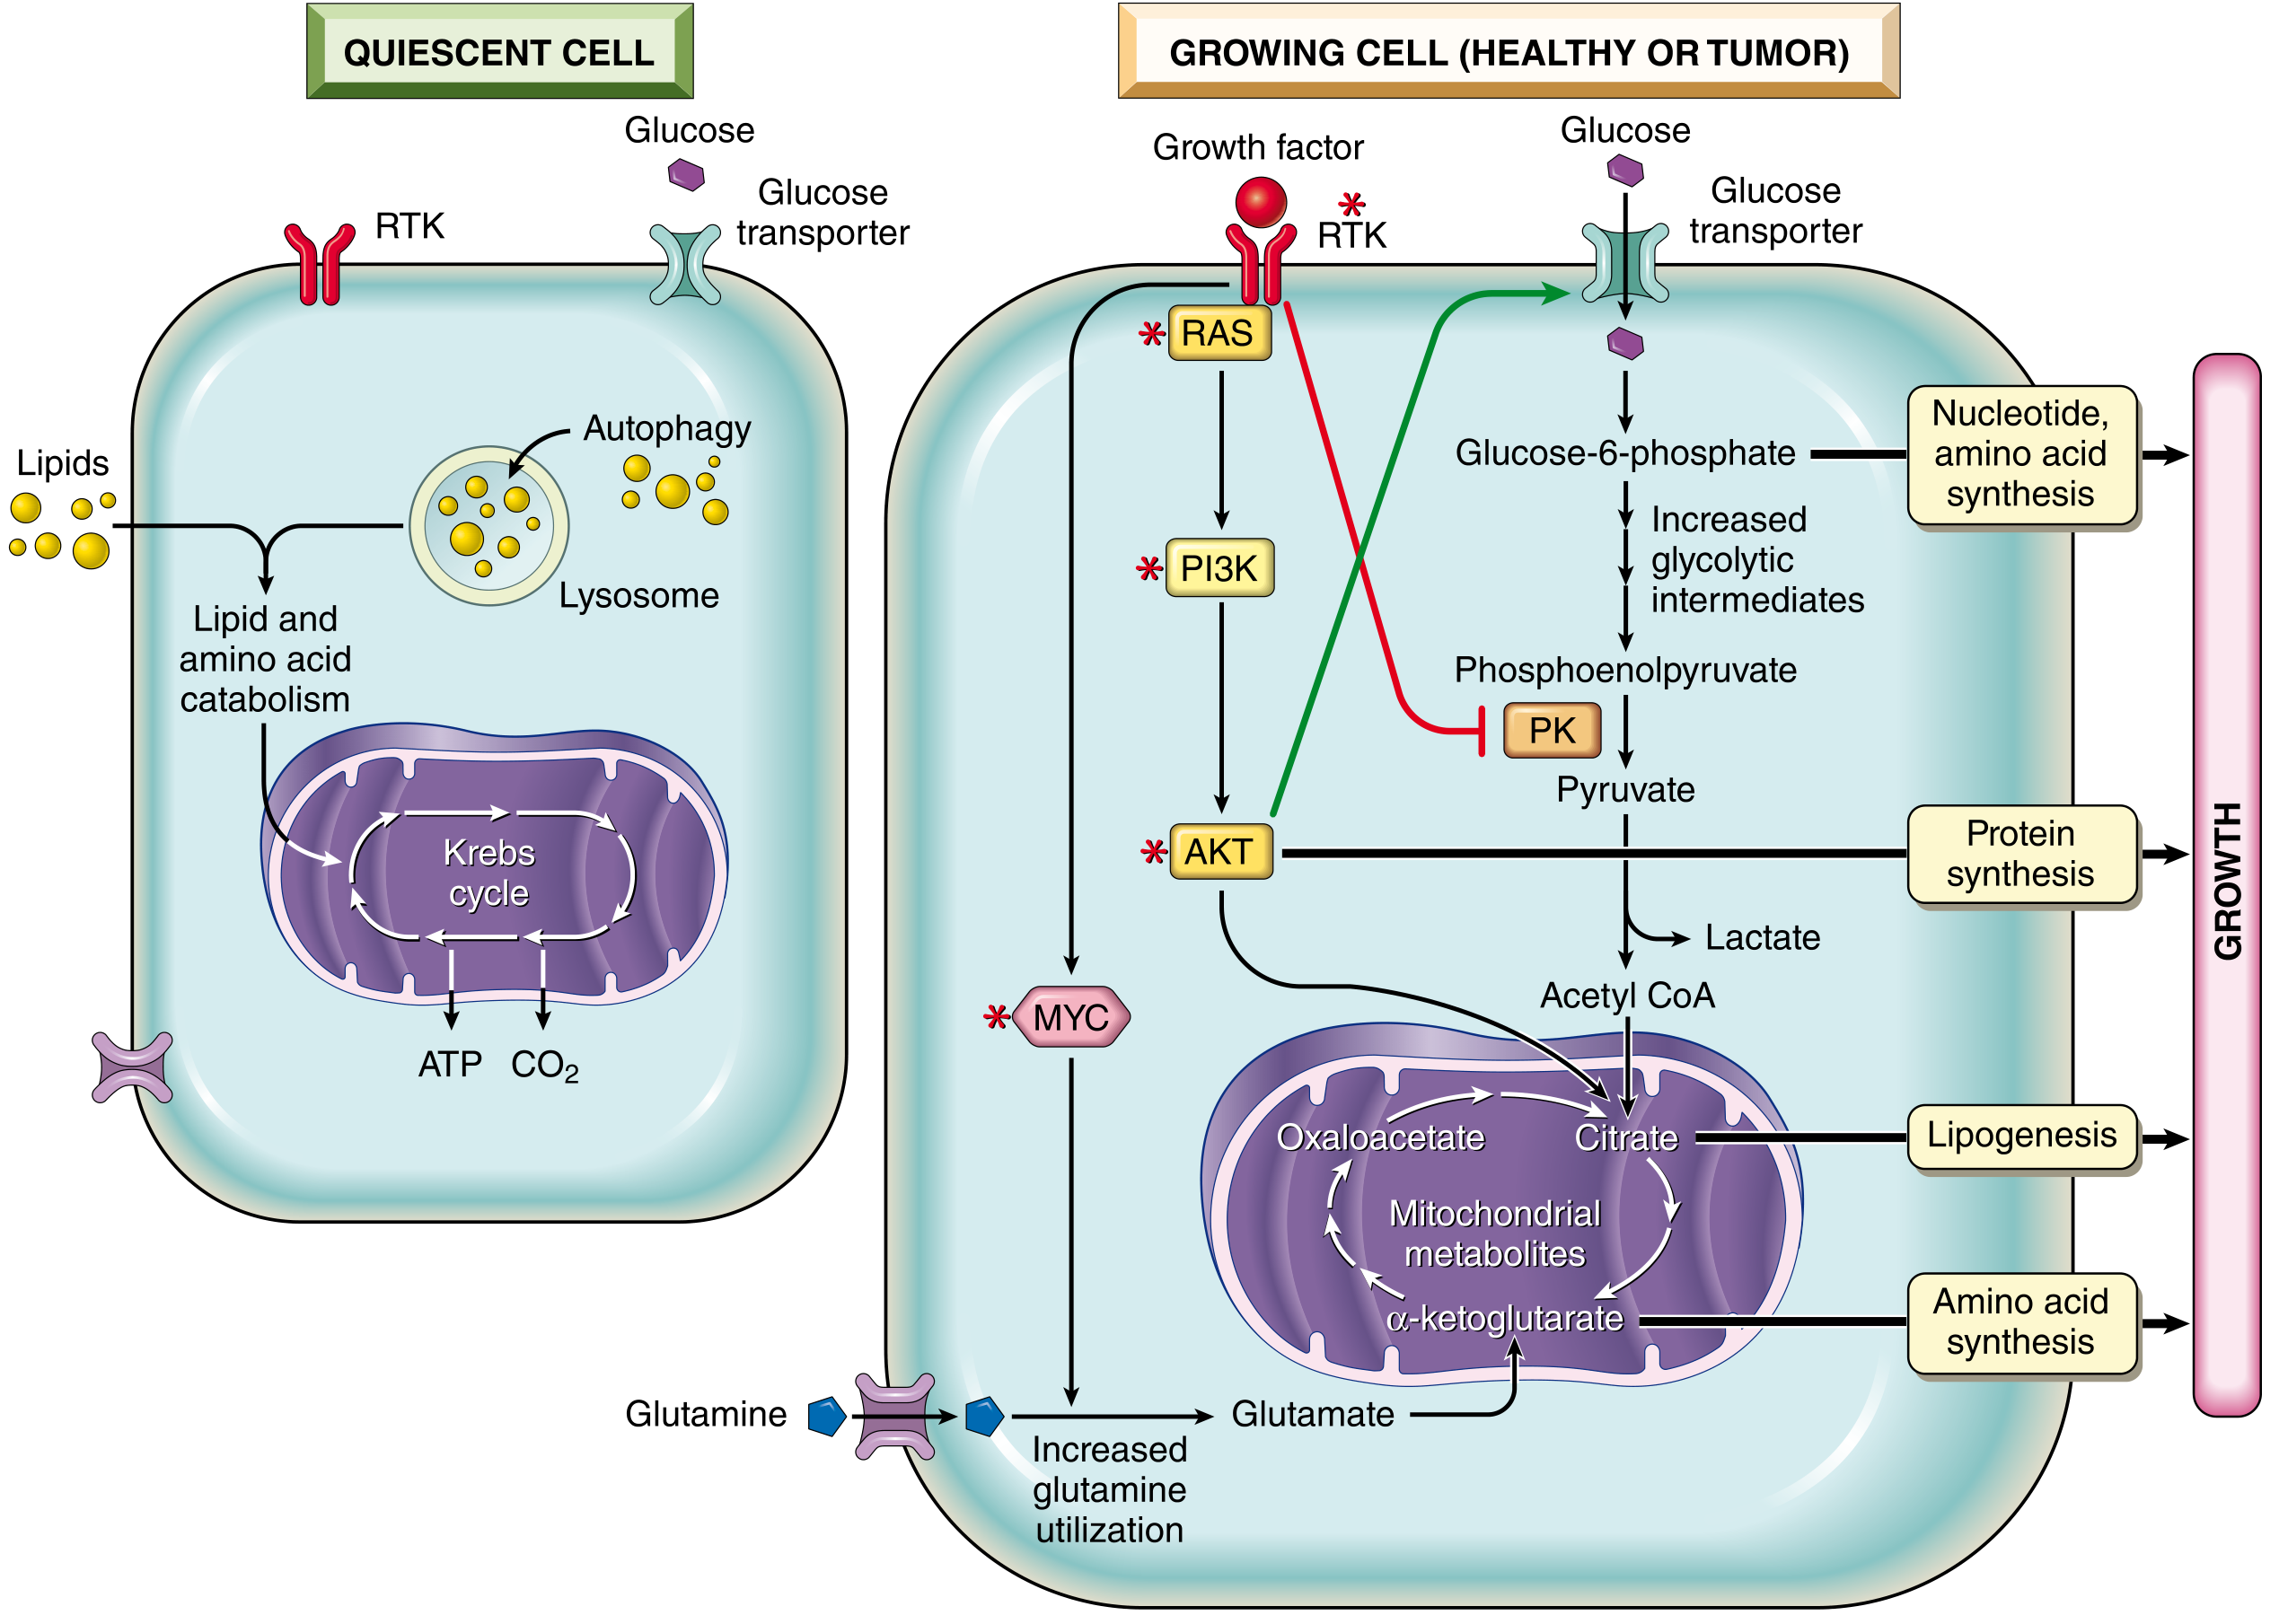
- RTK/PI3K/AKT: Upregulates GLUT transporters and glycolytic enzymes; phosphorylates and inhibits pyruvate kinase (PK), creating a "dam" that forces upstream glycolytic intermediates into biosynthesis
- RAS/MYC: MYC drives expression of glycolytic enzymes and glutaminase (for mitochondrial glutamine utilization)
- HIF-1α: Hypoxia-inducible factor, even active under normoxia in tumors, upregulates glycolytic genes and LDHA
- KRAS mutation: Increases nutrient acquisition and macromolecule synthesis
- p53 loss: p53 normally upregulates TIGAR (inhibits fructose-2,6-bisphosphate) and suppresses glycolytic enzymes; loss of p53 removes this brake
- STK11 (LKB1) loss: Normally antagonizes Warburg metabolism via AMPK
- Loss of any growth-suppressing tumor suppressor may indirectly suppress the Warburg effect
The "Oncometabolite" Extension
| Gene | Mutation | Consequence |
|---|---|---|
| IDH1/IDH2 | Gain-of-function | Converts alpha-ketoglutarate → 2-hydroxyglutarate (oncometabolite) |
| Succinate dehydrogenase (SDH) | Loss-of-function | Succinate accumulates |
| Fumarate hydratase (FH) | Loss-of-function | Fumarate accumulates |
Metabolic Reprogramming Categories (Sabiston)
- Transforming activities - directly cause cell transformation (IDH1/2, SDH, FH mutations)
- Enabling activities - support continued tumor growth but are not transforming per se (KRAS-driven nutrient acquisition)
- Neutral activities - present in cancer cells but not required for continued growth
Warburg Effect in Non-Cancer Settings
Clinical Relevance
| Application | Details |
|---|---|
| FDG-PET scanning | Tumor staging, treatment monitoring, recurrence detection |
| IDH inhibitors | Enasidenib (IDH2), ivosidenib (IDH1) - approved for AML; trials in glioma |
| Arginine depletion | Trials targeting arginine in hepatocellular carcinoma |
| GLUT inhibitors | Experimental anti-tumor approaches |
| Lactate/MCT inhibitors | Targeting lactate export to reverse TME immunosuppression |
| Metabolomics research | Broad efforts to identify tumor-specific metabolic vulnerabilities |
Recent Literature (2023-2026)
- A 2023 review in Trends in Cell Biology (Wang & Patti) proposes that the Warburg effect is a signature of mitochondrial overload - not simply a defect, but an overflow response when the electron transport chain is saturated. [PMID: 37117116]
- A 2024 review in Int J Biol Sci examines the PI3K/AKT pathway as the central link between growth factor signaling and glycolytic rewiring. [PMID: 38904014]
- A 2025 review in Immunity highlights lactate as a key immunological mediator - not just a waste product - regulating T-cell, macrophage, and dendritic cell function in the TME. [PMID: 40073846]
Septic shock pathology
"septic shock"[MeSH Terms] AND pathophysiology
septic shock pathophysiology cytokine cascade endothelial injury diagram
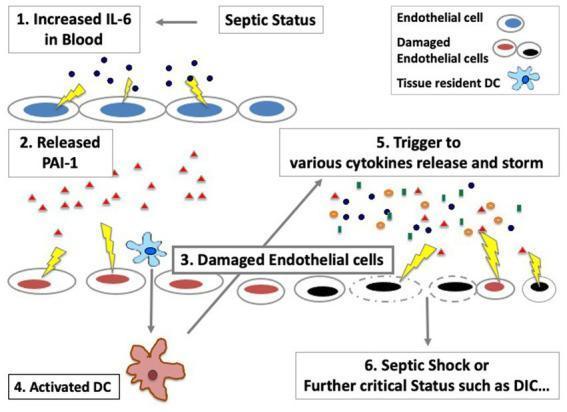
This pathophysiology diagram illustrates the sequential progression of endothelial cell damage and immune activation during sepsis. The process begins with 'Septic Status' leading to (1) increased IL-6 in the blood (blue dots). This triggers (2) the release of PAI-1 (red triangles), affecting the endothelium. (3) Endothelial cell damage is represented by a color transition from healthy blue-outlined cells to red-outlined (intermediate damage) and finally black-outlined/solid black cells (severe damage). This cellular injury leads to (4) the activation of tissue-resident dendritic cells (DC) and (5) a trigger for a massive cytokine storm, visualized as a dense cluster of multi-colored symbols. The cumulative effect of the endothelial dysfunction and cytokine release culminates in (6) septic shock or further critical status such as Disseminated Intravascular Coagulation (DIC). The diagram emphasizes the maintenance role of endothelial cells in cytokine signaling pathways and the development of coagulation system disorders.
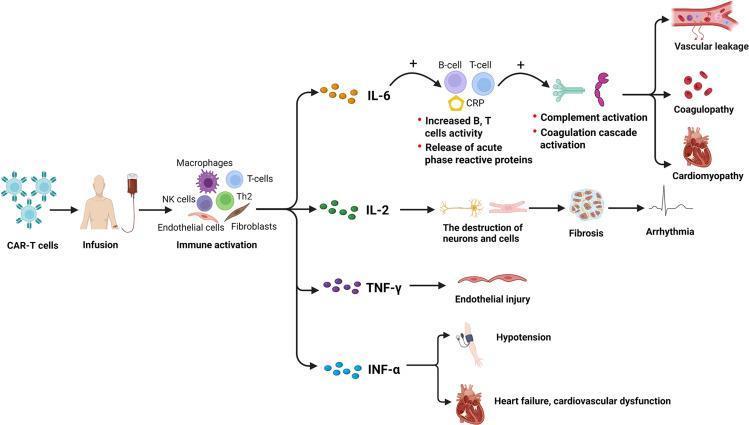
This pathophysiology diagram illustrates the cytokine-mediated mechanisms leading to cardiovascular toxicities following Chimeric Antigen Receptor (CAR)-T cell therapy. The flowchart begins with CAR-T cell infusion, progressing to immune activation involving macrophages, NK cells, T-cells, endothelial cells, and fibroblasts. This activation triggers the release of four primary cytokines: IL-6, IL-2, TNF-γ, and INF-α. IL-6 pathways show increased B-cell/T-cell activity and C-reactive protein (CRP) release, leading to complement and coagulation cascade activation, resulting in vascular leakage, coagulopathy, and cardiomyopathy. IL-2 pathways depict the destruction of neurons and cells leading to fibrosis and arrhythmia (illustrated by an ECG tracing). TNF-γ is linked to endothelial injury. INF-α pathways demonstrate outcomes of hypotension (depicted by a blood pressure cuff) and heart failure/cardiovascular dysfunction. The diagram serves as an educational tool for understanding the systemic inflammatory response and targeted cardiovascular adverse effects of cellular immunotherapy.
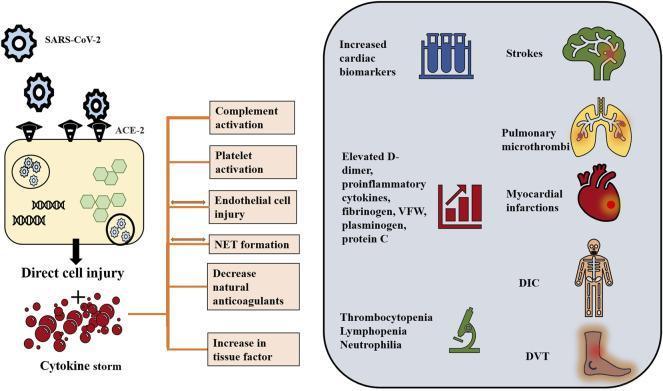
This medical infographic illustrates the pathophysiology of COVID-19-induced hyperinflammatory and hypercoagulable states. The diagram begins with SARS-CoV-2 virions binding to ACE-2 receptors on a host cell, leading to endocytosis and viral replication. This process results in direct cell injury and a subsequent cytokine storm, characterized by a proliferation of pro-inflammatory mediators. These events trigger a signaling cascade including complement and platelet activation, endothelial cell injury, Neutrophil Extracellular Trap (NET) formation, increased tissue factor, and decreased natural anticoagulants. The right side of the infographic correlates these mechanisms with laboratory findings and clinical manifestations. Laboratory indicators include increased cardiac biomarkers, elevated D-dimer, fibrinogen, and VWF (represented by bar graphs and test tubes), and hematological abnormalities like thrombocytopenia and lymphopenia (represented by a microscope). Clinical outcomes are depicted through anatomical icons showing strokes, pulmonary microthrombi, myocardial infarctions, disseminated intravascular coagulation (DIC), and deep vein thrombosis (DVT).
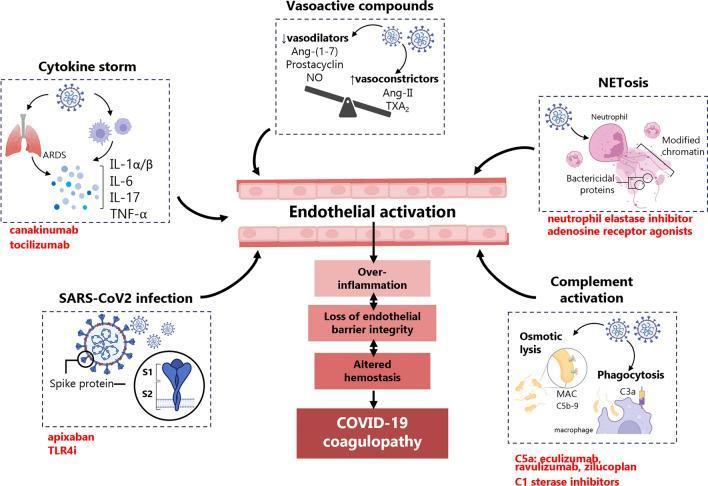
A medical pathophysiology diagram illustrating the central role of endothelial activation and dysfunction in COVID-19 coagulopathy. The central axis shows a cross-section of a blood vessel with endothelial cells undergoing activation, leading to a cascade of over-inflammation, loss of endothelial barrier integrity, and altered hemostasis, culminating in COVID-19 coagulopathy. Five primary triggers are depicted feeding into this process: 1) SARS-CoV-2 infection (mediated by the Spike protein S1/S2 domains); 2) Cytokine storm involving IL-1α/β, IL-6, IL-17, and TNF-α, associated with ARDS; 3) Vasoactive compounds showing a tipped scale favoring vasoconstrictors (Ang-II, TXA2) over vasodilators (Ang-(1-7), NO, Prostacyclin); 4) NETosis, depicting neutrophils releasing modified chromatin and bactericidal proteins; and 5) Complement activation involving osmotic lysis via MAC (C5b-9) and macrophage phagocytosis via C3a. The diagram also identifies therapeutic targets (in red text) such as tocilizumab, canakinumab, and eculizumab. This illustration is designed for medical education regarding the systemic vascular manifestations of SARS-CoV-2.
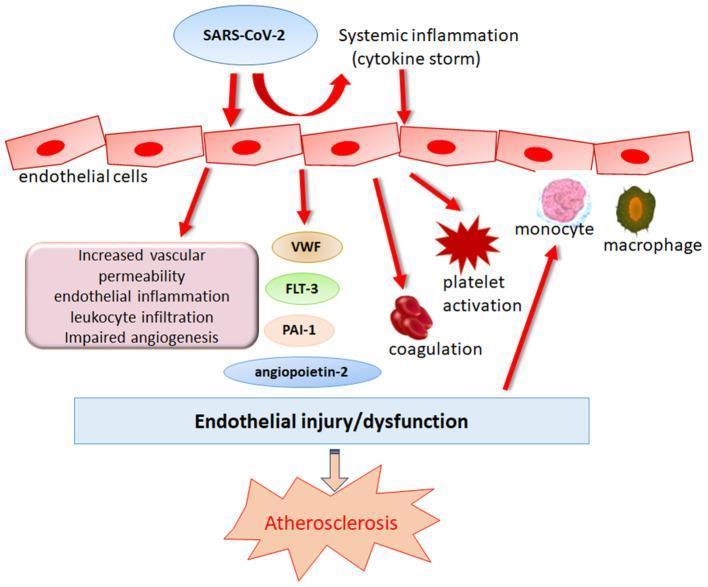
This pathophysiology diagram illustrates the mechanisms by which SARS-CoV-2 infection leads to endothelial dysfunction and subsequent atherosclerosis. The flow begins with SARS-CoV-2 and systemic inflammation (cytokine storm) acting as direct triggers on a layer of endothelial cells. This interaction initiates several downstream pathological processes: increased vascular permeability, endothelial inflammation, leukocyte infiltration, and impaired angiogenesis. The diagram highlights the release of specific molecular markers including von Willebrand factor (VWF), FLT-3, PAI-1, and angiopoietin-2. Furthermore, it depicts cellular interactions involving platelet activation, coagulation cascades, and the recruitment of monocytes which differentiate into macrophages. These combined molecular and cellular events culminate in 'Endothelial injury/dysfunction,' which is shown as a critical precursor to the development of 'Atherosclerosis.' The visual serves as an educational model for understanding COVID-19-related vascular complications and the long-term risk of cardiovascular disease in recovered patients.
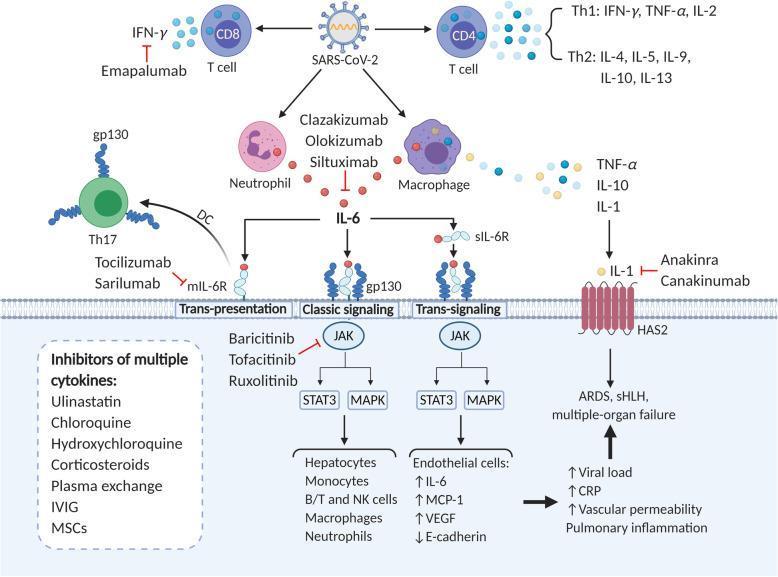
A pathophysiology diagram illustrating the immune cascade and Cytokine Release Syndrome (CRS) in COVID-19, alongside therapeutic targets. The process begins with SARS-CoV-2 infection, activating CD8+ T cells (producing IFN-γ), CD4+ T cells (Th1/Th2 cytokines), neutrophils, and macrophages. The latter release TNF-α, IL-10, IL-1, and predominantly IL-6. IL-6 signaling is detailed through three pathways: Trans-presentation (mIL-6R on dendritic cells to Th17 cells), Classic signaling (mIL-6R on hepatocytes and myeloid cells), and Trans-signaling (sIL-6R complexing with gp130 on endothelial cells). All three converge on JAK-STAT3 and JAK-MAPK intracellular pathways. Pathological outcomes include increased vascular permeability, pulmonary inflammation, ARDS, sHLH, and multi-organ failure. Therapeutic interventions shown include specific monoclonals (e.g., Tocilizumab, Anakinra, Emapalumab), JAK inhibitors (Baricitinib, Ruxolitinib), and broader immunomodulators (corticosteroids, chloroquine, plasma exchange). The diagram serves as an educational tool for understanding hyperinflammation mechanisms and the pharmacological rationale for treating severe COVID-19 complications.
"septic shock"[MeSH Terms] AND "pathophysiology"[MeSH Terms]
sepsis immunopathology organ dysfunction
Septic Shock - Pathology & Pathophysiology
Definition (Sepsis-3, 2016)
- Sepsis (life-threatening organ dysfunction from a dysregulated host response to infection)
- Plus vasopressor requirement to maintain MAP ≥65 mmHg
- Plus serum lactate >2 mmol/L despite adequate fluid resuscitation
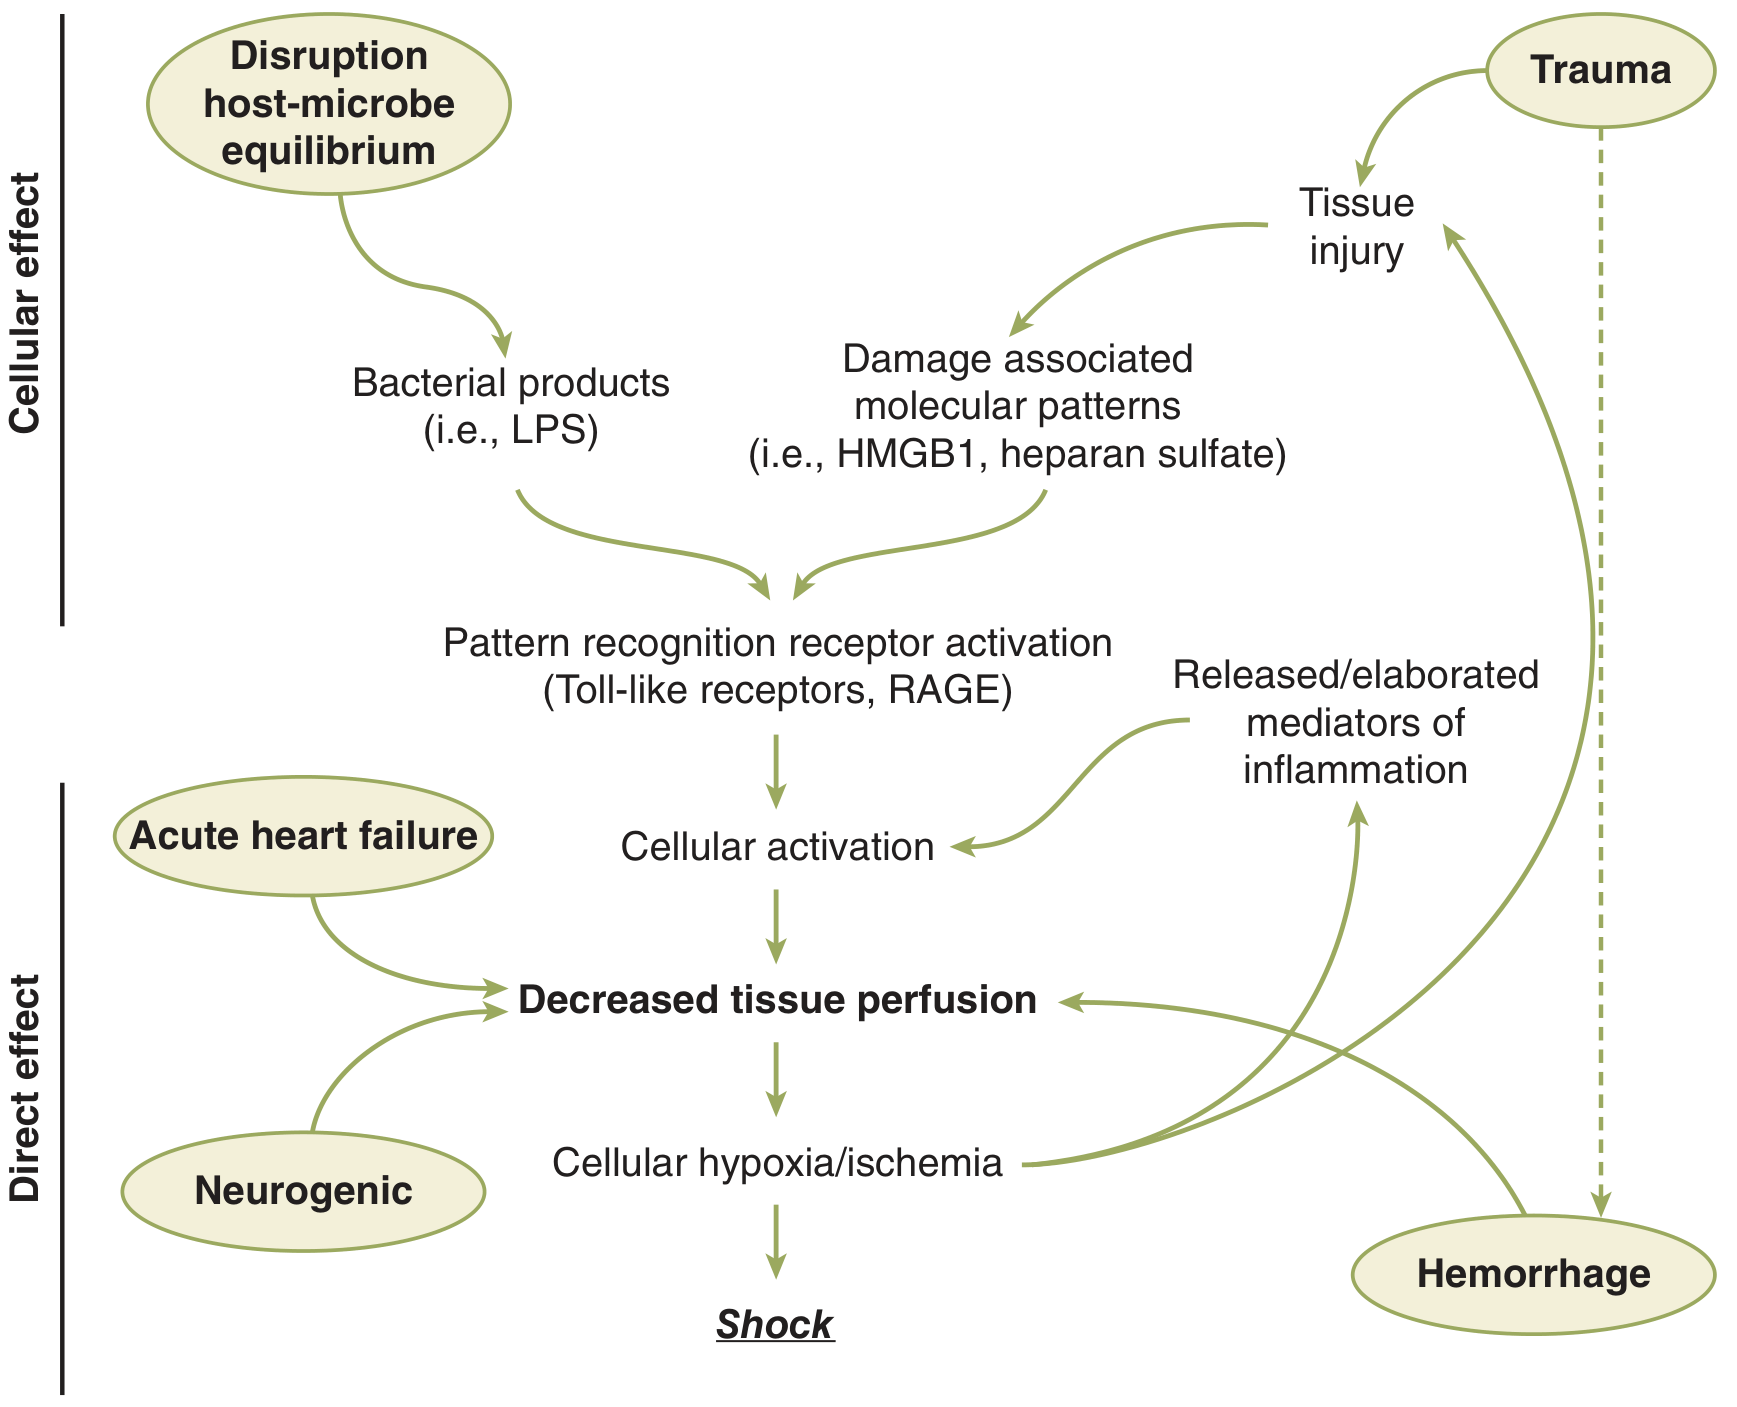
Inciting Stimuli and Pattern Recognition
| Organism | Key PAMP | Receptor |
|---|---|---|
| Gram-negative bacteria | Lipopolysaccharide (LPS/endotoxin) | TLR-4 (with CD14/MD-2) |
| Gram-positive bacteria | Lipoteichoic acid (LTA) | TLR-2 |
| Any | DAMPs (HMGB-1, heparan sulfate) | TLR-4, RAGE |
The Inflammatory Cascade
Early Mediators (peak within hours)
- TNF-α and IL-1β: Upregulate adhesion molecules on neutrophils and endothelium; cause direct endothelial injury; activate NF-κB; induce fever and acute-phase response. Antagonist therapies have failed clinically because TNF-α and IL-1β peak and decline quickly before treatment can be applied.
- IL-6: Drives hepatic acute-phase protein synthesis (CRP, fibrinogen, complement); directly depresses myocardial contractility; activates coagulation via tissue factor upregulation.
- IL-3: Amplifies acute inflammation - a potential therapeutic target.
Late/Sustained Mediators
- HMGB-1 (High Mobility Group Box 1): Released by macrophages and neutrophils hours to days after the initial insult. Activates neutrophils, monocytes, and endothelium. Critically, HMGB-1 inhibitors reduce mortality even when given 24 hours after experimental peritonitis - making it a more tractable therapeutic target than early cytokines.
Complement System
- Increase vascular permeability
- Recruit and activate neutrophils
- Directly depress myocardial function
Endothelial Injury - Central to the Pathology
- Direct cytokine toxicity (TNF-α, IL-1β, PAI-1)
- Activated neutrophil adhesion and degranulation - neutrophil extracellular traps (NETs), reactive oxygen species, proteases
- Complement membrane attack complex (C5b-9)
Consequences of Endothelial Injury:
- Increased permeability → protein-rich edema → ARDS (pulmonary), gut edema, third-spacing
- Nitric oxide (NO) release from damaged endothelium via upregulated iNOS → profound, refractory vasodilation → distributive shock physiology
- Intestinal epithelial barrier disruption → bacterial/endotoxin translocation from gut lumen → amplification of the inflammatory cycle (the "gut as the motor of MOF" hypothesis)
- Endothelial glycocalyx degradation → further permeability and coagulation dysregulation
Hemodynamic Profile (Distributive Shock)
| Parameter | Septic Shock |
|---|---|
| Cardiac Index | ↑ (initially - hyperdynamic) |
| SVR (afterload) | ↓↓ |
| CVP/PCWP | ↓ |
| SvO₂ | ↑ (early) → ↓ (late, decompensated) |
| Lactate | ↑ |
Two Phases:
- Hyperdynamic ("warm shock"): High CO, low SVR, bounding pulses, warm extremities - driven by iNOS-mediated vasodilation + compensatory tachycardia
- Hypodynamic ("cold shock" - late/decompensated): Myocardial depression (from NO, cytokines, and myocardial depressant factor), falling CO, cold extremities, refractory hypotension
Myocardial Depression
- NO (locally released into coronary circulation)
- Endotoxin (signals through TLR-4 on cardiomyocytes)
- IL-6, TNF-α
- Myocardial depressant factor
- Circulating angiotensin II (a potent vasoconstrictor that paradoxically triggers permeability)
Coagulation Dysregulation: Sepsis-Associated Coagulopathy → DIC
- Increased procoagulant activity: Tissue factor expression on monocytes/endothelium → extrinsic pathway activation → thrombin generation → fibrin microthrombi
- Decreased anticoagulant activity:
- LPS and TNF-α downregulate thrombomodulin and endothelial protein C receptor (EPCR) → less protein C activation
- Consumption/decreased synthesis of protein C, protein S, antithrombin, TFPI
- Decreased fibrinolysis: LPS and TNF-α increase PAI-1 → clots persist
Note: Meningococcemia shows particularly profound DIC because meningococcal endotoxin potently downregulates thrombomodulin.
Tissue Hypoxia and the Self-Amplifying Loop
Hypoxia
  ↓
NF-κB activation → ↑ cytokines, ↑ iNOS → ↑ NO → vasodilation
  ↓
HIF-1α activation → ↑ VEGF → inhibits fibrinolysis, ↑ iNOS
  ↓
Coagulation activation (via tissue factor, PAI-1)
  ↓
More microvascular thrombi → more hypoxia  [vicious cycle]
  ↓
DAMPs (alarmins) release → amplify inflammation further
Cellular and Metabolic Effects
Mitochondrial Dysfunction
- At the cellular level, the key derangement is dysoxia - inability of cells to use O₂ even when delivered, due to mitochondrial dysfunction (not just hypoperfusion)
- Cytochrome c oxidase inhibition by NO
- Shift to anaerobic glycolysis → lactic acidosis (lactate >2 mmol/L is a diagnostic/prognostic criterion)
- ATP depletion → failure of Na⁺/K⁺-ATPase → cellular swelling, membrane depolarization
Metabolic/Endocrine Stress Response
- HPA axis: ↑ CRH → ↑ ACTH → ↑ cortisol (gluconeogenesis, insulin resistance, immunomodulation)
- Catecholamines: ↑ glycogenolysis, ↑ gluconeogenesis, ↑ glucagon, ↓ insulin → stress hyperglycemia
- RAAS activation: ↑ Renin → ↑ angiotensin II → vasoconstriction, ↑ aldosterone → Na⁺/H₂O retention
- Vasopressin release: Vasoconstriction (splanchnic), free water retention
- Relative adrenal insufficiency: Occurs in ~30% of septic shock patients - cortisol response blunted relative to the magnitude of stress
Autophagy
Immunosuppressive Phase ("Immune Paralysis")
- Lymphocyte apoptosis (CD4+ T cells, B cells, dendritic cells)
- Monocyte deactivation (reduced HLA-DR expression, impaired antigen presentation)
- T-cell exhaustion (upregulation of PD-1, CTLA-4)
- This phase contributes significantly to late deaths from secondary infections
Multi-Organ Dysfunction Syndrome (MODS)
| Organ | Pathological Mechanism |
|---|---|
| Lungs | Endothelial + epithelial injury, capillary leak → ARDS (protein-rich alveolar edema, diffuse alveolar damage) |
| Kidneys | Hypoperfusion + direct tubular toxicity from cytokines/myoglobin → AKI (sepsis is the #1 cause of AKI in ICU) |
| Liver | Hypoperfusion, cytokine-mediated hepatocyte injury, cholestasis → elevated LFTs, hyperbilirubinemia |
| Gut | Mucosal ischemia, barrier disruption → bacterial translocation → amplifies sepsis |
| Brain | Septic encephalopathy - BBB disruption, microglial activation, neurotransmitter dysregulation → altered mental status |
| Coagulation | DIC with consumption coagulopathy |
| Adrenals | Relative adrenal insufficiency |
| Heart | Septic cardiomyopathy (reversible myocardial depression) |
Gross and Histological Pathology
| Organ | Gross | Histology |
|---|---|---|
| Lung | Heavy, red, consolidated | Diffuse alveolar damage - hyaline membranes, intra-alveolar fibrin, type II pneumocyte hyperplasia |
| Kidney | Pale cortex | Acute tubular necrosis (ischemic pattern) |
| Adrenals | Hemorrhagic (in meningococcemia - Waterhouse-Friderichsen syndrome) | Cortical hemorrhagic necrosis |
| Skin | Petechiae, purpura (especially meningococcemia) | Leukocytoclastic vasculitis, fibrin thrombi in dermal vessels |
| Liver | Nutmeg pattern (centrilobular congestion) | Centrilobular necrosis, intrahepatic cholestasis |
| Multiple organs | Microthrombi (in DIC) | Fibrin thrombi in small vessels, ischemic necrosis |
Recent Evidence (2023-2026)
- A 2023 review in Critical Care (Bode et al.) focuses on host-directed therapies - immunostimulation in the late immunosuppressed phase, precision phenotyping of patients to match treatments to host response state. [PMID: 38057824]
- A 2026 review in FASEB Journal (Qu et al.) emphasizes sepsis heterogeneity and advances in immunopathology including trained immunity, metabolic reprogramming of immune cells, and the gut-lung axis. [PMID: 41637655]
Summary: The Pathological Cascade
Infection (LPS/LTA → TLR activation)
         ↓
NF-κB → cytokine storm (TNF-α, IL-1β, IL-6)
         ↓
Endothelial injury + NO release
    ↙                    ↘
Vasodilation/           Coagulation
Capillary leak          activation → DIC
(distributive shock)         ↓
    ↘                  Microvascular thrombi
Tissue hypoperfusion ←——————————┘
         ↓
Mitochondrial dysfunction (dysoxia)
         ↓
Multi-organ failure → Death (40-50%)