
Muscular dystrophy
"muscular dystrophy"[MeSH Terms]
muscular dystrophy histology muscle biopsy
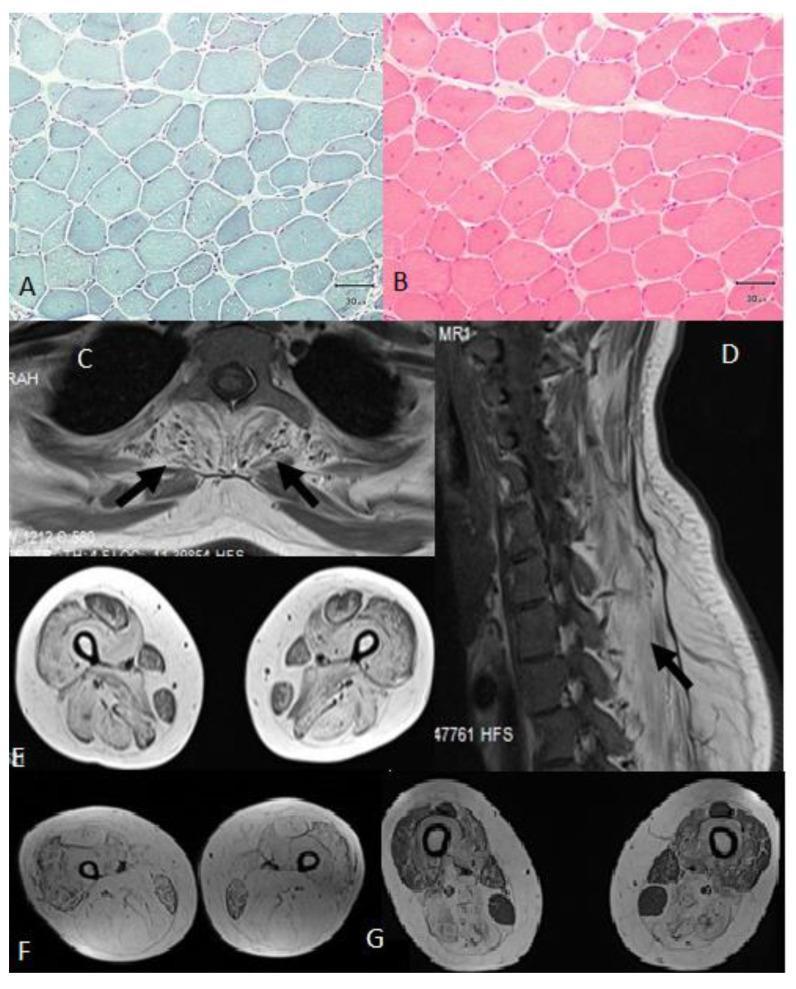
This composite figure integrates light microscopy of muscle biopsies and clinical MRI scans illustrating a plectin-related muscular dystrophy. Panels (A) and (B) present transverse sections of deltoid muscle biopsy using different stains. (A) shows polygonal muscle fibers with bluish immunohistochemical staining, while (B) shows H&E-stained rounded muscle fibers. Both highlight myopathic features including over 10% internal nuclei and angular atrophic fibers. Panels (C-G) are T1-weighted MRI sequences. (C) and (D) provide axial and sagittal views of the spine, respectively, with arrows indicating fatty infiltration of the paraspinal muscles. Panels (E), (F), and (G) are axial views of the thighs showing varying degrees of muscular pathology. (F) demonstrates advanced fatty transformation of the hamstrings and adductors, while (G) shows selective fatty replacement in the adductor magnus, adductor longus, biceps femoris, semitendinosus, and semimembranosus. Throughout the MRI series, a consistent clinical sign is the relative sparing of the rectus femoris, gracilis, and sartorius muscles, which is a characteristic diagnostic pattern for certain limb-girdle muscular dystrophies and congenital myasthenic syndromes.
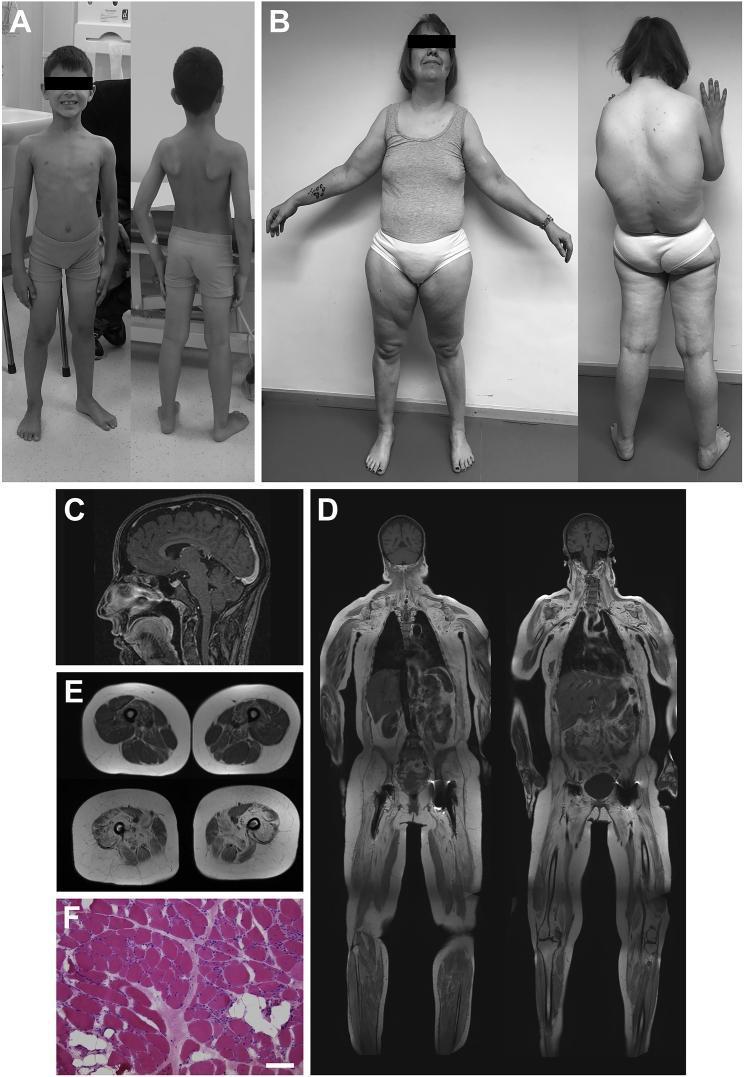
This composite educational image illustrates the clinical, radiological, and histological manifestations of Congenital Muscular Dystrophy (CMD) associated with bi-allelic INPP5K mutations. (A-B) Clinical photographs show pediatric and adult patients displaying characteristic proximal muscle atrophy, particularly in the shoulder girdle and posterior thighs, along with a wide stance and 'hunchback' (kyphosis). Adult patients demonstrate severe limitation in arm elevation (max 45°). (C-E) T1-weighted MRI sequences include a sagittal cranial view showing mild global brain atrophy and coronal whole-body and axial thigh views showing advanced progressive muscle atrophy and extensive fatty replacement (degeneration) of muscle tissue, most notably in the vastus medialis, rectus femoris, and semimembranosus. (F) A muscle biopsy specimen (H&E stain) demonstrates classic dystrophic features: marked variation in fiber size, rounding of myofibers, increased endomysial collagen (fibrosis), and areas of fatty degeneration (clear spaces). This collection serves as a reference for diagnosing syndromic CMD presenting with cataracts and intellectual disability.
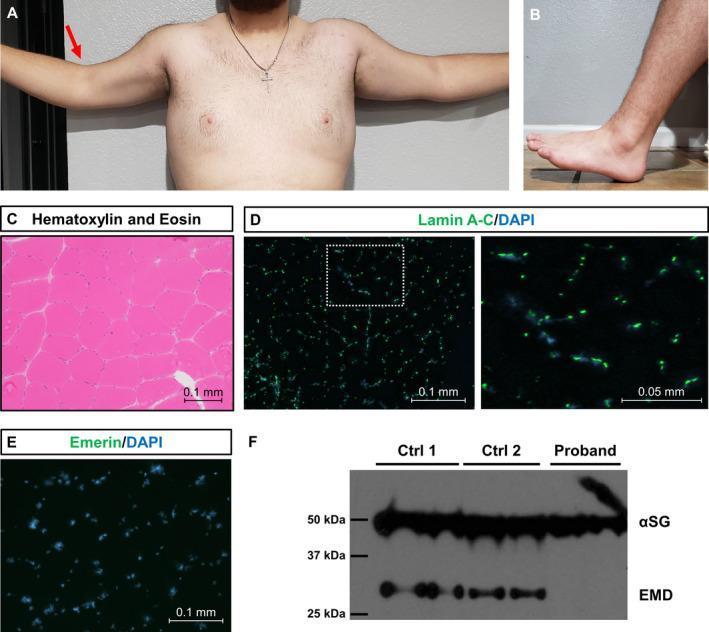
This composite image details the clinicopathological findings of X-linked Emery-Dreifuss muscular dystrophy (EDMD1). Panels A and B are clinical photographs showing physical manifestations: (A) illustrates restricted elbow extension due to contractures (indicated by a red arrow), and (B) shows limited ankle dorsiflexion, indicative of an Achilles tendon contracture. Panel C presents a muscle biopsy (vastus lateralis) with hematoxylin and eosin (H&E) staining, displaying general muscle morphology. Panels D and E are immunofluorescence microscopy images comparing protein expression; (D) shows normal nuclear localization of lamin A/C (green) co-localizing with DAPI (blue), while (E) demonstrates a complete absence of emerin staining in the proband’s nuclei. Panel F is a western blot confirming these results, showing a 34 kDa emerin (EMD) band in two control samples that is absent in the proband's lysate, while the 50 kDa alpha-sarcoglycan (αSG) loading control remains consistent across all samples. These findings collectively characterize the classic triad of EDMD: early-onset contractures, progressive muscle weakness, and emerin protein deficiency.
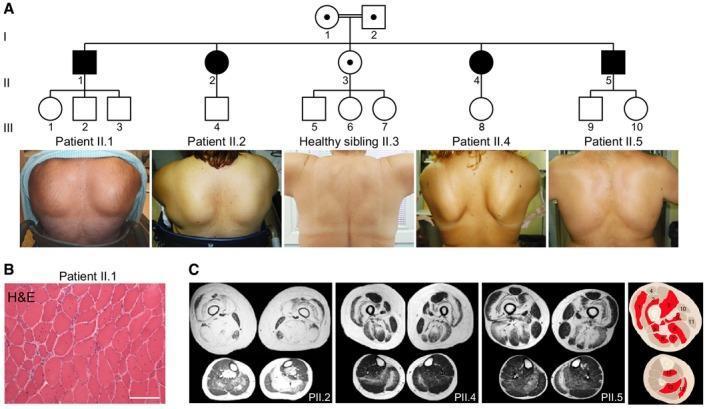
Educational panel illustrating the clinical, genetic, and radiological features of Limb-Girdle Muscular Dystrophy (LGMD) caused by a POGLUT1 mutation. Panel A presents a family pedigree indicating autosomal recessive inheritance, alongside clinical photographs showing bilateral scapular winging and muscular atrophy in affected siblings compared to a healthy control. Panel B displays a high-magnification Hematoxylin and Eosin (H&E) stained skeletal muscle biopsy from an affected patient, demonstrating a moderate-to-severe dystrophic pattern characterized by fiber size variability, rounded fibers, and increased connective tissue (scale bar: 50 ̀̀m). Panel C shows T1-weighted axial MRI sections of the thigh and calf from three patients. The images reveal progressive fatty degeneration with a characteristic 'inside-to-outside' distribution, where internal muscle regions show high signal intensity (fatty replacement) while external borders are relatively spared. Notable patterns include the sparing of the rectus femoris, sartorius, and gracilis in the thigh, and diffuse involvement of the soleus in the calf. This visual summary correlates genetic pedigree with phenotypic manifestations and diagnostic imaging in neuromuscular disease.
Muscular Dystrophy
Classification
| Type | Inheritance | Gene / Locus | Key Feature |
|---|---|---|---|
| Duchenne (DMD) | X-linked recessive | DMD (Xp21.2) - dystrophin | Most common, severe |
| Becker (BMD) | X-linked recessive | DMD (Xp21.2) - dystrophin | Milder allelic variant |
| Emery-Dreifuss | X-linked / AD/AR | EMD (emerin), LMNA | Early contractures + cardiac |
| Limb-Girdle (LGMD) | AR (most) / AD | Multiple (sarcoglycans, dysferlin, calpain-3, etc.) | Proximal weakness |
| Facioscapulohumeral (FSHD) | Autosomal dominant | D4Z4 repeat (4q35) | Face, shoulder, humeral |
| Myotonic dystrophy (DM1/DM2) | Autosomal dominant | DMPK (19q) / ZNF9 (3q) | Myotonia + multisystem |
| Oculopharyngeal (OPMD) | Autosomal dominant | PABPN1 | Ptosis + dysphagia |
| Congenital MD (CMD) | AR | Multiple (LAMA2, collagen VI, etc.) | Onset at birth |
1. Duchenne Muscular Dystrophy (DMD)
Epidemiology & Genetics
- Most common inherited muscle disease; incidence ~1 in 3,500-5,000 live male births
- X-linked recessive; ~1/3 of cases are de novo mutations (no family history)
- Gene: DMD at Xp21.2, encoding dystrophin (400 kDa), one of the largest genes known (2.4 million bp, 79 exons)
- Frameshift mutations -> complete absence of dystrophin -> disruption of the sarcomere-sarcolemma mechanical link -> calcium leak -> muscle fiber necrosis
Clinical Features
- Normal or near-normal early milestones, but motor delays become evident between ages 2-5 years
- Toe walking, frequent falls, difficulty running, waddling gait
- Gowers' sign: child uses hands to push off thighs to stand (proximal weakness)
- Pseudohypertrophy of calves (fat and connective tissue replacement)
- Progressive weakness: initially lower limbs -> loss of ambulation typically at 10-15 years
- Scoliosis, joint contractures, kyphoscoliosis -> respiratory compromise
- Dilated cardiomyopathy (DCM): cardiac fibrosis, conduction abnormalities -> congestive heart failure
- Cognitive involvement: lower IQ, learning disorders, ADHD, autism (non-progressive)
- Death from cardiorespiratory failure (primary cause)
Investigations
- Serum CK: 20-100x elevated (can screen from newborn dried blood spots)
- Genetic testing: DNA analysis of dystrophin gene (positive in 90-95%); multiplex PCR detects ~98% of deletions
- Muscle biopsy (if genetic testing negative): fiber size variation, necrosis, inflammation, fibrosis, regenerating fibers; immunohistochemistry shows absent dystrophin
- EMG: myopathic pattern
Treatment
- Glucocorticoids: Prednisone 0.75 mg/kg/day or deflazacort 0.9 mg/kg/day - prolong ambulation, improve muscle strength; deflazacort causes less weight gain
- Exon-skipping antisense oligomers (FDA conditionally approved):
- Eteplirsen (exon 51 skipping) - 30 mg/kg IV weekly
- Golodirsen (exon 53 skipping) - 30 mg/kg IV weekly
- Viltolarsen (exon 53 skipping) - 80 mg/kg IV weekly
- Casimersen (exon 45 skipping) - 30 mg/kg IV weekly
- Cardiac: ACE inhibitors (slow myocardial fibrosis progression), beta-blockers, diuretics
- Noninvasive ventilation for respiratory insufficiency
- Multidisciplinary team: neurology, cardiology, pulmonology, orthopedics, physio, OT, speech, nutrition, psychosocial
- Physical therapy to prevent contractures
- Spinal fusion for significant scoliosis
- Wheelchair provision
2. Becker Muscular Dystrophy (BMD)
- Milder allelic variant of DMD; in-frame mutation in the dystrophin gene (frame preserved -> truncated but partially functional dystrophin)
- Onset: boys >5 years, teenagers, or even adults
- Features: symmetrical proximal weakness, prominent calf hypertrophy
- Heart failure may be the initial or dominant manifestation in some
- CK elevated (but typically less than DMD)
- Muscle biopsy: decreased (not absent) dystrophin on immunostaining; abnormal molecular weight on Western blot
- Management: largely supportive; corticosteroids rarely used
- Prognosis: many have normal lifespan, though some develop late respiratory/cardiac failure; heart transplantation performed in severe cardiomyopathy
3. Facioscapulohumeral Muscular Dystrophy (FSHD)
- 3rd most common dystrophy after dystrophinopathies and myotonic MD; prevalence ~1 in 15,000
- Autosomal dominant, variable penetrance
- Genetics: ~95% have truncated D4Z4 tandem repeat region on chromosome 4q35; ~5% have hypomethylation of D4Z4 + SMCHD1 mutation
- Clinical: begins with facial weakness (difficulty smiling/whistling) -> scapular, humeral, truncal, lower limb weakness -> footdrop; scapular winging is characteristic; often asymmetrical
- Associated features: high-frequency hearing loss, retinal telangiectasia (rarely -> retinal detachment)
- CK: normal to mildly elevated
- Treatment: supportive - physiotherapy, ankle-foot orthoses, hearing aids, scapular fixation surgery to improve shoulder range of motion
- Corticosteroids: no benefit
- Prognosis: highly variable; many have normal lifespan
4. Myotonic Dystrophy (DM1 and DM2)
- 2nd most common inherited muscle disease; affects ~1 in 8,000
- Autosomal dominant, multisystem disease
- DM1: CTG trinucleotide repeat expansion in 3' UTR of the DMPK gene on chromosome 19q; anticipation (repeat expands with each generation)
- DM2: CCTG repeat expansion in intron 1 of ZNF9 gene on chromosome 3q; milder course
Clinical Features
- Characteristic face: frontal balding, ptosis, temporal and masseter muscle wasting, nasal speech
- Myotonia: delayed muscle relaxation - grip myotonia, percussion myotonia, lid lag
- DM1 weakness: distal (facial, oropharyngeal, forearm flexors, foot dorsiflexors) -> high-steppage gait
- DM2 weakness: predominantly proximal (deep finger flexors also affected); more pain and stiffness
- Systemic features: premature subcapsular lens cataracts, testicular atrophy, intellectual disability, impotence, hypersomnolence
- Endocrine: diabetes mellitus, thyroid abnormalities
- GI: dysphagia, constipation
- Cardiac: progressive conduction defects -> sudden death
- Congenital DM1 (maternal transmission): severe hypotonia at birth, respiratory failure, developmental delay
Diagnosis
- Largely clinical (pathognomonic facial appearance)
- CK: normal to mildly elevated
- EMG: myopathic features + myotonic discharges
- Molecular genetic analysis: confirmation of nucleotide repeat expansion
Treatment
- Annual ECG + Holter monitor; echocardiogram at diagnosis then every 2-4 years
- Respiratory function testing every 2-4 years; sleep study for nocturnal hypoventilation
- Mexiletine (150-200 mg three times daily): improves muscle relaxation (myotonia)
- Pacemaker/ICD for conduction defects
- Anesthetic precaution: sensitivity to respiratory depressants; prefer regional anesthesia in pregnancy
5. Emery-Dreifuss Muscular Dystrophy (EDMD)
- Classic triad: (1) early-onset joint contractures (elbows, Achilles tendons), (2) progressive humero-peroneal muscle weakness, (3) cardiac conduction defects (heart block -> sudden death)
- X-linked form caused by absent emerin protein; AD/AR forms caused by LMNA mutations (lamin A/C)
- Cardiac risk is high; pacemaker/ICD often required
6. Limb-Girdle Muscular Dystrophy (LGMD)
- Heterogeneous group; most autosomal recessive, some dominant
- Mutations in multiple proteins: sarcoglycans (alpha, beta, gamma, delta), dysferlin, calpain-3, titin, and many others
- Feature: symmetrical proximal weakness (shoulder and pelvic girdle); spares face
- MRI shows characteristic patterns of muscle involvement with fatty replacement (often sparing rectus femoris, sartorius, gracilis)
- Management: supportive; cardiac and respiratory monitoring
Histopathology (General Features)
- Variation in fiber size (both hypertrophy and atrophy)
- Rounded fibers (loss of polygonal shape)
- Necrosis and phagocytosis
- Regenerating fibers (basophilic with prominent nucleoli)
- Fibrosis (endomysial collagen increase)
- Fatty replacement in advanced disease
- Internal nuclei (>2-3% = abnormal; normal nuclei are peripheral)
Key Differentiating Points
| Feature | DMD | BMD | FSHD | Myotonic DM1 |
|---|---|---|---|---|
| Onset | 2-5 yrs | >5 yrs or adult | Adolescence/adult | Any age |
| Inheritance | XLR | XLR | AD | AD |
| Dystrophin | Absent | Reduced/abnormal | Normal | Normal |
| Myotonia | No | No | No | Yes (pathognomonic) |
| Calf hypertrophy | Yes | Yes | No | No |
| Cardiomyopathy | DCM | DCM (prominent) | Rare | Conduction defects |
| CK | >10x elevated | Elevated | Normal-mildly elevated | Normal-mildly elevated |
| Prognosis | Fatal (2nd-3rd decade) | Variable (near-normal possible) | Normal lifespan (variable) | Variable |
Emerging Therapies
- Gene therapy (AAV-delivered micro-dystrophin)
- Gene editing (CRISPR-Cas9 to restore reading frame)
- Stop codon readthrough (ataluren for nonsense mutations, used in Europe)
- Utrophin upregulation (ezutromid)
- Myostatin inhibition to preserve muscle mass