
Types of viral fever
viral fever types classification dengue influenza
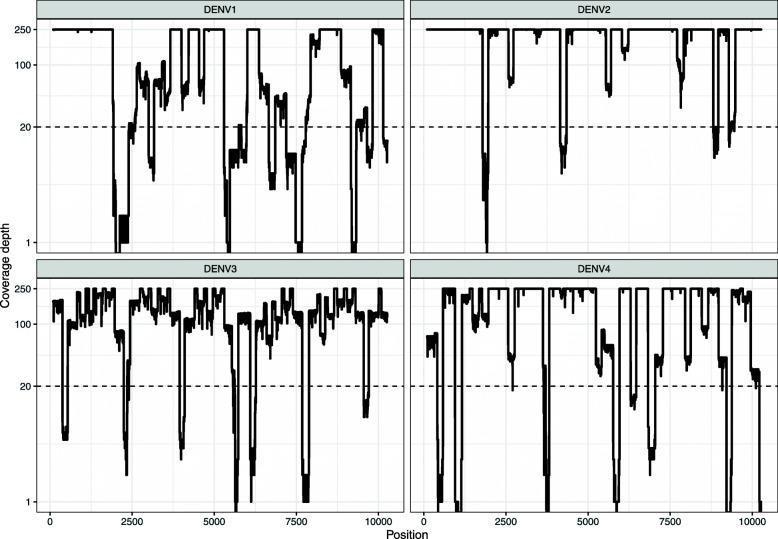
This figure presents a multi-panel comparison chart showing the Nanopore sequencing coverage depth for four Dengue virus serotypes (DENV1, DENV2, DENV3, and DENV4) isolated from clinical samples. Each panel plots the coverage depth (log scale, capped at 250X) on the y-axis against the genome position (0 to approximately 10,000 nucleotides) on the x-axis. A horizontal dashed line indicates a critical quality threshold of 20X read depth. The visualizations illustrate variability in amplification efficiency across the viral genomes using a multiplex PCR approach. DENV1 exhibits significant coverage fluctuations with multiple regions falling below the 20X threshold, particularly in the initial and middle segments. DENV2 and DENV4 show generally high coverage punctuated by sharp, localized drops (valleys) at specific genomic positions, such as near 2500, 5000, and 7500. DENV3 displays more consistent coverage overall but with frequent smaller oscillations. These profiles are essential for evaluating the accuracy of consensus sequences and identifying regions prone to sequencing gaps in clinical diagnostic and genomic surveillance workflows for Dengue fever.
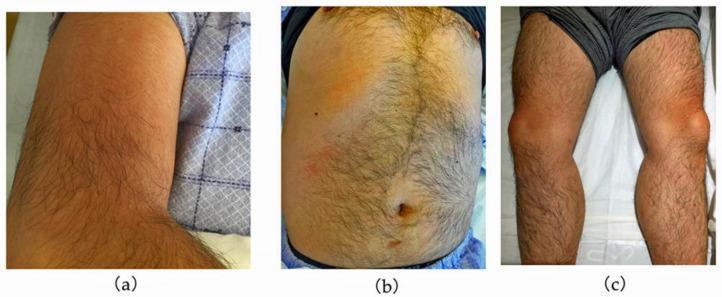
A series of three clinical photographs demonstrating cutaneous manifestations in a patient with dengue fever. (a) Right upper arm showing confluent, blanchable erythema with a diffuse distribution. (b) Anterior trunk (abdomen and chest) displaying a patchy, mottled erythematous rash interspersed with areas of normal skin tone, characteristic of the 'islands of white in a sea of red' pattern often seen in viral exanthems. (c) Lower limbs showing localized, more intense erythema focused around the knees and pretibial regions. The visual findings illustrate the secondary maculopapular rash typical of the recovery or late febrile phase of dengue virus infection. These images serve as an educational resource for identifying the clinical presentation of viral hemorrhagic fever rashes and their variable morphology across different anatomical regions, including the trunk, extremities, and periarticular areas.
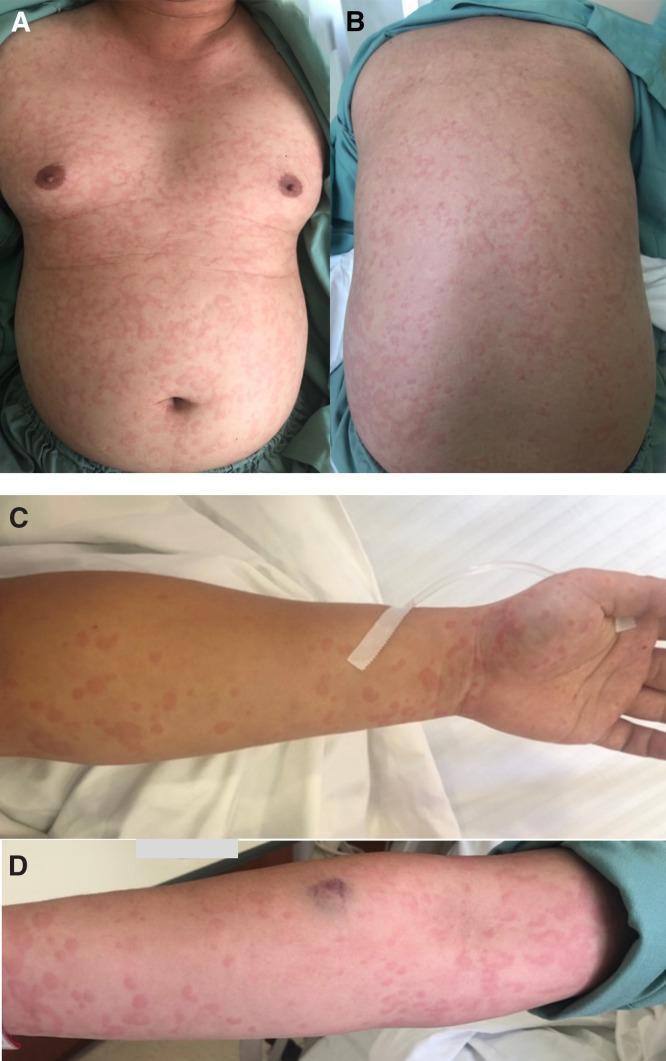
Clinical photograph series showing skin manifestations of dengue fever in a 25-year-old male. Panels A and B display the anterior (chest/abdomen) and posterior (back) trunk, revealing a generalized, pruritic eruption. The rash is characterized by erythematous wheals that are partially confluent, creating a map-like or mottled appearance with areas of normal skin interspersed. Panels C and D show similar lesions on the upper extremities, demonstrating raised, irregularly shaped, pink-to-red wheals across the forearms and wrists. A singular ecchymosis (bruise) is visible on the distal forearm in panel D. The morphology is consistent with urticarial-like lesions frequently observed in the early stages of viral exanthems. The images serve as an educational reference for recognizing atypical dermatological presentations of dengue virus infection, distinguishing them from classic petechial rashes.
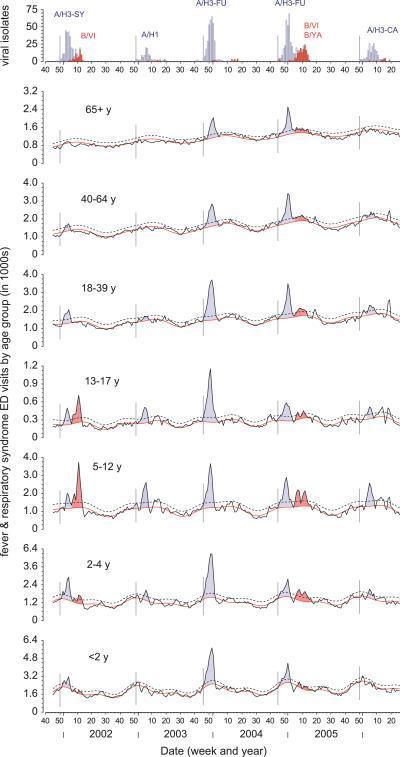
This medical surveillance infographic presents a series of vertically stacked line graphs analyzing weekly fever and respiratory syndrome emergency department (ED) visits in New York City from 2001 to 2006. The top panel displays viral isolate counts for influenza A (blue) and B (red), identifying specific strains like A/H3-SY, A/H1, and A/H3-FU. Below this, seven graphs represent age-stratified data: ≥65y, 40-64y, 18-39y, 13-17y, 5-12y, 2-4y, and <2y. Each age-specific graph plots observed ED visits (black line) against a red Serfling baseline representing seasonally expected visits. Dashed lines indicate model estimates plus two standard deviations. Shaded blue and red areas denote influenza-attributable excess ED visits for types A and B, respectively. The data illustrates epidemiological trends, such as the high pediatric burden during the 2003-2004 influenza A/H3N2 (Fujian) season and the age-specific impact of the influenza B/Victoria-lineage on children. This chart serves as a public health tool for understanding age-related morbidity patterns and the temporal relationship between viral circulation and healthcare utilization.