
Explain prepotential of sa node according to guyton
Reading File
The SA node prepotential (pacemaker potential) is a slow spontaneous depolarization that drives the heart's natural rhythm. It involves three ion currents: a funny current (If) that brings Na+ in, a declining K+ outward current, and a T-type Ca2+ current that triggers the upstroke.
Searching sources...
Finding Sources
Finding Sources
Finding Sources
Finding Sources
Now let me search specifically for Guyton's content on SA node prepotential:
Finding Sources
Finding Sources
Finding Sources
Finding Sources
Finding Sources
Finding Sources
Reading File
I now have excellent content. Let me also fetch the pacemaker potential diagram for a visual aid.
Loading Image
Reading File
I now have comprehensive content. Let me also fetch the autonomic modulation diagram.
Loading Image
I have everything needed. Here is a full explanation of the SA node prepotential according to Guyton (and supplemented by Ganong, which uses the same Guyton-derived framework).
Prepotential (Pacemaker Potential) of the SA Node
The SA node is the dominant pacemaker of the heart because its cells are self-excitatory - they never truly rest at a stable membrane potential. Instead, after each action potential, the membrane drifts slowly toward threshold on its own. This slow, spontaneous drift is called the prepotential or pacemaker potential (Phase 4 spontaneous depolarization).
The Pacemaker Potential vs. Ventricular Action Potential
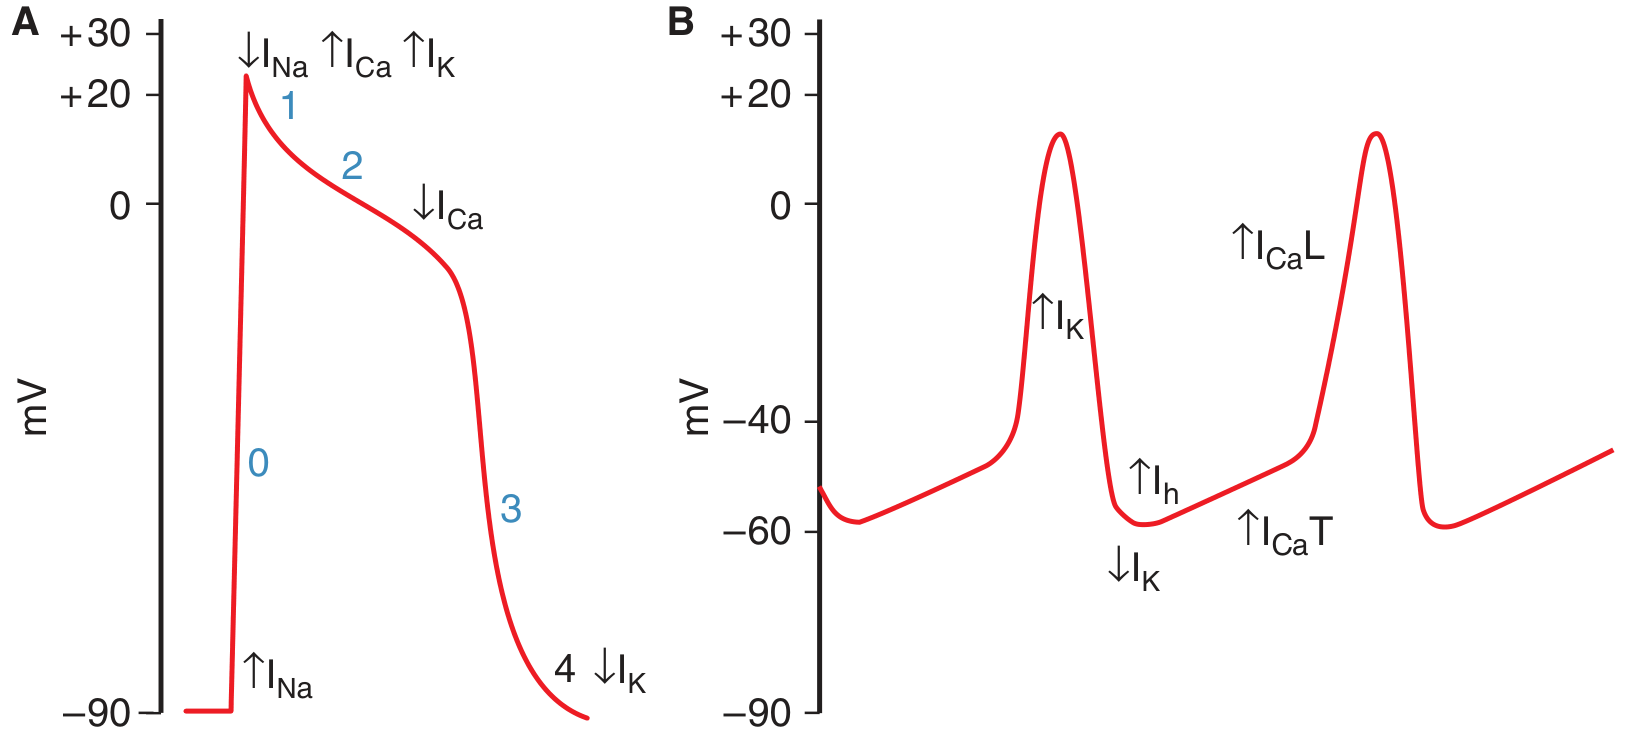
Panel A shows the ventricular myocyte with a stable resting potential (phase 4 flat at ~-90 mV). Panel B shows the SA node - note the characteristic slow upward drift between beats (the prepotential), and that the resting potential only reaches about -60 mV.
Key differences from ventricular cells:
- Maximum diastolic potential is only about -55 to -60 mV (ventricular is -90 mV)
- No stable phase 4 - the membrane continuously drifts upward
- No rapid Na+ spike - the action potential upstroke is entirely Ca2+-dependent
Ionic Basis of the Prepotential - Three Sequential Events
1. Decline of IK (Repolarizing K+ current decreases)
At the peak of the action potential, the outward K+ current (I_K) activates and drives repolarization back toward -60 mV. As the cell repolarizes, I_K progressively declines - this is the initiating event. The reduction in outward K+ current tips the balance toward net depolarization.
2. Activation of the "Funny Current" I_h (or I_f)
As I_K falls and the membrane becomes more negative (hyperpolarized), a special channel opens that is activated by hyperpolarization - the opposite of most voltage-gated channels. This channel is permeable to both Na+ and K+, but because Na+ has a large inward electrochemical gradient, the net effect is an inward depolarizing current.
- Called the "h" channel (activated by hyperpolarization) or "f" channel (because of its funny activation)
- The current it carries = I_h or If (funny current)
- This is responsible for the first, slow part of the prepotential
3. T-type Ca2+ channels open (ICa-T)
As the prepotential reaches approximately -50 mV, voltage-gated T-type (Transient) Ca2+ channels open. The inward Ca2+ current (I_Ca-T) causes a further, steeper depolarization that completes the prepotential and brings the membrane to threshold.
4. L-type Ca2+ channels fire the action potential
Once threshold is crossed (~-40 mV), L-type (Long-lasting) Ca2+ channels open and generate the full action potential upstroke. There is no Na+ contribution to the SA node action potential - unlike ventricular cells, SA node cells lack fast Na+ channels (or have very few). This is why the upstroke is slower and there is no sharp spike.
Note: Evidence also exists that Ca2+ sparks (local Ca2+ release from the sarcoplasmic reticulum) contribute to the prepotential - a "calcium clock" mechanism that works alongside the membrane clock described above.
Summary Table
| Phase | Event | Current | Direction |
|---|---|---|---|
| End of AP | K+ channels open, repolarization occurs | I_K ↑ | Outward |
| Early prepotential | I_K declines, funny channels open | I_K ↓, I_h ↑ | Inward Na+/K+ |
| Late prepotential | T-type Ca2+ channels open | I_Ca-T ↑ | Inward Ca2+ |
| Action potential upstroke | L-type Ca2+ channels open | I_Ca-L ↑ | Inward Ca2+ |
Autonomic Modulation of the Prepotential
The slope of the prepotential determines how quickly threshold is reached, and thus heart rate.
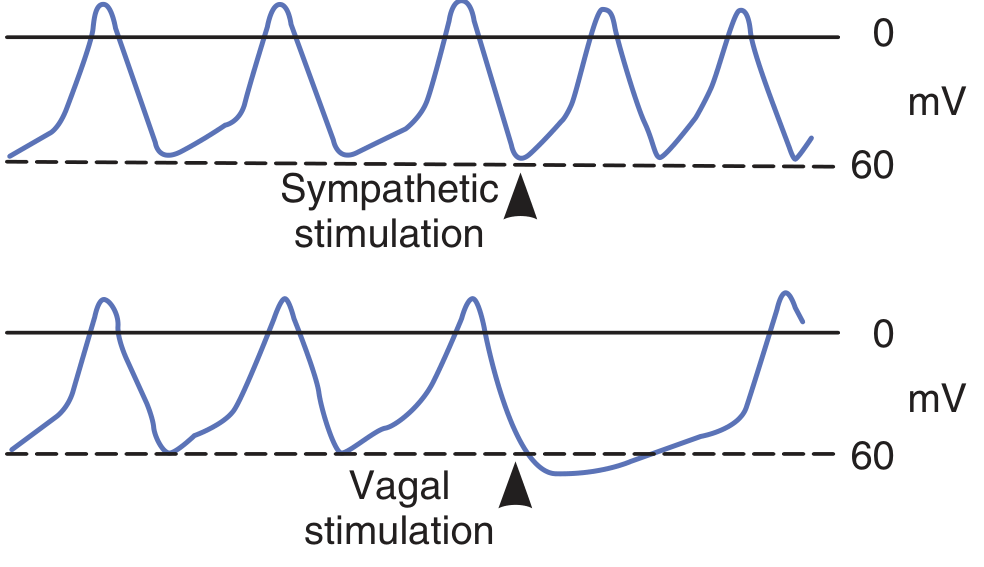
Sympathetic stimulation (norepinephrine → β1 receptors):
- Increases intracellular cAMP
- cAMP facilitates opening of L-type Ca2+ channels
- The slope of the prepotential steepens → threshold reached faster → heart rate increases (tachycardia)
Vagal stimulation (acetylcholine → muscarinic receptors):
- Opens K+ channels (I_K-ACh)
- Membrane hyperpolarizes further (maximum diastolic potential more negative)
- Reduces the slope of the prepotential and slows I_h
- Threshold is reached more slowly → heart rate decreases (bradycardia)
- Strong vagal stimulation can temporarily stop SA node firing entirely
Temperature: Fever increases the discharge frequency of the SA node, contributing to the tachycardia seen with pyrexia.
Why Only SA and AV Nodes Have Prepotentials
Prepotentials are normally prominent only in the SA and AV nodes. Other portions of the conduction system (bundle of His, Purkinje fibers) have "latent pacemakers" that can generate prepotentials and take over pacing only when SA/AV nodal function is suppressed or blocked. Ordinary atrial and ventricular muscle fibers do not have prepotentials and fire spontaneously only when abnormal or injured.
- Ganong's Review of Medical Physiology, 26th Ed., pp. 522-523
Expalin cardiac output and factor affecting them
Cardiac output (CO) is the volume of blood pumped by each ventricle per minute. CO = Heart Rate × Stroke Volume. Normal CO is about 5 L/min at rest. It is affected by preload, afterload, contractility, and heart rate.
Searching sources...
Finding Sources
Finding Sources
Reading File
Reading File
Reading File
Reading File
Reading File
Finding Sources
Reading File
Finding Sources
Loading Image
Reading File
Loading Image
I now have comprehensive Guyton content. Here is the complete explanation:
Cardiac Output and Factors Affecting It
Definition
Cardiac output (CO) is the quantity of blood pumped into the aorta by the heart each minute. It is also the total quantity of blood flowing through the entire circulation per minute.
"Cardiac output is the quantity of blood pumped into the aorta each minute by the heart. This is also the quantity of blood that flows through the circulation."
- Guyton and Hall Textbook of Medical Physiology
The Basic Formula
$$\text{Cardiac Output} = \text{Stroke Volume} \times \text{Heart Rate}$$
| Parameter | Definition | Normal value |
|---|---|---|
| Cardiac Output (CO) | Volume pumped per minute | ~5 L/min |
| Stroke Volume (SV) | Volume ejected per beat | ~70 mL |
| Heart Rate (HR) | Beats per minute | ~72 bpm |
| Cardiac Index | CO per m² body surface area | ~3 L/min/m² |
Ejection Fraction = Stroke Volume / End-Diastolic Volume (normal ~50-70%)
- A 70 kg adult male has ~5.6 L/min; women are ~15% lower
- The cardiac index (CO per m² BSA) corrects for body size
- Cardiac index peaks at about 4 L/min/m² around age 10, and falls to ~2.4 L/min/m² by age 80
The Cardiac Output Curve (Guyton)
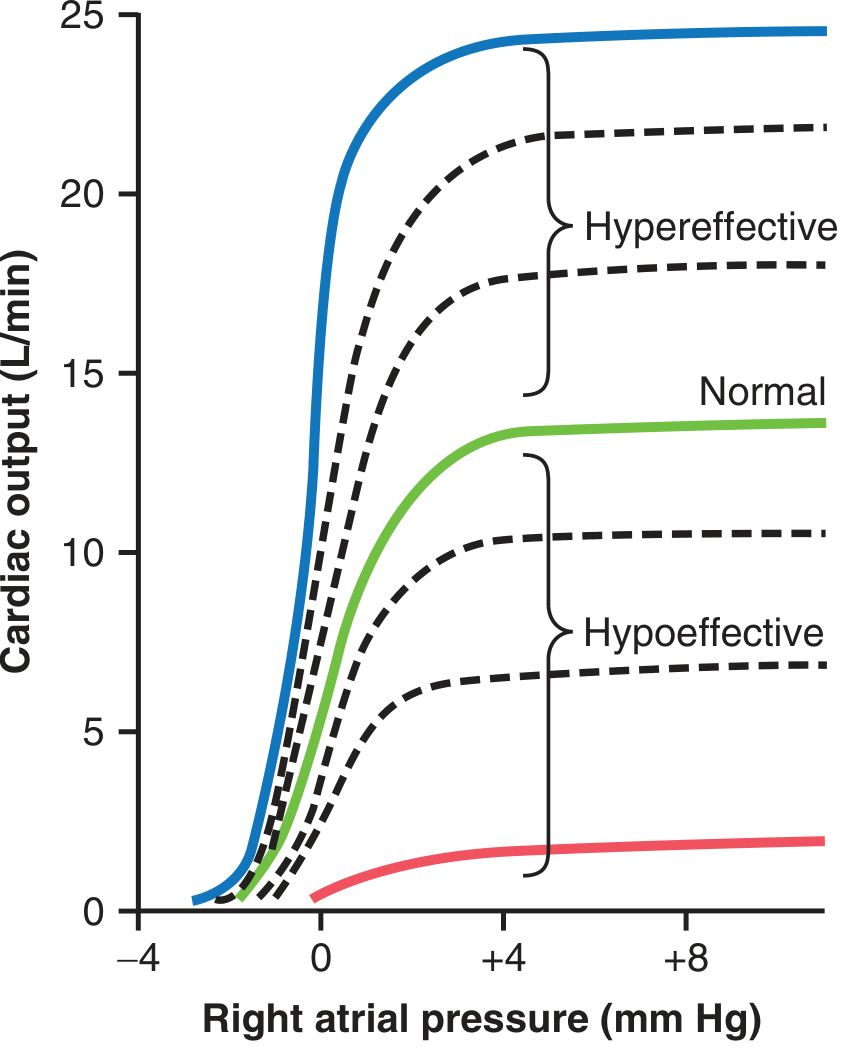
This is the cornerstone Guyton diagram. The plateau of the normal curve is about 13 L/min - meaning the unstimulated heart can pump up to 2.5 times normal venous return before it becomes the limiting factor. With maximal sympathetic stimulation (hypereffective), CO can reach 25 L/min or more.
Factors Affecting Cardiac Output
Guyton organizes the factors into two major categories:
1. Factors Affecting Stroke Volume
Stroke volume is determined by three variables:
A. Preload (Frank-Starling Mechanism)
- Preload = End-diastolic volume (EDV); the degree of stretch of ventricular muscle before contraction
- The Frank-Starling law states: the more the ventricle fills during diastole, the more forcefully it contracts and the more blood it ejects
- This is based on the length-tension relationship in cardiac muscle - greater fiber stretch = greater overlap of actin-myosin = more force
- In normal physiology, venous return is the primary determinant of preload and thus the primary controller of cardiac output
- Factors that increase preload (and thus CO): increased blood volume, increased venous tone, body position (lying down), exercise (muscle pump), inspiration
B. Afterload
- Afterload = the resistance the ventricle must overcome to eject blood = largely determined by aortic pressure and total peripheral resistance (TPR)
- As afterload increases, stroke volume decreases (harder to eject)
- As afterload decreases (e.g., vasodilation), stroke volume increases
- Guyton shows a reciprocal relationship between TPR and cardiac output - conditions that chronically decrease TPR (Beriberi, AV fistula, hyperthyroidism, anemia) lead to high cardiac output states
C. Contractility (Inotropy)
- Contractility = the intrinsic strength of contraction independent of preload and afterload
- Agents that increase contractility (positive inotropes) shift the Frank-Starling curve upward - more stroke volume for the same EDV
- Agents that decrease contractility (negative inotropes) shift the curve downward
| Positive inotropes | Negative inotropes |
|---|---|
| Sympathetic stimulation (norepinephrine via β1) | Parasympathetic stimulation |
| Digoxin | Beta blockers |
| Catecholamines (epinephrine) | Calcium channel blockers |
| Increased Ca²⁺ | Heart failure, myocardial ischemia |
| Exercise | Acidosis, hypoxia |
2. Factors Affecting Heart Rate
Heart rate is primarily controlled by the autonomic nervous system acting on the SA node:
| Factor | Effect on HR | Effect on CO |
|---|---|---|
| Sympathetic stimulation | ↑ HR (up to 180-200 bpm) | ↑ CO |
| Parasympathetic (vagal) stimulation | ↓ HR | ↓ CO |
| Fever / raised temperature | ↑ HR | ↑ CO |
| Bainbridge reflex (right atrial stretch) | ↑ HR by 10-15% | ↑ CO |
| Thyroid hormones | ↑ HR | ↑ CO |
| Hypoxia (moderate) | ↑ HR | Variable |
Note: Very high heart rates can actually reduce CO because diastolic filling time shortens, preload falls, and stroke volume drops enough to offset the rate increase.
3. Peripheral Factors (Venous Return)
Guyton emphasizes that under normal conditions, the periphery - not the heart - is the primary controller of cardiac output. The heart acts as a "permissive pump" that automatically accommodates whatever venous return it receives (Frank-Starling).
Venous return is governed by:
- Mean systemic filling pressure (Psf) - the driving pressure from peripheral vessels to right atrium; increased by blood volume expansion
- Resistance to venous return - increased by venous constriction or obstruction
- Right atrial pressure - the back-pressure opposing venous return
Conditions causing high CO (via ↓TPR):
- Beriberi (thiamine deficiency) - inability to use cellular nutrients → compensatory vasodilation → TPR may halve → CO doubles
- AV fistula - blood bypasses capillary resistance → ↓TPR → ↑CO
- Hyperthyroidism - ↑metabolism → vasodilation → CO increases 40-80%
- Anemia - ↓blood viscosity + tissue hypoxia → vasodilation → ↑CO
Conditions causing low CO:
- Myocardial infarction, severe valvular disease, myocarditis, cardiac tamponade, arrhythmias
- Decreased venous return (hemorrhage, dehydration, obstructed venous return)
CO During Exercise
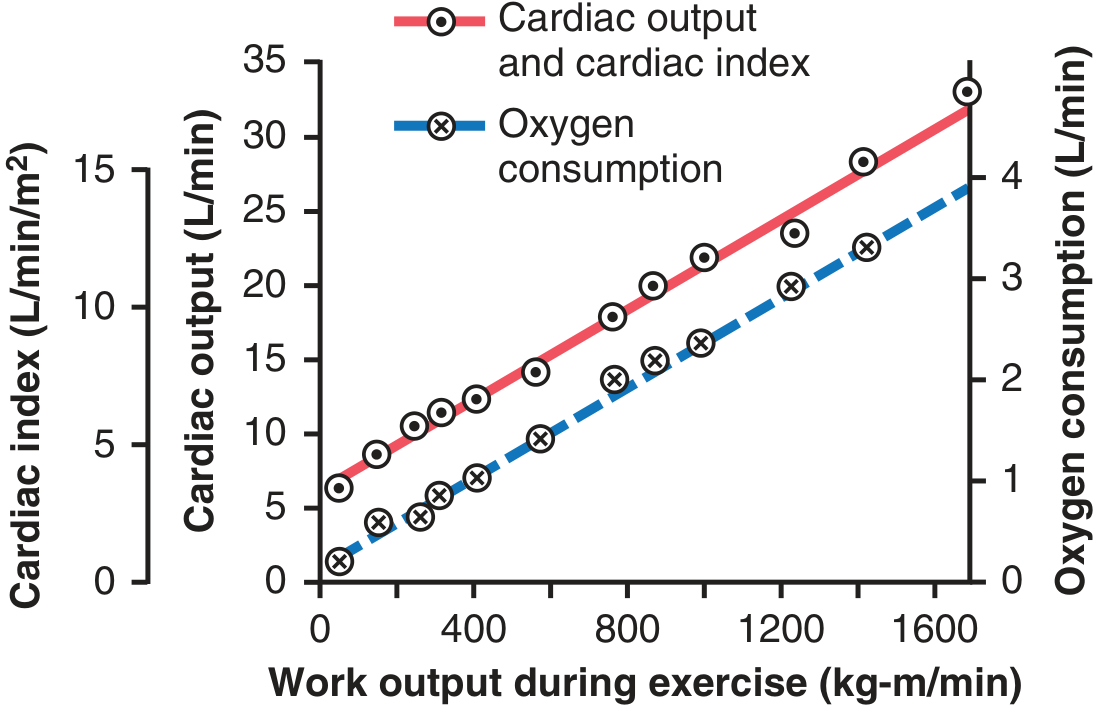
During maximal exercise, CO can rise from 5 L/min to 20-25 L/min (4-5× baseline). This is driven by:
- Marked sympathetic stimulation → ↑HR + ↑contractility
- Skeletal muscle pump → ↑venous return → ↑preload
- Local vasodilation in active muscles → ↓TPR → ↑venous return
- Increased respiratory movements (respiratory pump)
Summary of Factors
Cardiac Output = Stroke Volume × Heart Rate

Stroke Volume is ↑ by:           Heart Rate is ↑ by:
- ↑ Preload (EDV/venous return)   - Sympathetic stimulation
- ↓ Afterload (↓TPR/aortic P)    - Fever
- ↑ Contractility (inotropes)    - Bainbridge reflex
                                  - Thyroid hormones
- Guyton and Hall Textbook of Medical Physiology
- Costanzo Physiology, 7th Edition, pp. 155-157
This is a shared conversation. Sign in to Orris to start your own chat.