Define Blood Pressure. Describe the various Mechanisms involved in maintenance of Blood Pressure (Short, Intermediate & Long Ways)

Reading File
Finding Sources
Finding Sources
Finding Sources
Finding Sources
Reading File
Reading File
Reading File
Reading File
Reading File
Reading File
Reading File
Reading File
Reading File
Searching Images

blood pressure regulation mechanisms baroreceptor reflex diagram
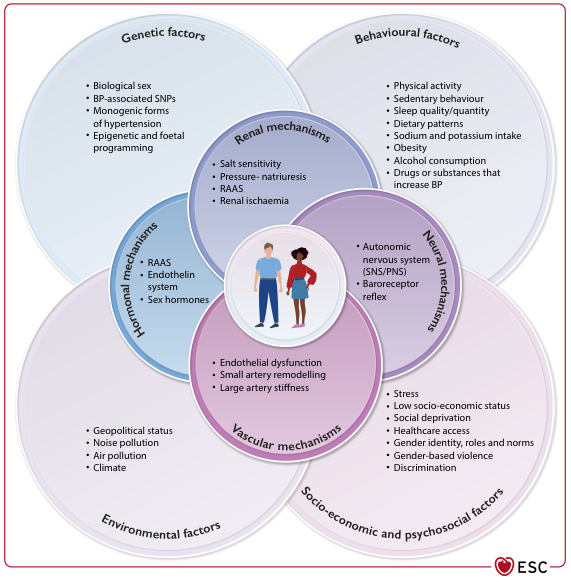
Summary : This figure presents a comprehensive overview of the multifactorial causes and mechanisms underlying blood pressure (BP) elevation and hypertension, organised as overlapping Venn diagrams. It categorises risk factors into genetic, behavioural, environmental, and socio-economic/psychosocial domains, and details the physiological mechanisms (renal, hormonal, neural, vascular) that mediate BP regulation.

venn diagram / conceptual illustration:
# Main Domains :
  • Genetic factors: Biological sex, BP-associated SNPs, monogenic forms of hypertension, epigenetic and foetal programming.
  • Behavioural factors: Physical activity, sedentary behaviour, sleep quality/quantity, dietary patterns, sodium and potassium intake, obesity, alcohol consumption, drugs/substances that increase BP.
  • Environmental factors: Geopolitical status, noise pollution, air pollution, climate.
  • Socio-economic and psychosocial factors: Stress, low socio-economic status, social deprivation, healthcare access, gender identity/roles/norms, gender-based violence, discrimination.

# Physiological Mechanisms (Central Overlapping Circles) :
  ## Renal mechanisms :
    • Salt sensitivity
    • Pressure-natriuresis
    • RAAS (Renin-Angiotensin-Aldosterone System)
    • Renal ischaemia

  ## Hormonal mechanisms :
    • RAAS
    • Endothelin system
    • Sex hormones

  ## Neural mechanisms :
    • Autonomic nervous system (SNS/PNS)
    • Baroreceptor reflex

  ## Vascular mechanisms :
    • Endothelial dysfunction
    • Small artery remodelling
    • Large artery stiffness

# Central Illustration :
  • At the centre, a cartoon of a man and woman symbolises the affected population.

# Design Encodings :
  • Each domain is represented by a large, coloured circle with overlapping regions for mechanisms.
  • Mechanisms are shown as smaller, darker circles overlapping the main domains.
  • Bulleted lists within each circle detail specific factors/mechanisms.
  • ESC logo at bottom right.

# Analysis :
  • The figure visually emphasises that hypertension is a complex, multifactorial condition resulting from the interplay of genetic, behavioural, environmental, and socio-economic/psychosocial factors.
  • Physiological mechanisms (renal, hormonal, neural, vascular) are central and overlap with all domains, indicating their integrative role in BP regulation.
  • The central placement of the affected individuals highlights the human impact and the need for a holistic approach to hypertension prevention and management.
  • No quantitative data or statistical relationships are presented; the figure is conceptual and descriptive.
Summary : This figure presents a comprehensive overview of the multifactorial causes and mechanisms underlying blood pressure (BP) elevation and hypertension, organised as overlapping Venn diagrams. It categorises risk factors into genetic, behavioural, environmental, and socio-economic/psychosocial domains, and details the physiological mechanisms (renal, hormonal, neural, vascular) that mediate BP regulation. venn diagram / conceptual illustration: # Main Domains : • Genetic factors: Biological sex, BP-associated SNPs, monogenic forms of hypertension, epigenetic and foetal programming. • Behavioural factors: Physical activity, sedentary behaviour, sleep quality/quantity, dietary patterns, sodium and potassium intake, obesity, alcohol consumption, drugs/substances that increase BP. • Environmental factors: Geopolitical status, noise pollution, air pollution, climate. • Socio-economic and psychosocial factors: Stress, low socio-economic status, social deprivation, healthcare access, gender identity/roles/norms, gender-based violence, discrimination. # Physiological Mechanisms (Central Overlapping Circles) : ## Renal mechanisms : • Salt sensitivity • Pressure-natriuresis • RAAS (Renin-Angiotensin-Aldosterone System) • Renal ischaemia ## Hormonal mechanisms : • RAAS • Endothelin system • Sex hormones ## Neural mechanisms : • Autonomic nervous system (SNS/PNS) • Baroreceptor reflex ## Vascular mechanisms : • Endothelial dysfunction • Small artery remodelling • Large artery stiffness # Central Illustration : • At the centre, a cartoon of a man and woman symbolises the affected population. # Design Encodings : • Each domain is represented by a large, coloured circle with overlapping regions for mechanisms. • Mechanisms are shown as smaller, darker circles overlapping the main domains. • Bulleted lists within each circle detail specific factors/mechanisms. • ESC logo at bottom right. # Analysis : • The figure visually emphasises that hypertension is a complex, multifactorial condition resulting from the interplay of genetic, behavioural, environmental, and socio-economic/psychosocial factors. • Physiological mechanisms (renal, hormonal, neural, vascular) are central and overlap with all domains, indicating their integrative role in BP regulation. • The central placement of the affected individuals highlights the human impact and the need for a holistic approach to hypertension prevention and management. • No quantitative data or statistical relationships are presented; the figure is conceptual and descriptive.

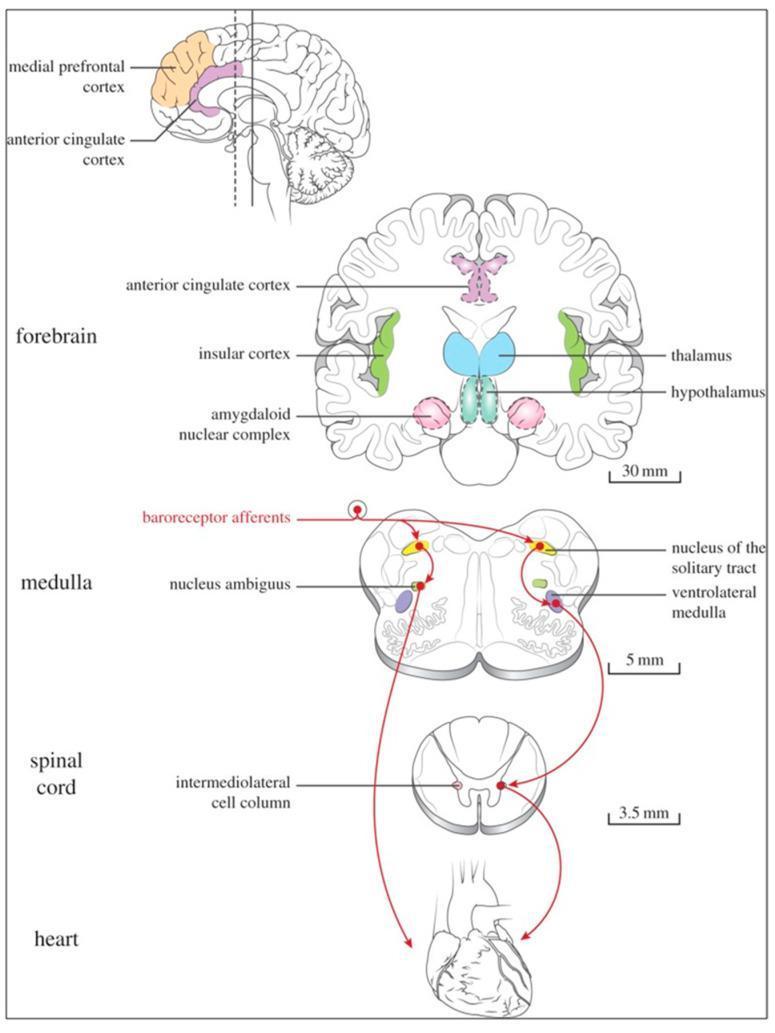
This medical diagram illustrates the central autonomic network and the neural pathways of the brain-heart interaction, specifically highlighting the baroreceptor reflex. The figure is divided into four anatomical levels: heart, spinal cord, medulla, and forebrain. In the forebrain level, a coronal cross-section identifies the anterior cingulate cortex, insular cortex, thalamus, hypothalamus, and the amygdaloid nuclear complex. A sagittal view above it highlights the medial prefrontal cortex and anterior cingulate cortex. The medulla section depicts the nucleus of the solitary tract (NTS), nucleus ambiguus, and ventrolateral medulla. The spinal cord section highlights the intermediolateral cell column. Red arrows trace the baroreceptor reflex pathway: afferent signals originate from the heart, enter the medulla via the NTS, and relay through various brainstem and forebrain nuclei to regulate sympathetic and parasympathetic outflow. This diagram demonstrates the hierarchical organization of homeostatic blood pressure control and the neuroanatomical structures facilitating autonomic regulation in humans.
This medical diagram illustrates the central autonomic network and the neural pathways of the brain-heart interaction, specifically highlighting the baroreceptor reflex. The figure is divided into four anatomical levels: heart, spinal cord, medulla, and forebrain. In the forebrain level, a coronal cross-section identifies the anterior cingulate cortex, insular cortex, thalamus, hypothalamus, and the amygdaloid nuclear complex. A sagittal view above it highlights the medial prefrontal cortex and anterior cingulate cortex. The medulla section depicts the nucleus of the solitary tract (NTS), nucleus ambiguus, and ventrolateral medulla. The spinal cord section highlights the intermediolateral cell column. Red arrows trace the baroreceptor reflex pathway: afferent signals originate from the heart, enter the medulla via the NTS, and relay through various brainstem and forebrain nuclei to regulate sympathetic and parasympathetic outflow. This diagram demonstrates the hierarchical organization of homeostatic blood pressure control and the neuroanatomical structures facilitating autonomic regulation in humans.

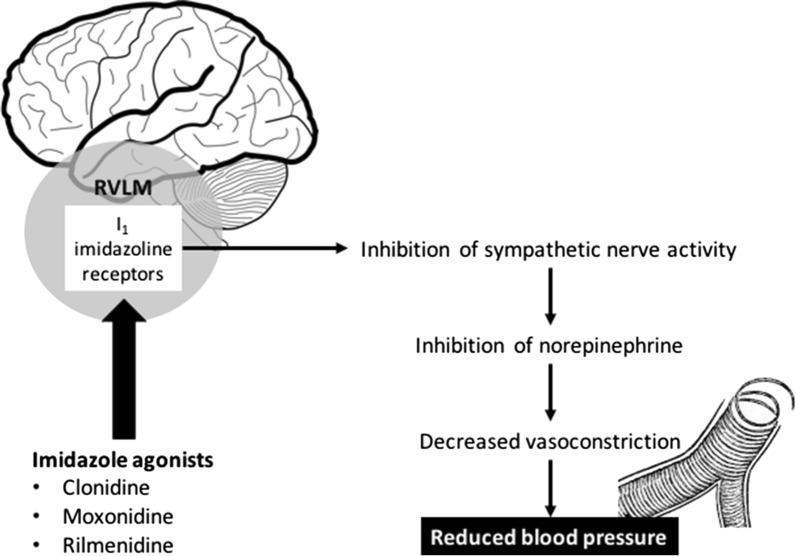
This pathophysiology diagram illustrates the mechanism of action of imidazoline receptor agonists on blood pressure regulation. The visual is divided into a sagittal brain anatomical diagram and a secondary physiological flowchart. On the left, the diagram highlights the 'I1 imidazoline receptors' located within the Rostral Ventrolateral Medulla (RVLM) of the brainstem, situated inferior to the cerebrum and anterior to the cerebellum. Below this, three pharmacological agents—Clonidine, Moxonidine, and Rilmenidine—are listed as imidazole agonists that target these receptors. To the right, a downward flowchart depicts the systemic consequences of receptor activation: stimulation of the RVLM leads to the 'Inhibition of sympathetic nerve activity,' followed by the 'Inhibition of norepinephrine' release. This progression results in 'Decreased vasoconstriction,' visually represented by an illustration of a dilated blood vessel with reduced smooth muscle tension. The final clinical outcome is identified as 'Reduced blood pressure.' The content is designed for intermediate medical education, focusing on neuropharmacology and cardiovascular physiology.

This pathophysiology diagram illustrates the mechanism of action of imidazoline receptor agonists on blood pressure regulation. The visual is divided into a sagittal brain anatomical diagram and a secondary physiological flowchart. On the left, the diagram highlights the 'I1 imidazoline receptors' located within the Rostral Ventrolateral Medulla (RVLM) of the brainstem, situated inferior to the cerebrum and anterior to the cerebellum. Below this, three pharmacological agents—Clonidine, Moxonidine, and Rilmenidine—are listed as imidazole agonists that target these receptors. To the right, a downward flowchart depicts the systemic consequences of receptor activation: stimulation of the RVLM leads to the 'Inhibition of sympathetic nerve activity,' followed by the 'Inhibition of norepinephrine' release. This progression results in 'Decreased vasoconstriction,' visually represented by an illustration of a dilated blood vessel with reduced smooth muscle tension. The final clinical outcome is identified as 'Reduced blood pressure.' The content is designed for intermediate medical education, focusing on neuropharmacology and cardiovascular physiology.

Reading File
Finding Sources
Finding Sources
Reading File
Loading Image
Loading Image
I now have all the material needed. Here is the full, detailed answer:

Blood Pressure: Definition and Mechanisms of Maintenance


Definition of Blood Pressure

Blood pressure is the lateral pressure exerted by the column of blood against the walls of the blood vessels per unit area. It is the force per unit area that blood exerts on the vessel wall, and it is measured in millimeters of mercury (mm Hg).
In clinical terms:
  • Systolic BP - the peak pressure during cardiac contraction (systole); normally ~120 mm Hg.
  • Diastolic BP - the pressure during cardiac relaxation (diastole); normally ~80 mm Hg.
  • Mean Arterial Pressure (MAP) - the average driving pressure throughout the cardiac cycle; approximately 100 mm Hg. It can be calculated as:
MAP = Diastolic BP + 1/3 (Pulse Pressure) or equivalently: MAP = Cardiac Output (CO) x Total Peripheral Resistance (TPR)
This second equation is central to understanding BP regulation: any change in CO or TPR will alter MAP. - Guyton and Hall Textbook of Medical Physiology; Costanzo Physiology 7th Edition, p. 169

Mechanisms of Maintenance of Blood Pressure
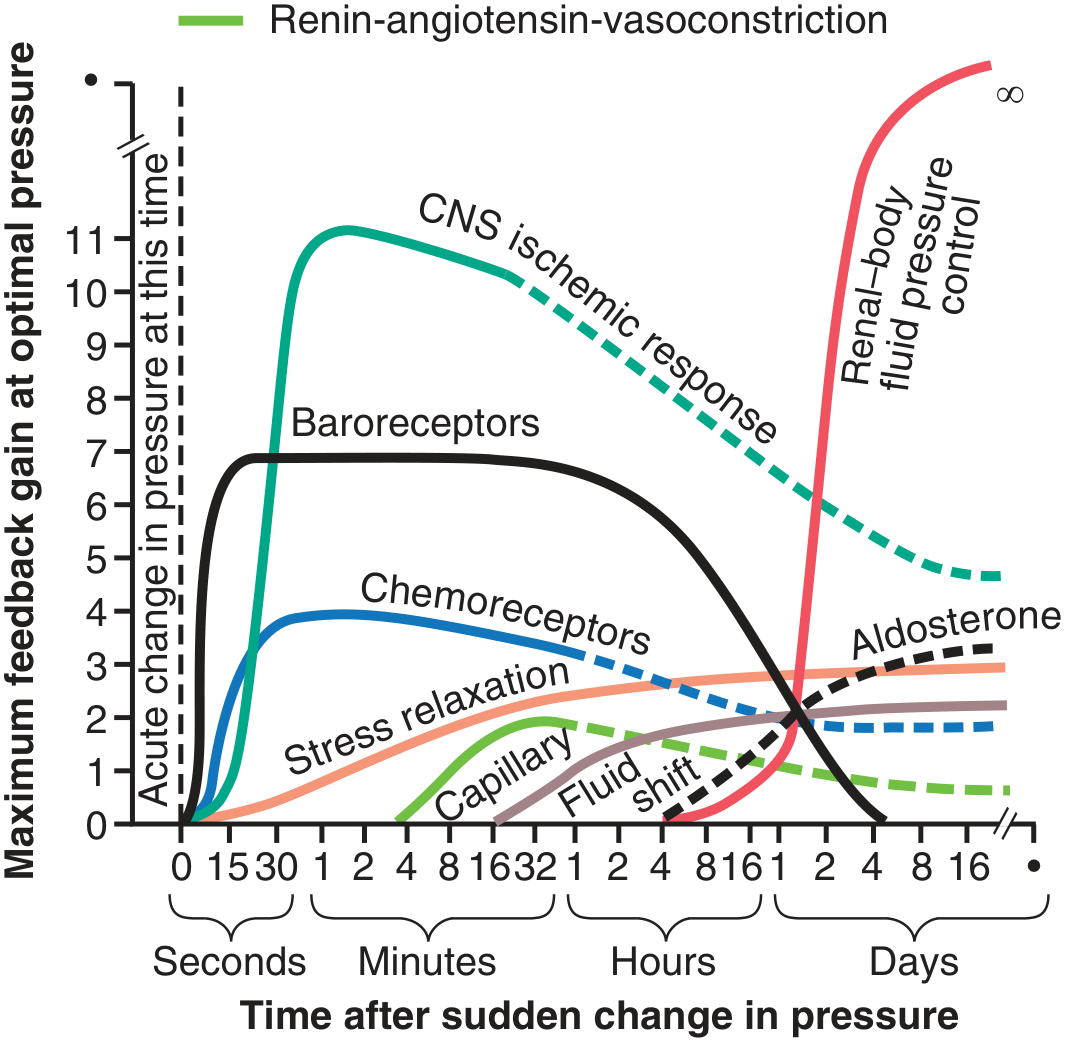
The body regulates arterial pressure through a layered hierarchy of mechanisms that differ in their speed of onset, potency, and duration of action. Classically these are grouped into three temporal categories:
Approximate potency of various arterial pressure control mechanisms at different time intervals - Guyton & Hall
Figure: Feedback gain of each pressure-control mechanism over time. The renal-body fluid system eventually achieves nearly infinite gain. (Guyton & Hall, Fig. 19.16)

A. SHORT-TERM (Rapid) Mechanisms

These act within seconds to a few minutes. They are primarily neural and do not alter blood volume - they act by adjusting cardiac output and peripheral vascular resistance rapidly.

1. Baroreceptor (Pressoreceptor) Reflex

The most important and fastest short-term mechanism.
Sensors: Baroreceptors are mechanoreceptors (stretch receptors) located in:
  • The carotid sinus (wall of internal carotid artery above bifurcation) - sensitive to both increases and decreases in pressure.
  • The aortic arch - primarily sensitive to increases in pressure.
Afferent pathway:
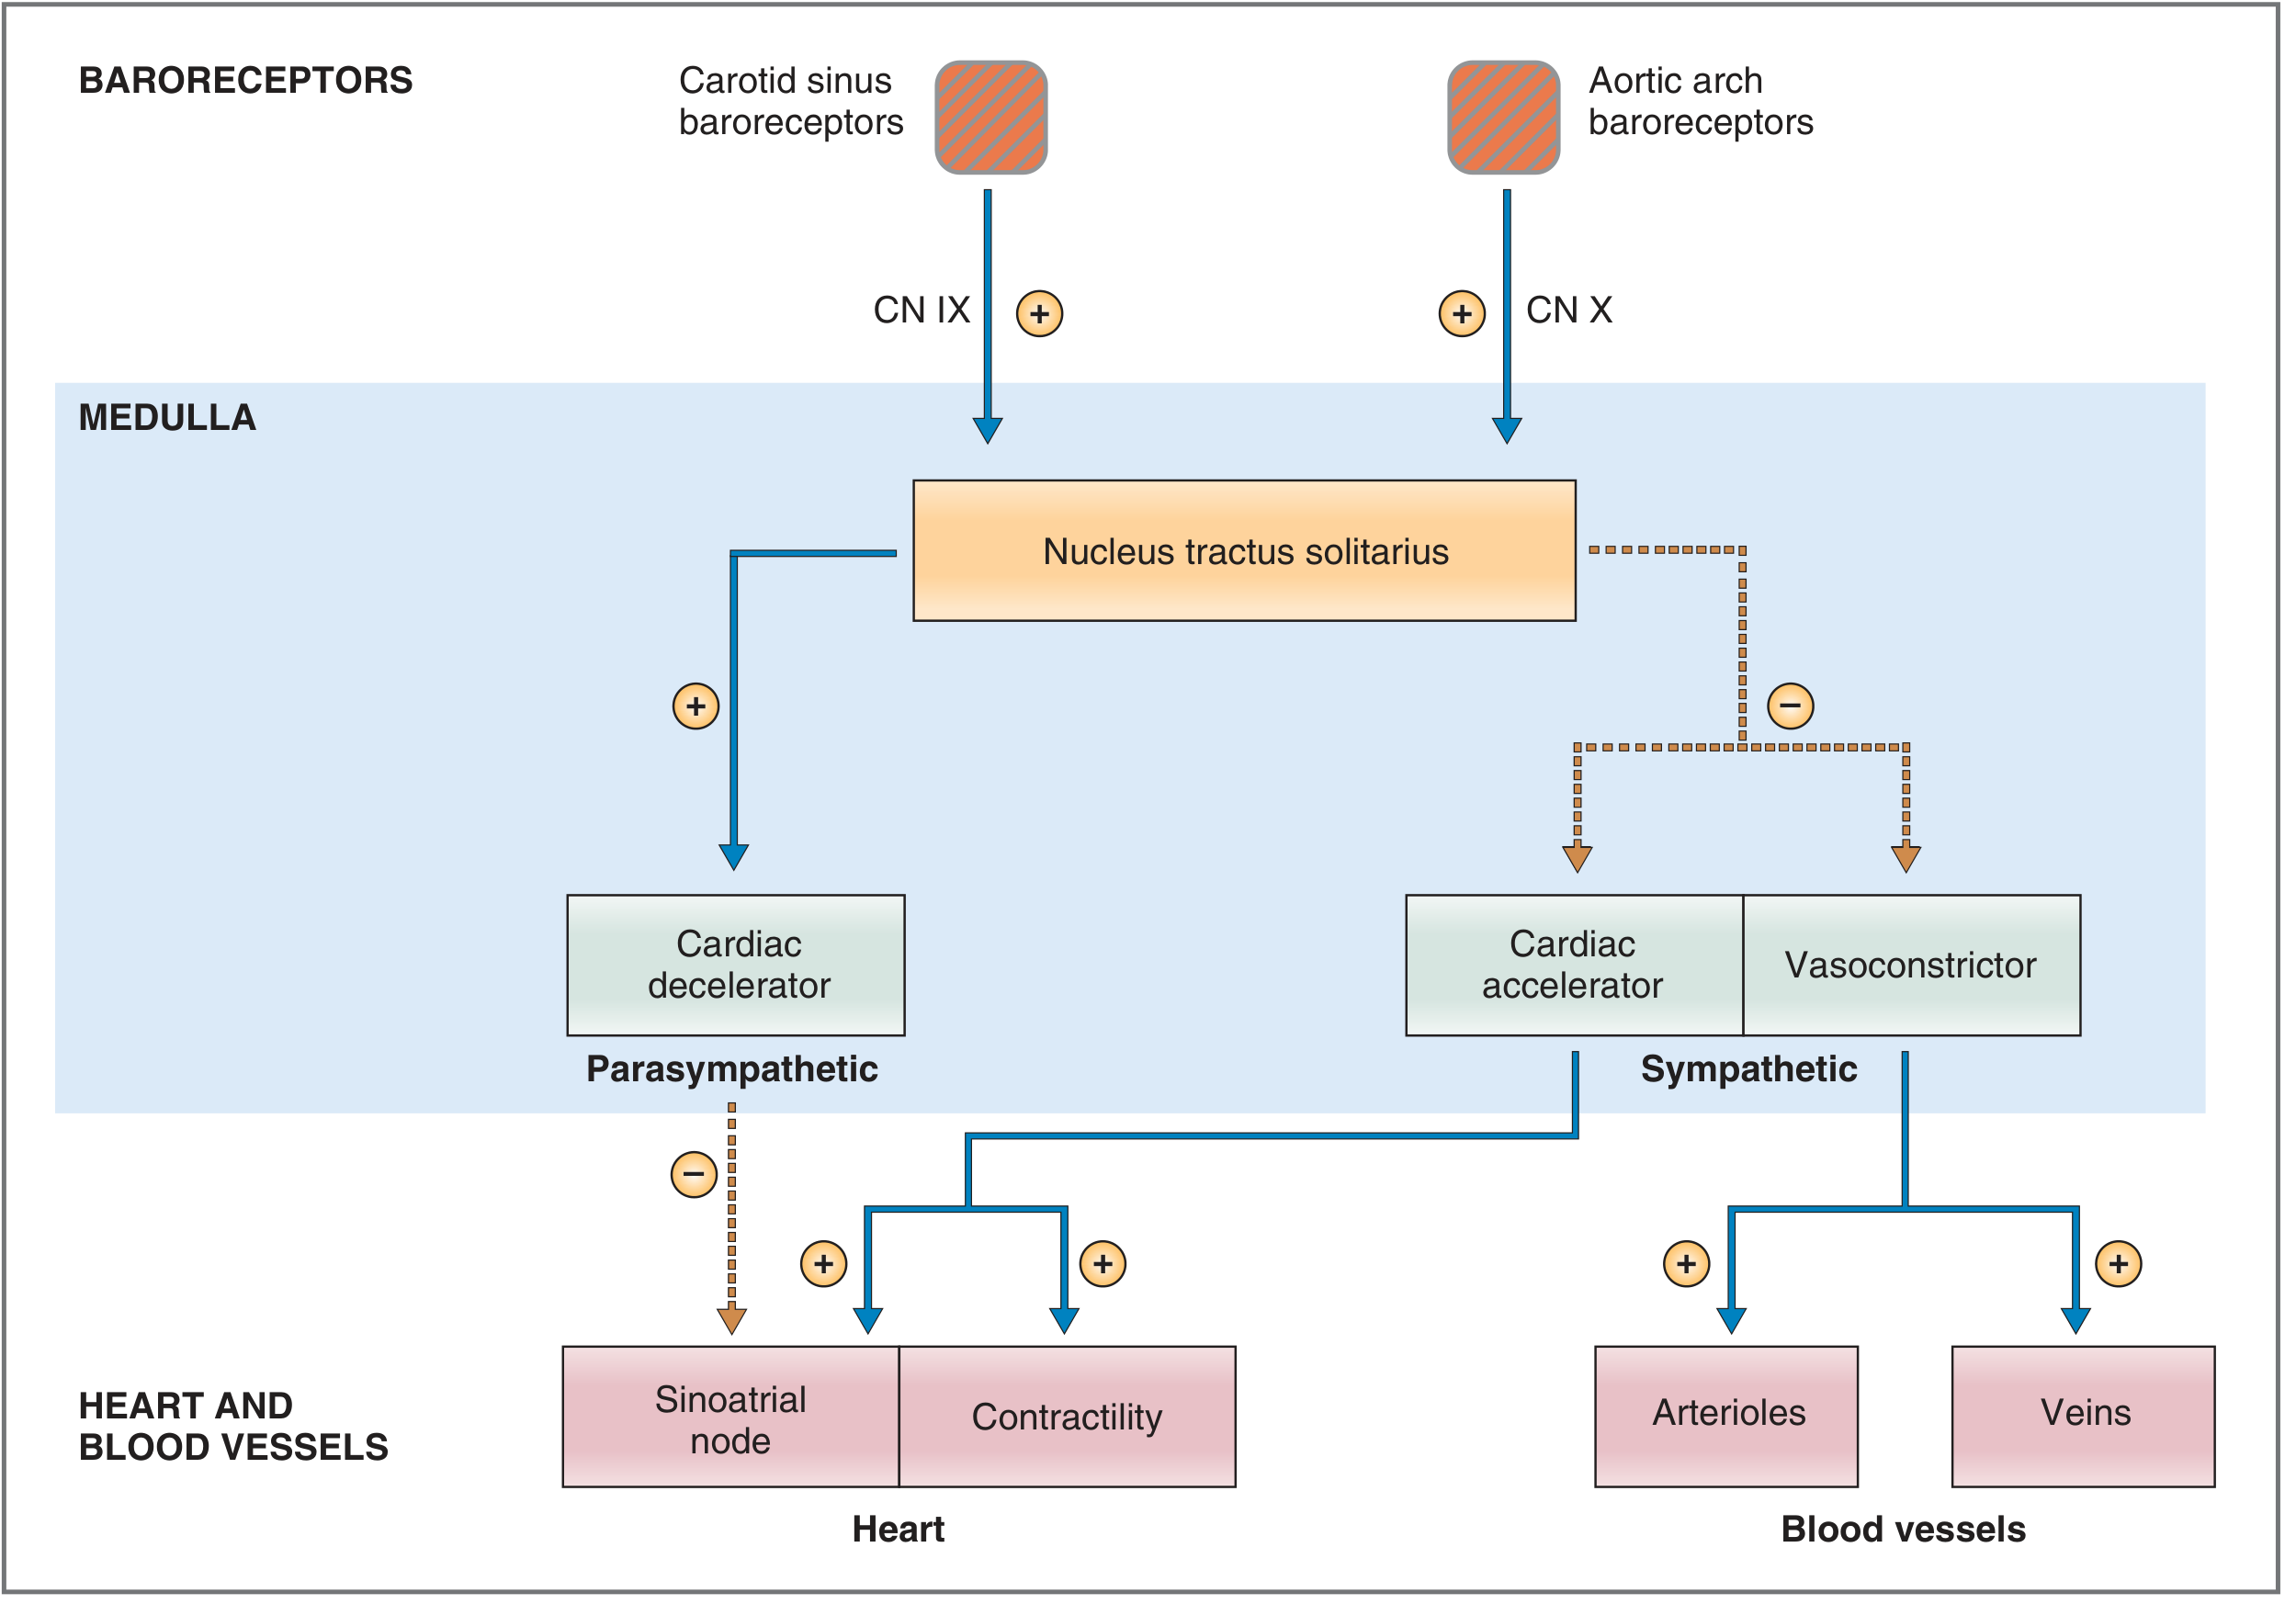
  • Carotid sinus baroreceptors → Carotid sinus nerveGlossopharyngeal nerve (CN IX) → Nucleus Tractus Solitarius (NTS) in the medulla.
  • Aortic arch baroreceptors → Vagus nerve (CN X) → NTS.
Central processing: The NTS coordinates responses through the vasomotor center (medullary cardiovascular centers - cardioinhibitory, cardioacceleratory, and vasoconstrictor areas).
Response when BP rises:
  • Increased baroreceptor firing → NTS activation → Increased parasympathetic (vagal) outflow and decreased sympathetic outflow →
    • Heart rate decreases (bradycardia)
    • Cardiac contractility decreases
    • Arteriolar vasodilation (decreased TPR)
    • Venous dilation (decreased venous return)
    • BP falls back toward normal
Response when BP falls:
  • Decreased baroreceptor firing → Decreased parasympathetic, increased sympathetic outflow →
    • Heart rate increases (tachycardia)
    • Increased contractility (increased CO)
    • Arteriolar vasoconstriction (increased TPR)
    • Venous constriction (increased venous return and CO)
    • BP rises back toward normal
Baroreceptor reflex neural pathway - Costanzo Physiology
Figure: Baroreceptor reflex. Increased arterial pressure → increased baroreceptor firing (CN IX, X) → NTS activation → increased parasympathetic and decreased sympathetic outflow → reduced heart rate, contractility, and vasoconstriction. (Costanzo Physiology)
The baroreceptor reflex begins within seconds and can double arterial pressure within 5-10 seconds, or halve it within 10-40 seconds. - Guyton and Hall, p. 226
Key Note: In chronic hypertension, baroreceptors reset to the new (higher) pressure level and no longer perceive it as abnormal, so hypertension is maintained rather than corrected.

2. Chemoreceptor Reflex

Peripheral chemoreceptors are located in the carotid and aortic bodies (small vascular structures near the carotid bifurcation and aortic arch). They are supplied by a rich blood flow and detect:
  • Decreased PaO₂ (hypoxia)
  • Increased PaCO₂ / increased H⁺ (acidosis)
When arterial pressure falls below ~80 mm Hg, blood flow to these bodies is reduced, causing hypoxia and CO₂ accumulation, which stimulates chemoreceptors. Signals are sent to the vasomotor center → increased sympathetic output → vasoconstriction and raised BP.
The chemoreceptor reflex is not a major controller at normal pressures but becomes important when BP falls below 80 mm Hg. - Guyton and Hall, p. 230

3. CNS Ischemic Response (Last-Ditch Mechanism)

When arterial pressure falls dangerously low (below ~60 mm Hg, maximally stimulated at 15-20 mm Hg), ischemia develops in the vasomotor center itself. Elevated CO₂ and H⁺ within the brain stem cause massive sympathetic vasoconstrictor discharge, raising MAP sometimes to 250 mm Hg. This is called the "last-ditch stand" pressure control mechanism. - Guyton and Hall, p. 231
A variant is the Cushing Reaction: raised intracranial pressure compresses cerebral arteries → brain ischemia → massive sympathetic stimulation → sharp rise in systemic BP. This protects the brain from ischemia.

4. Low-Pressure (Cardiopulmonary) Baroreceptors

Stretch receptors in the atria, ventricles, and pulmonary arteries sense changes in blood volume (filling pressure on the venous/low-pressure side). When activated by increased blood volume:
  • They stimulate Atrial Natriuretic Peptide (ANP) secretion
  • Inhibit ADH secretion from the hypothalamus
  • Inhibit renal sympathetic tone → vasodilation and increased Na⁺/water excretion
The Bainbridge reflex (atrial stretch → increased heart rate) also operates here. - Guyton and Hall, p. 231; Costanzo Physiology, p. 175

5. Abdominal Compression Reflex

When baroreceptor/chemoreceptor reflexes are elicited, signals travel via skeletal nerves to abdominal muscles → abdominal muscle contraction → compression of venous reservoirs → blood pushed toward the heart → increased venous return and cardiac output → raised BP. - Guyton and Hall

B. INTERMEDIATE-TERM Mechanisms

These require minutes to hours to act and are partly hormonal. Three key mechanisms operate in this window:

1. Renin-Angiotensin-Aldosterone System (RAAS)

Begins acting within minutes but reaches peak effect over hours.
Trigger: Decreased renal perfusion pressure (detected by mechanoreceptors in afferent arterioles of the kidney), renal sympathetic nerve stimulation, or low Na⁺ delivery to the macula densa.
Steps:
  1. Juxtaglomerular (JG) cells release Renin (a proteolytic enzyme)
  2. Renin cleaves Angiotensinogen (from liver) → Angiotensin I (10 amino acids, inactive)
  3. ACE (Angiotensin Converting Enzyme, mainly in lungs and kidneys) converts Ang I → Angiotensin II (8 amino acids, active)
  4. Angiotensin II acts via AT₁ receptors to:
    • Directly constrict arteriolar smooth muscle → Increases TPR
    • Stimulate Aldosterone secretion from adrenal cortex zona glomerulosa → increased Na⁺ reabsorption in distal tubule/collecting duct → expands ECF and blood volume → increases CO and BP (takes hours to days)
    • Stimulate Na⁺-H⁺ exchange in renal proximal tubule → increased Na⁺ and HCO₃⁻ reabsorption
    • Stimulate thirst (hypothalamus) and ADH secretion → increased water intake and retention
    • → All effects raise BP
Renin secretion is increased by β₁ agonists and blocked by β₁ antagonists (e.g., propranolol). ACE inhibitors (e.g., captopril) block Ang II formation; AT₁ blockers (e.g., losartan) block its actions. - Costanzo Physiology 7th Edition, p. 172

2. Vascular Stress Relaxation

When BP becomes elevated, blood vessels are stretched more and more over minutes to hours. This continued stretch is called stress relaxation - the vascular smooth muscle gradually "relaxes" against the stretch, reducing vascular tone over time, which causes pressure to fall back toward normal. Conversely, when BP is low, reverse stress relaxation (constriction) helps restore pressure. This mechanism acts as an intermediate-term pressure "buffer." - Guyton and Hall, p. 248

3. Capillary Fluid Shift Mechanism (Transcapillary Refill)

Governed by Starling forces across capillary walls:
  • When BP falls (capillary pressure falls): The balance of Starling forces favors fluid absorption from interstitium into the capillary → blood volume increases → BP rises toward normal.
  • When BP rises (capillary pressure rises): Fluid is filtered out of capillaries into the interstitium → blood volume decreases → BP falls toward normal.
This mechanism can mobilize up to 1 liter of fluid within 10-60 minutes. - Guyton and Hall, p. 248; Costanzo Physiology

4. Antidiuretic Hormone (ADH / Vasopressin)

ADH is secreted from the posterior pituitary in response to:
  • Decreased blood volume / decreased BP (sensed via cardiopulmonary baroreceptors)
  • Increased plasma osmolarity
Actions:
  • V1 receptors on vascular smooth muscle → arteriolar vasoconstriction → increased TPR → raises BP
  • V2 receptors on renal collecting duct principal cells → increased water reabsorption → expands blood volume → raises BP

C. LONG-TERM Mechanisms

These require hours to days to exert full effect and operate primarily through regulation of blood volume via the kidneys.

1. Renal-Body Fluid System (Pressure Diuresis/Natriuresis)

The most powerful long-term blood pressure control mechanism, with theoretically infinite gain given enough time.
Core principle: The kidneys respond to changes in arterial pressure by adjusting salt and water excretion:
  • Pressure diuresis: Rising arterial pressure → increased urine water output
  • Pressure natriuresis: Rising arterial pressure → increased urinary Na⁺ excretion
When BP rises above normal, the kidney excretes more Na⁺ and water → blood volume falls → CO falls → BP returns to normal. When BP falls below normal, renal excretion decreases → fluid is retained → BP rises back.
At 100 mm Hg, urine output is normal. At 200 mm Hg, it is 4-6 times normal. At 50 mm Hg, it is nearly zero. - Guyton and Hall, p. 247
This system, unlike short-term mechanisms, does not merely "buffer" pressure - it can return pressure almost completely to the level required for normal salt/water balance. This is why it has "infinite gain."

2. Aldosterone (via RAAS and direct regulation)

Aldosterone from the adrenal cortex increases Na⁺ (and therefore water) reabsorption in the distal nephron. Because aldosterone effects require gene transcription and new protein synthesis, they take hours to days to fully manifest. Over days, increased aldosterone → increased ECF volume → increased blood volume → raised BP. This chronically sets the "operating point" of the renal-body fluid system.

3. Atrial Natriuretic Peptide (ANP)

ANP is secreted by atrial myocytes in response to increased atrial stretch (volume overload). It counteracts pressure elevation by:
  • Vasodilation (relaxes vascular smooth muscle via cGMP) → decreased TPR
  • Increased renal Na⁺ and water excretion
  • Inhibition of renin and aldosterone secretion
  • Inhibition of ADH secretion
Net effect: decreased blood volume and decreased BP. - Guyton and Hall, p. 231; Costanzo Physiology, p. 175

4. Local Autoregulation

Over weeks, tissues regulate their own blood flow through local metabolic and myogenic mechanisms. When blood flow is chronically excessive (as in hypervolemic hypertension), tissues autoregulate by increasing their own vascular resistance. This rise in TPR sustains the hypertension even if blood volume later normalizes - a phenomenon underlying some forms of chronic hypertension. - Guyton and Hall

Summary Table

CategoryMechanismOnsetKey MediatorEffect on BP
Short-termBaroreceptor reflexSecondsAutonomic NSRapid buffering
Short-termChemoreceptor reflexSeconds-minAutonomic NSActive only when BP <80 mmHg
Short-termCNS ischemic responseSecondsMassive sympatheticsEmergency (BP <60 mmHg)
Short-termCardiopulmonary baroreceptorsSeconds-minANP, ADH inhibitionVolume sensing
IntermediateRAAS (Ang II vasoconstriction)Minutes-hoursAngiotensin IIVasoconstriction + volume
IntermediateStress relaxationMinutes-hoursVascular stretchBuffer
IntermediateCapillary fluid shift10-60 minStarling forcesVolume adjustment
IntermediateADHMinutes-hoursVasopressinWater retention + vasoconstriction
Long-termRenal-body fluid (pressure diuresis)Hours-daysKidneyNear-infinite gain
Long-termAldosteroneHours-daysAldosteroneNa⁺/water retention
Long-termANPHours-daysANPNa⁺/water excretion
Long-termLocal autoregulationWeeksMetabolic/myogenicTissue flow regulation

Sources:
  • Guyton and Hall Textbook of Medical Physiology, Chapters 18-19
  • Costanzo Physiology, 7th Edition, Chapter 4 (Cardiovascular Physiology, pp. 169-176)
This is a shared conversation. Sign in to Orris to start your own chat.