Explain me the changes in ECG for 10 regular and most common cases with graphs
Reading File
Finding Sources
Finding Sources
Finding Sources
Finding Sources
Finding Sources
Reading File
Finding Sources
Finding Sources
Reading File
Reading File
Reading File
Reading File
Loading Image
Loading Image
Loading Image
Reading File
Loading Image
Loading Image
Loading Image
Reading File
Loading Image
Loading Image
Finding Sources
Reading File
Finding Sources
Reading File
Finding Sources
Loading Image
Here is a comprehensive guide to ECG changes in the 10 most common and clinically important conditions, sourced from Harrison's Principles of Internal Medicine, Guyton & Hall, Braunwald's Heart Disease, Morgan & Mikhail's Clinical Anesthesiology, and Goldman-Cecil Medicine.
ECG Changes in 10 Common Clinical Conditions
1. Normal Sinus Rhythm (Reference Baseline)
Before covering pathology, here is the baseline for comparison. A normal ECG shows:
- Regular P wave before every QRS
- PR interval: 120-200 ms
- QRS duration: <120 ms
- QT interval varies with heart rate (QTc <440 ms in men, <460 ms in women)
- Upright T waves in lateral leads, inverted in aVR
2. STEMI - ST-Elevation Myocardial Infarction
Mechanism: Total occlusion of a coronary artery causes transmural (full-thickness) ischemia. Injured epicardial cells generate a "current of injury" that shifts the ST vector outward toward the affected zone.
ECG changes (evolving over hours to days):
- Hyperacute T waves - earliest sign; tall, peaked, broad T waves
- ST elevation - convex ("tombstone") upsloping ST elevation ≥1 mm in ≥2 contiguous limb leads or ≥2 mm in ≥2 precordial leads
- Reciprocal ST depression - in leads facing the opposite wall
- Pathological Q waves - develop over hours to days; width ≥40 ms, depth ≥¼ R wave = necrosis marker
- T-wave inversion - follows ST elevation as infarct evolves
Lead localization:
| Territory | Culprit artery | ST elevation in |
|---|---|---|
| Anterior | LAD | V1-V6, I, aVL |
| Inferior | RCA | II, III, aVF |
| Lateral | LCx | I, aVL, V5-V6 |
| Posterior | RCA/LCx | Reciprocal V1-V3 depression |
| RV | RCA proximal | V1, V4R |
Anterior STEMI - ECG sequence (acute top row, evolving bottom row):
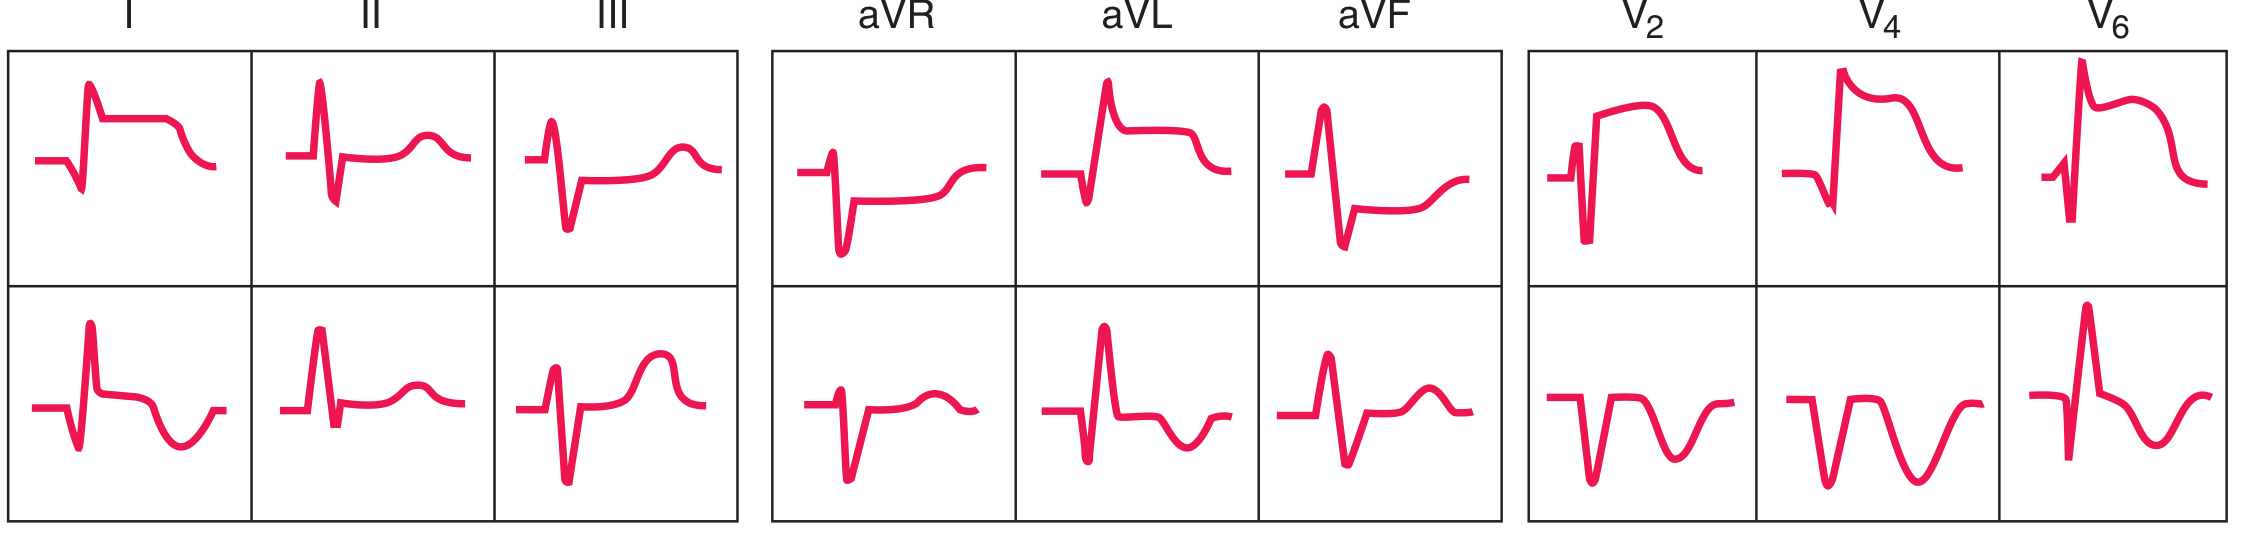
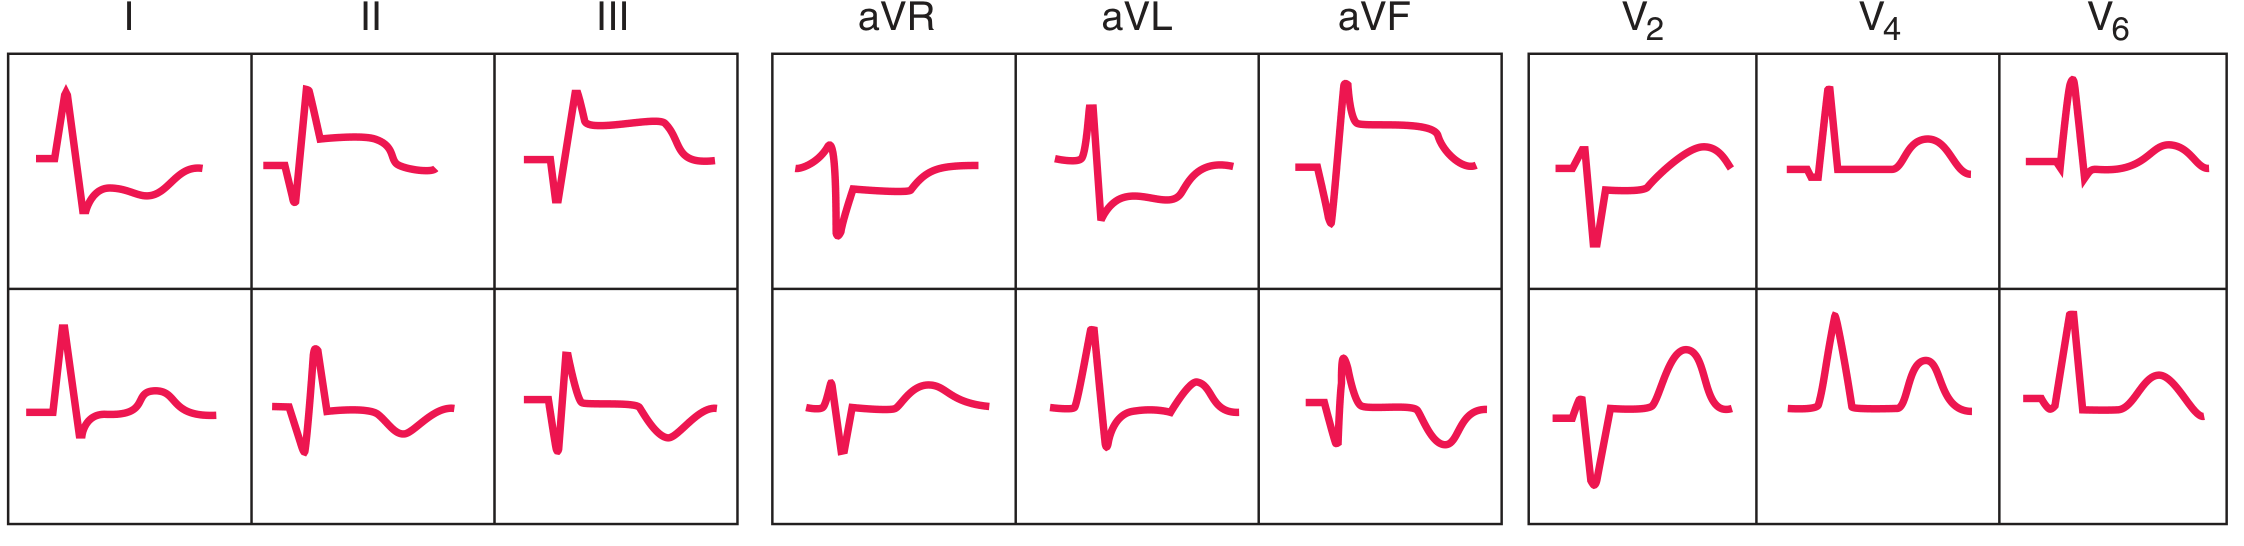
Inferior STEMI - ECG sequence:
Subendocardial vs. transmural ischemia - current of injury diagram:
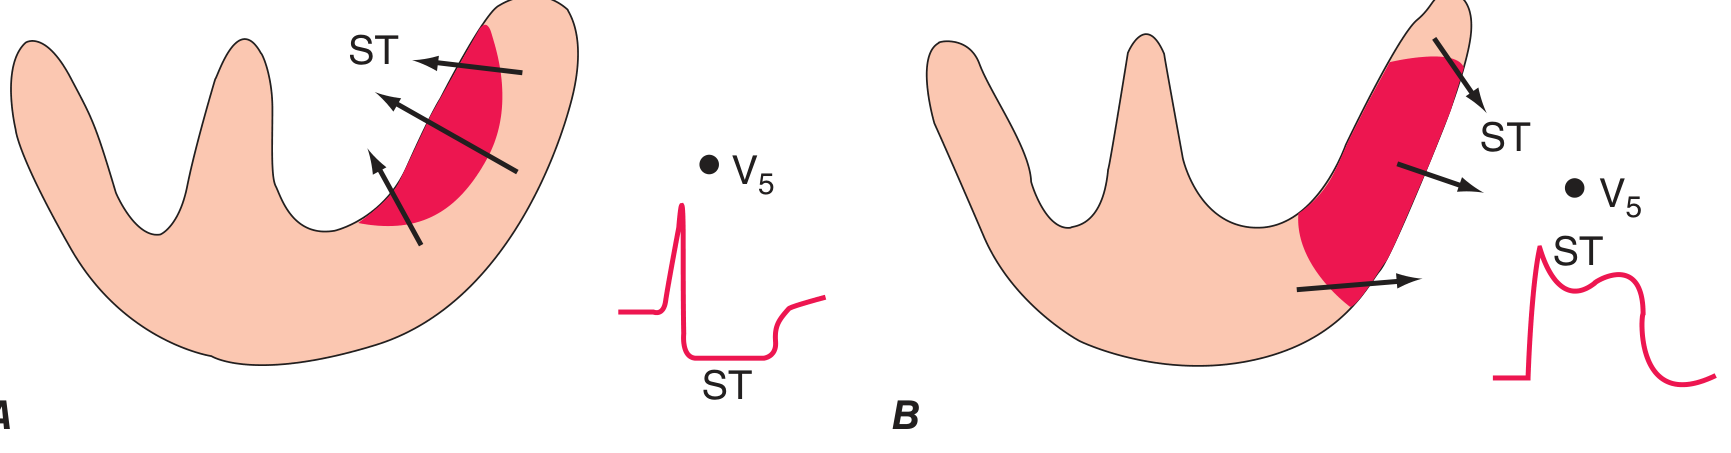
Left: subendocardial ischemia → ST vector directed inward → overlying leads show ST depression. Right: transmural/epicardial ischemia → ST vector directed outward → overlying leads show ST elevation. - Harrison's Principles of Internal Medicine 22E, Fig. 247-11
3. NSTEMI / Unstable Angina (Subendocardial Ischemia)
ECG changes:
- ST depression ≥0.5 mm (horizontal or downsloping) in ≥2 contiguous leads
- T-wave inversions - symmetric, deep; in precordial leads V1-V4 with high-grade LAD stenosis = Wellens sign
- No Q waves, no ST elevation
- A normal ECG does not exclude NSTEMI
Wellens T-wave sign - deep symmetric T inversions in V1-V6 (shown in 6-lead strip below):
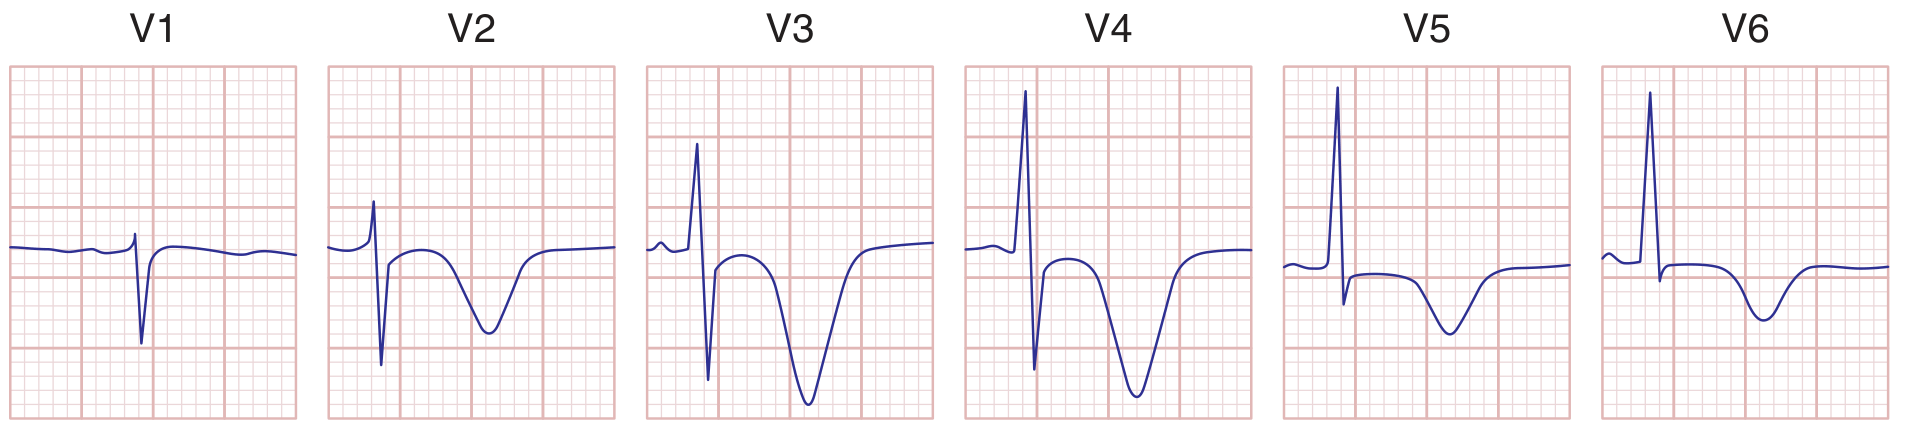
"Patients who present with deep T-wave inversions in multiple precordial leads (V1-V4) typically have severe obstruction in the left anterior descending coronary artery." - Harrison's Principles of Internal Medicine 22E, p. 1916
4. Atrial Fibrillation (AF)
Mechanism: Multiple chaotic re-entrant circuits in the atria produce disorganized electrical activity at 350-600 impulses/min. The AV node filters these, producing an irregularly irregular ventricular response.
ECG changes:
- No P waves - replaced by low-amplitude fibrillatory (f) waves, best seen in V1
- Irregularly irregular RR intervals - the hallmark; no two consecutive RR intervals are equal
- QRS complexes are narrow (unless aberrant conduction or bundle branch block)
- Ventricular rate typically 100-160 bpm if untreated
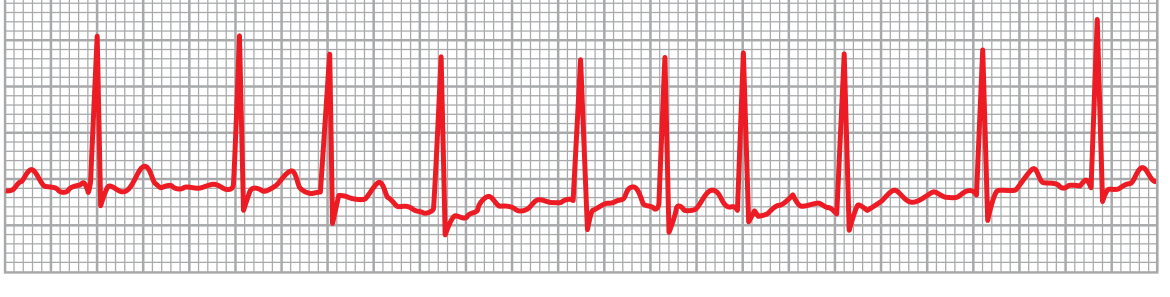
"In the ECG, one can see either no P waves or only a fine, high-frequency, very low voltage wave. The QRS-T complexes are normal unless there is some pathology of the ventricles, but their timing is irregular." - Guyton & Hall Textbook of Medical Physiology, Fig. 13.20
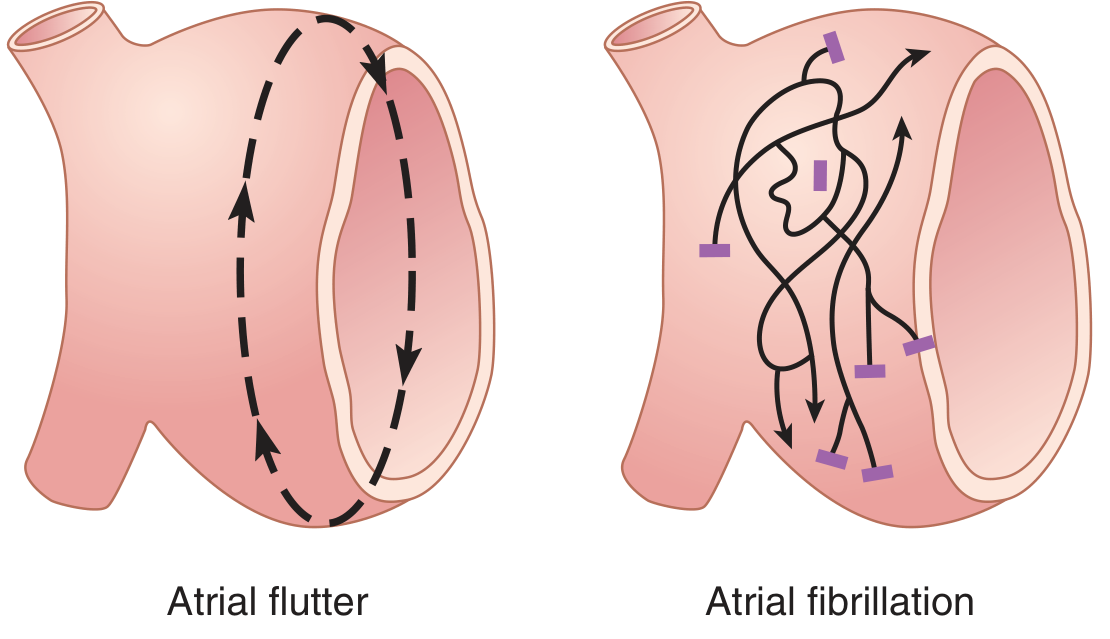
5. Atrial Flutter
Mechanism: A single organized macro-reentrant circuit in the right atrium at ~300 beats/min. The AV node typically conducts every 2nd impulse (2:1 block), giving a ventricular rate of ~150 bpm.
ECG changes:
- Sawtooth flutter (F) waves at 250-350/min, best seen in leads II, III, aVF and V1
- Regular atrial rate; ventricular rate typically 150 bpm (2:1) or 100 bpm (3:1)
- No discrete P waves
- Classic pearl: any regular tachycardia at exactly 150 bpm - suspect atrial flutter with 2:1 block
6. Ventricular Tachycardia (VT)
Mechanism: Rapid impulse formation or re-entry within the ventricular myocardium, bypassing the normal His-Purkinje system, causing wide, bizarre QRS complexes.
ECG changes:
- Wide QRS complexes ≥120 ms (usually ≥140 ms)
- Rate 100-250 bpm, typically 140-200 bpm
- AV dissociation - P waves march through at their own rate, independent of QRS
- Capture beats - occasional narrow QRS when a sinus impulse successfully captures the ventricle
- Fusion beats - hybrid QRS between sinus beat and VT beat
- Concordance - all precordial leads with same QRS polarity; negative concordance (all negative) strongly suggests VT
- Left axis deviation common
Key distinction from SVT with aberrancy: Brugada criteria, AV dissociation, fusion/capture beats all favor VT.
"For wide-QRS complex tachycardias, the 12-lead ECG is useful in distinguishing SVT (with aberrancy) from ventricular tachycardia. The presence of fusion beats, capture beats, and AV dissociation all favor VT." - Goldman-Cecil Medicine, Electrocardiography section
7. Complete Heart Block (3rd-Degree AV Block)
Mechanism: No conduction passes from atria to ventricles. Atria and ventricles beat independently. A junctional or ventricular escape rhythm maintains cardiac output.
ECG changes:
- P waves and QRS complexes are completely independent (AV dissociation)
- P-P intervals are regular; RR intervals are regular - but at different rates
- Atrial rate: 60-100/min; ventricular escape rate: 40-60/min (junctional, narrow QRS) or 20-40/min (ventricular, wide QRS)
- The PR interval varies constantly - no fixed relationship between P and QRS
- Classic pearl: more P waves than QRS complexes on the strip
8. Left Ventricular Hypertrophy (LVH)
Mechanism: Increased myocardial mass generates larger electrical forces directed leftward and posteriorly.
ECG changes (voltage criteria + repolarization):
- Tall R waves in lateral leads (V5, V6, I, aVL)
- Deep S waves in right precordial leads (V1, V2)
- Sokolow-Lyon criteria: S in V1 + R in V5 or V6 >35 mm (adults)
- Cornell criteria: R in aVL + S in V3 >28 mm (men), >20 mm (women)
- LV strain pattern: ST depression + T-wave inversion in leads I, aVL, V4-V6 (asymmetric, downsloping)
- Left axis deviation, prolonged QRS
LVH vs. RVH vs. Normal in V1 and V6:
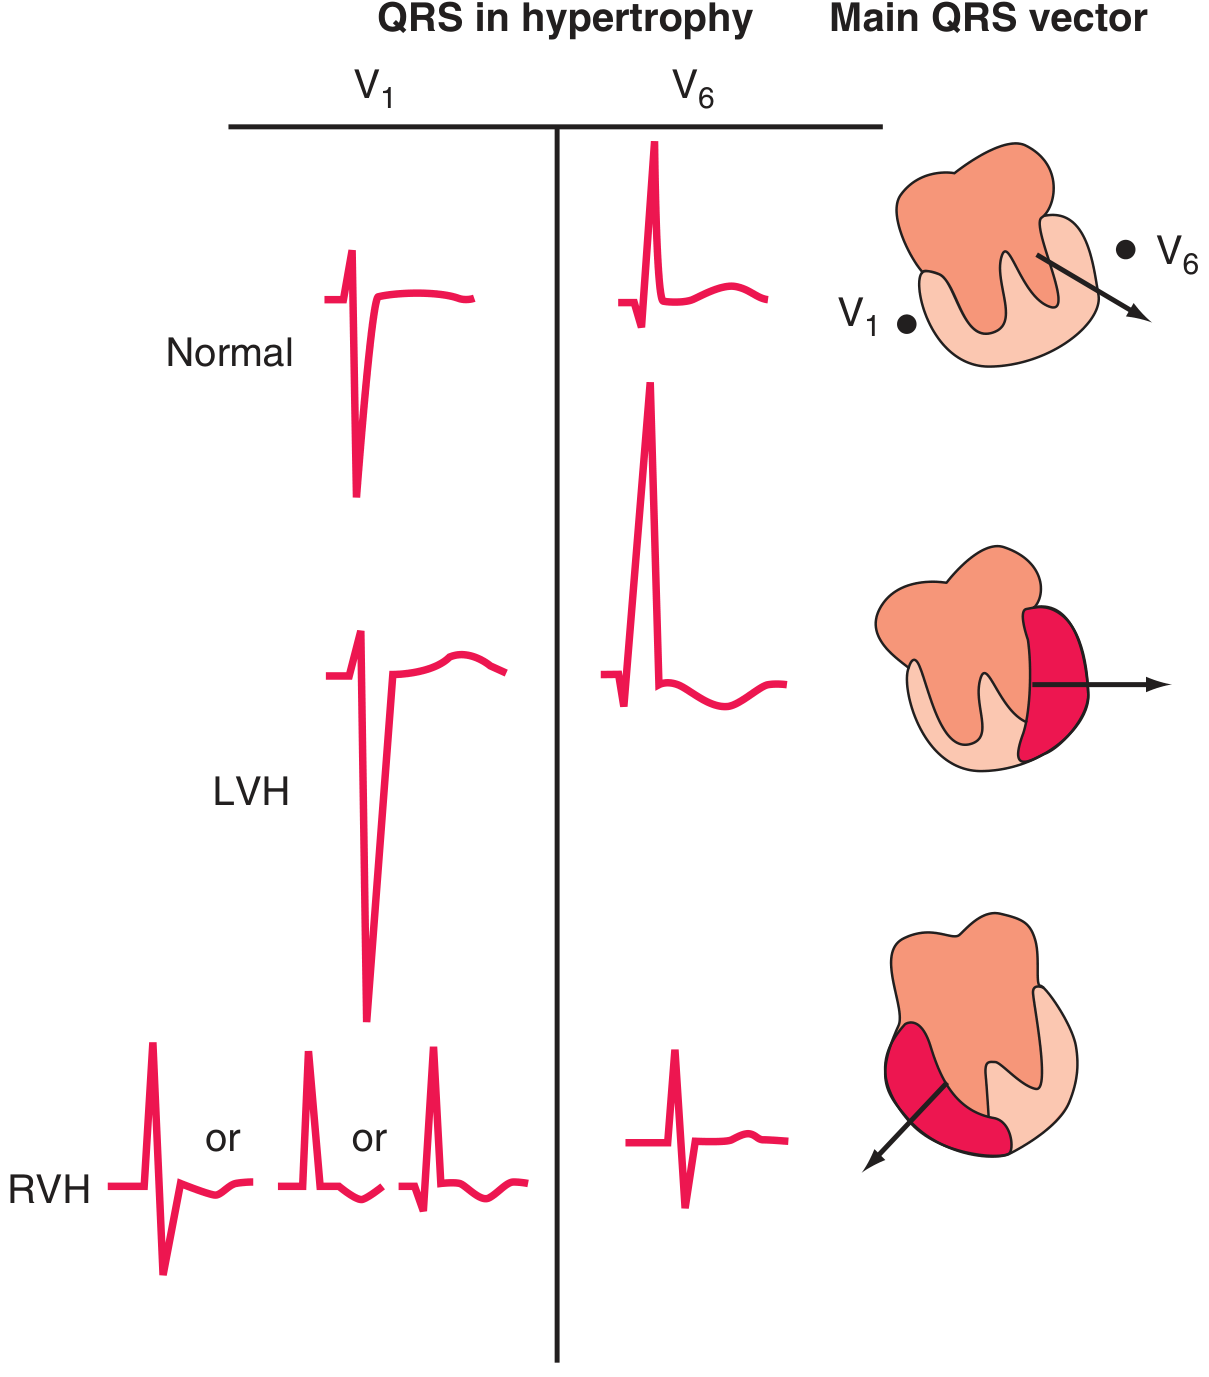
"LVH increases the amplitude of electrical forces directed to the left and posteriorly. Repolarization abnormalities may cause ST-segment depression and T-wave inversion in leads with a prominent R wave." - Harrison's Principles of Internal Medicine 22E, Fig. 247-9
9. Right Atrial / Left Atrial Enlargement (P-wave Changes)
Right Atrial Enlargement (P pulmonale):
- Tall, peaked P waves ≥2.5 mm in leads II, III, aVF
- P wave axis rightward
Left Atrial Enlargement (P mitrale):
- Broad, notched P waves ≥120 ms in limb leads (bifid "m-shaped" P wave)
- Biphasic P wave in V1 with prominent negative component (representing delayed LA depolarization)
- P-wave axis leftward
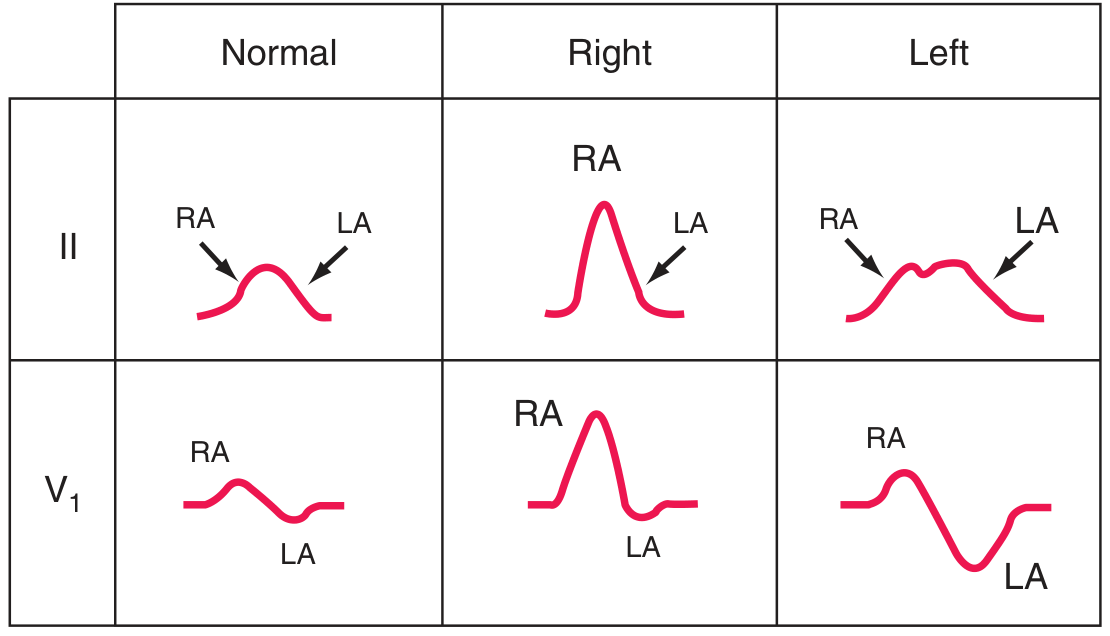
"Right atrial overload may cause tall, peaked P waves in the limb or precordial leads. Left atrial abnormality may cause broad, often notched P waves in the limb leads and a biphasic P wave in lead V1 with a prominent negative component." - Harrison's Principles of Internal Medicine 22E, Fig. 247-8
10. Hyperkalemia
Mechanism: Elevated extracellular K+ raises the resting membrane potential closer to threshold, slowing conduction through all cardiac tissues. Changes are progressive with rising serum K+ levels.
ECG changes (sequential with rising K+):
| Serum K+ | ECG finding |
|---|---|
| 5.5-6.5 mEq/L | Tall, symmetrically peaked T waves; shortened QT interval |
| 6.5-7.5 mEq/L | PR interval prolongation; flattened or absent P waves; ST depression |
| 7.5-8.0 mEq/L | Widening QRS complex (>120 ms); loss of R-wave amplitude |
| >8.0 mEq/L | Sine wave pattern (QRS and T merge); precedes VF or asystole |
"ECG changes characteristically progress from symmetrically peaked T waves, often with a shortened QT interval, to widening of the QRS complex, prolongation of the PR interval, loss of the P wave... to an ECG that resembles a sine wave before final progression into ventricular fibrillation or asystole." - Morgan & Mikhail's Clinical Anesthesiology 7e, Fig. 49-7
Bonus: Pulmonary Embolism (PE)
ECG changes (nonspecific but suggestive):
- Sinus tachycardia - most common finding
- S1Q3T3 pattern: deep S wave in lead I, Q wave + T-wave inversion in lead III
- Right axis deviation
- New right bundle branch block (complete or incomplete)
- T-wave inversions in V1-V4 (right heart strain pattern)
- Atrial fibrillation or flutter may occur
"Acute cor pulmonale due to pulmonary thromboembolism may be associated with sinus tachycardia, right axis deviation, the S₁Q₃T₃ pattern, slow R-wave progression, and ST-T abnormalities in V1 to V4 simulating acute anterior infarction." - Harrison's Principles of Internal Medicine 22E, p. 1915
Quick Reference Summary Table
| Condition | Rate | Rhythm | P wave | PR | QRS | ST/T |
|---|---|---|---|---|---|---|
| Sinus rhythm | 60-100 | Regular | Normal | 120-200ms | <120ms | Normal |
| STEMI (acute) | Variable | Regular | Normal | Normal | Normal | ST ↑, hyperacute T |
| NSTEMI | Variable | Regular | Normal | Normal | Normal | ST ↓, T inv |
| Atrial fibrillation | 100-160 | Irregular | Absent (f waves) | None | Normal | Variable |
| Atrial flutter | 75-150 | Regular | Sawtooth F | None | Normal | Variable |
| VT | 140-200 | Regular | Dissociated | Variable | Wide ≥120ms | Concordant |
| 3rd-degree block | 20-60 | Regular (escape) | Present | Variable (dissociated) | Narrow or wide | Variable |
| LVH | Normal | Regular | Normal | Normal | Tall voltage | Strain (ST↓, T inv lat) |
| LA enlargement | Normal | Regular | Broad/bifid/biphasic | Normal | Normal | Normal |
| Hyperkalemia | Bradycardia | Irregular | Absent (severe) | ↑ | Wide, sine wave | Peaked T → flat |
| PE | Tachycardia | Regular | Normal | Normal | Normal or RBBB | S1Q3T3, RV strain |
Sources: Harrison's Principles of Internal Medicine 22E (2025); Guyton & Hall Textbook of Medical Physiology; Braunwald's Heart Disease; Morgan & Mikhail's Clinical Anesthesiology 7e; Goldman-Cecil Medicine.
This is a shared conversation. Sign in to Orris to start your own chat.