
Aerobic and anaerobic bacteria
aerobic anaerobic bacteria oxygen requirements classification diagram
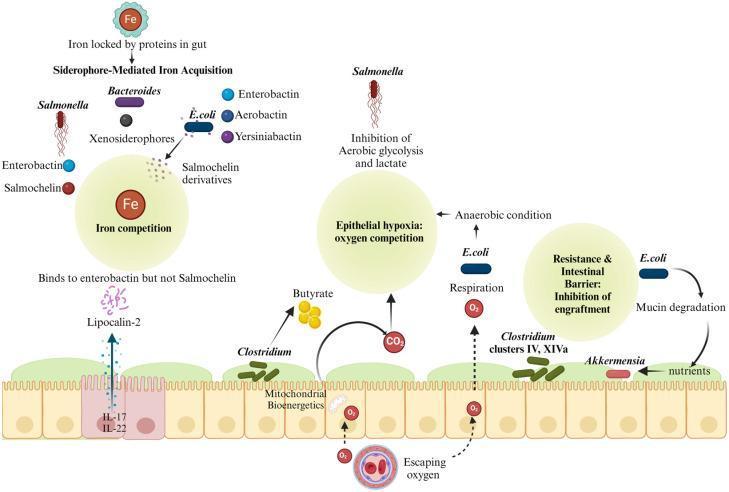
This medical illustration depicts the mechanisms of colonization resistance and ecocompetition within the human gut microbiome between commensal bacteria and pathogenic Salmonella. The diagram is divided into three functional areas: siderophore-mediated iron acquisition, epithelial hypoxia/oxygen competition, and mucosal barrier resistance. In the iron acquisition section, the diagram shows Salmonella producing salmochelin to bypass the host antimicrobial protein Lipocalin-2 (which binds enterobactin), while commensal E. coli and Bacteroides compete for iron using various siderophores like aerobactin and yersiniabactin. Centrally, the diagram illustrates how Clostridium-derived butyrate fuels mitochondrial bioenergetics in colonocytes, consuming oxygen and maintaining epithelial hypoxia. This anaerobic state, supplemented by E. coli respiration, inhibits the aerobic glycolysis and growth of Salmonella. Finally, the intestinal barrier section shows commensal E. coli degrading mucin to support beneficial bacteria like Akkermensia, collectively inhibiting Salmonella engraftment and translocation. The schematic emphasizes the symbiotic role of the microbiota in maintaining intestinal homeostasis and nutrient sequestration to prevent pathogen proliferation.
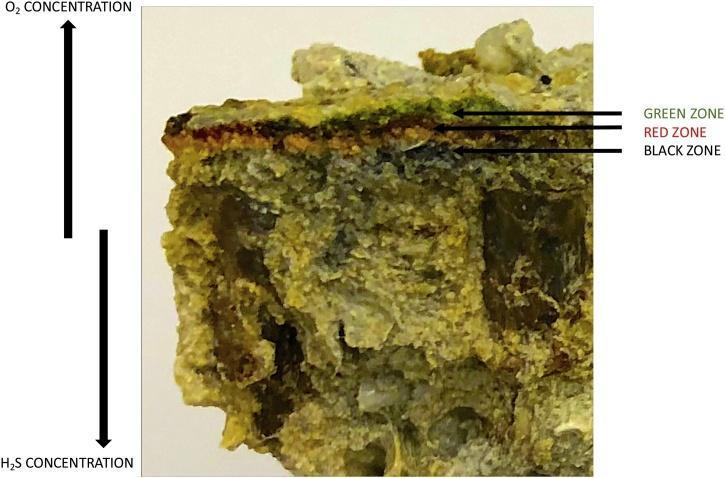
This clinical specimen photograph displays a cross-section of a microbial mat, illustrating the stratification of biological communities based on environmental gradients. The image demonstrates three distinct colored zones: a superficial Green Zone, an intermediate Red Zone, and a deep Black Zone. To the left, vertical arrows indicate chemical gradients, showing that oxygen (O2) concentration is highest at the top (surface) and decreases with depth, while hydrogen sulfide (H2S) concentration increases toward the bottom. This anatomical arrangement reflects the metabolic niches of the organisms present: the green layer is dominated by oxygenic phototrophs (cyanobacteria and algae) where O2 is abundant; the red layer contains anoxygenic phototrophs; and the black layer represents the anaerobic zone dominated by sulfate-reducing bacteria. This visual serves as a pathophysiology diagram for understanding microbial ecology, redox gradients, and the transition from aerobic to anaerobic environments in specialized biological niches.
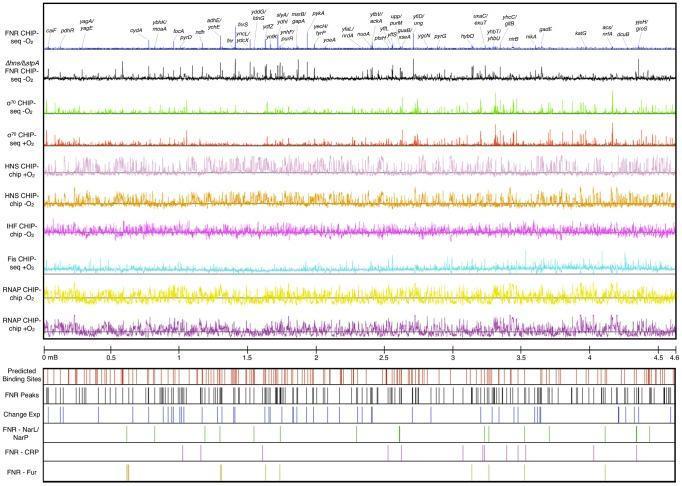
This diagnostic diagram presents genome-wide ChIP-seq and ChIP-chip data for Escherichia coli K-12, serving as a model for understanding transcriptional regulation under varying oxygen levels. The figure displays ten color-coded data tracks aligned to genomic coordinates (0 to 4.6 mB). The tracks include FNR binding under anaerobic conditions (blue), FNR in a Δhns/ΔstpA mutant (black), σ70 subunit of RNAP under anaerobic (green) and aerobic (red) conditions, H-NS occupancy (light purple/orange), IHF (purple), Fis (aqua), and the β subunit of RNAP (yellow/dark purple). Below the signal tracks, discrete tick marks indicate predicted FNR binding sites, actual ChIP-seq peaks, and FNR peaks categorized by their regulatory outcomes or co-regulators (NarL/NarP, CRP, Fur). The comparison highlights how the deletion of nucleoid-associated proteins like H-NS unmasks additional FNR binding sites. This visualization is essential for studying microbial pathogenesis and the molecular mechanisms of oxygen-dependent gene expression in biomedical research.
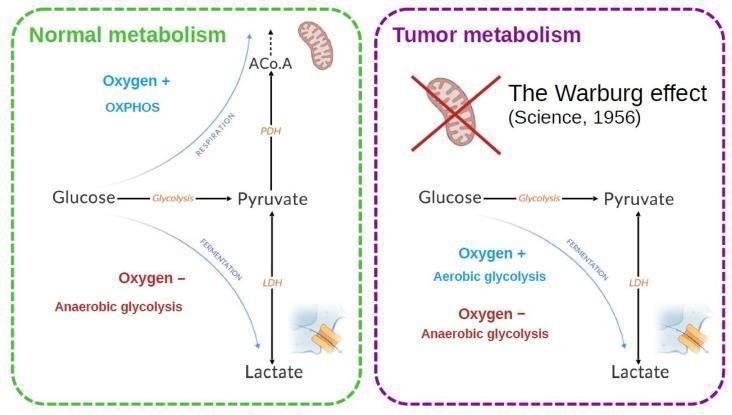
A pathophysiology diagram comparing cellular energy metabolism in normal versus tumor cells. The 'Normal metabolism' panel illustrates that glucose is converted to pyruvate via glycolysis. In the presence of oxygen (Oxygen + OXPHOS), pyruvate is converted to Acetyl-CoA (ACo.A) via Pyruvate Dehydrogenase (PDH) for mitochondrial respiration. In the absence of oxygen (Oxygen - Anaerobic glycolysis), pyruvate is converted to lactate via Lactate Dehydrogenase (LDH) through fermentation. In contrast, the 'Tumor metabolism' panel highlights the 'Warburg effect,' visually depicted by a red 'X' over the mitochondrion. Here, tumor cells predominantly utilize aerobic glycolysis even in the presence of oxygen, resulting in an increased flux from glucose to pyruvate and subsequently to lactate via fermentation. Key enzymes depicted include PDH and LDH, and a membrane-bound transporter (likely MCT) is shown facilitating lactate efflux. The diagram uses dashed borders (green for normal, purple for tumor) and specific color-coded text to differentiate between physiological respiration and pathological aerobic glycolysis.
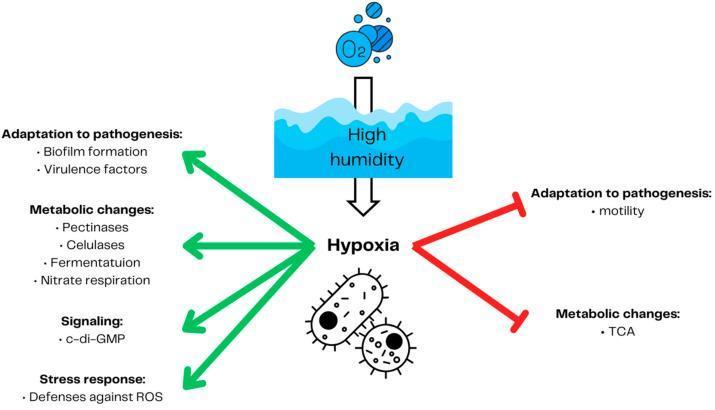
A pathophysiology diagram illustrating the adaptive responses of Soft rot Pectobacteriaceae (SRP) to environmental hypoxia. The flowchart shows that high humidity leads to hypoxia (low oxygen), which triggers divergent physiological pathways in the bacteria. Green arrows indicate induction of specific functions, including: 1) Adaptation to pathogenesis (biofilm formation and virulence factors), 2) Metabolic changes (production of pectinases and cellulases, fermentation, and nitrate respiration), 3) Signaling (increased c-di-GMP), and 4) Stress response (defenses against reactive oxygen species - ROS). Conversely, red inhibitory arrows indicate the suppression of bacterial motility and the TCA cycle. The diagram captures how oxygen-deprived environments modulate bacterial gene expression and metabolism to favor pathogenicity over aerobic growth, relevant to understanding the development of soft rot disease in crops and the basic microbiology of environmental pathogens.
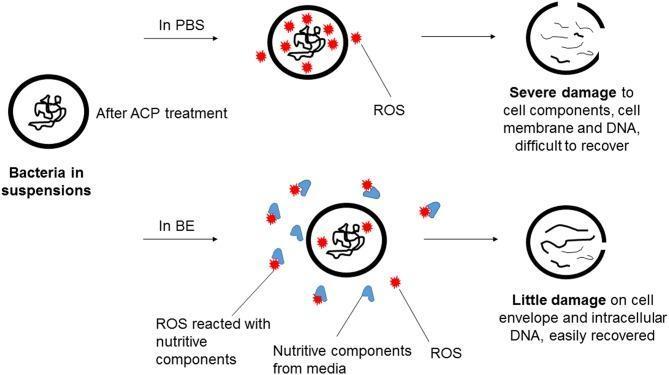
This pathophysiology diagram illustrates the mechanism of Atmospheric Cold Plasma (ACP) generated Reactive Oxygen Species (ROS) against bacteria in two different suspension media: Phosphate-Buffered Saline (PBS) and Beef Extract (BE). The diagram follows a comparative timeline from a healthy bacterial cell to its state after ACP treatment. In the PBS pathway (top), ROS (depicted as red stars) directly penetrate the bacterial cell, leading to 'Severe damage to cell components, cell membrane and DNA,' resulting in a ruptured cell wall and fragmented internal structures labeled as 'difficult to recover.' In the BE pathway (bottom), blue 'nutritive components' from the media act as scavengers, reacting with and neutralizing many ROS molecules. Consequently, fewer ROS reach the bacterium, leading to 'Little damage on cell envelope and intracellular DNA.' This visual explains the protective effect of organic matter/nutrient-rich environments against plasma-mediated antimicrobial efficacy, highlighting the clinical and industrial relevance of media composition in bacterial inactivation protocols.
bacteria growth in thioglycolate broth oxygen requirements aerobic facultative anaerobic
This medical illustration depicts the mechanisms of colonization resistance and ecocompetition within the human gut microbiome between commensal bacteria and pathogenic Salmonella. The diagram is divided into three functional areas: siderophore-mediated iron acquisition, epithelial hypoxia/oxygen competition, and mucosal barrier resistance. In the iron acquisition section, the diagram shows Salmonella producing salmochelin to bypass the host antimicrobial protein Lipocalin-2 (which binds enterobactin), while commensal E. coli and Bacteroides compete for iron using various siderophores like aerobactin and yersiniabactin. Centrally, the diagram illustrates how Clostridium-derived butyrate fuels mitochondrial bioenergetics in colonocytes, consuming oxygen and maintaining epithelial hypoxia. This anaerobic state, supplemented by E. coli respiration, inhibits the aerobic glycolysis and growth of Salmonella. Finally, the intestinal barrier section shows commensal E. coli degrading mucin to support beneficial bacteria like Akkermensia, collectively inhibiting Salmonella engraftment and translocation. The schematic emphasizes the symbiotic role of the microbiota in maintaining intestinal homeostasis and nutrient sequestration to prevent pathogen proliferation.
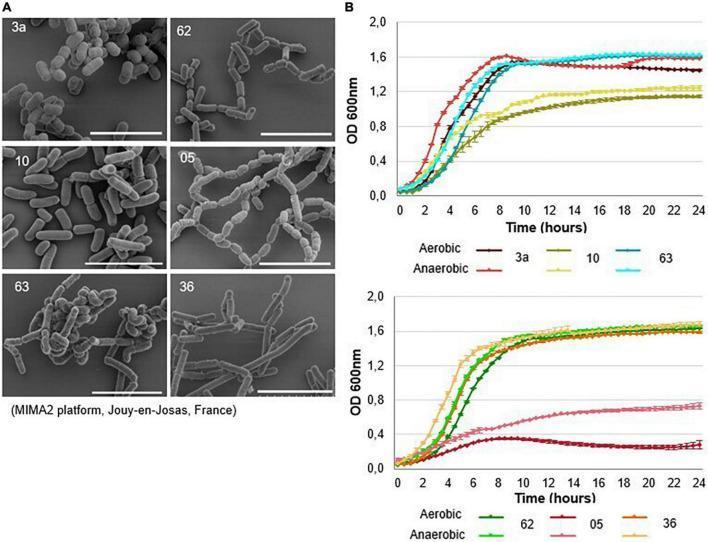
This composite educational graphic details the morphological and growth characteristics of six lactic acid bacteria (LAB) strains (3a, 10, 63, 62, 05, and 36). Panel A presents scanning electron microscopy (SEM) images, revealing that all strains exhibit a Gram-positive, bacilliform (rod-shaped) morphology with variations in arrangement. Strains like 3a and 63 show dense clumping and irregular aggregates, while 62 and 05 demonstrate more distinct chain-like formations. Scale bars indicate 5 μm. Panel B displays growth curves over a 24-hour period in MRS medium, comparing aerobic (dark lines) and anaerobic (light lines) conditions. Growth is quantified by Optical Density (OD 600nm). Strains 3a, 62, 63, and 36 exhibit robust growth, reaching stationary phases between 8-10 hours with high turbidity. In contrast, strain 10 displays a slower growth rate, and strain 05 shows significantly impaired growth, particularly under aerobic conditions. This comparative data is used in clinical research to select probiotic candidates based on viability and growth efficiency.
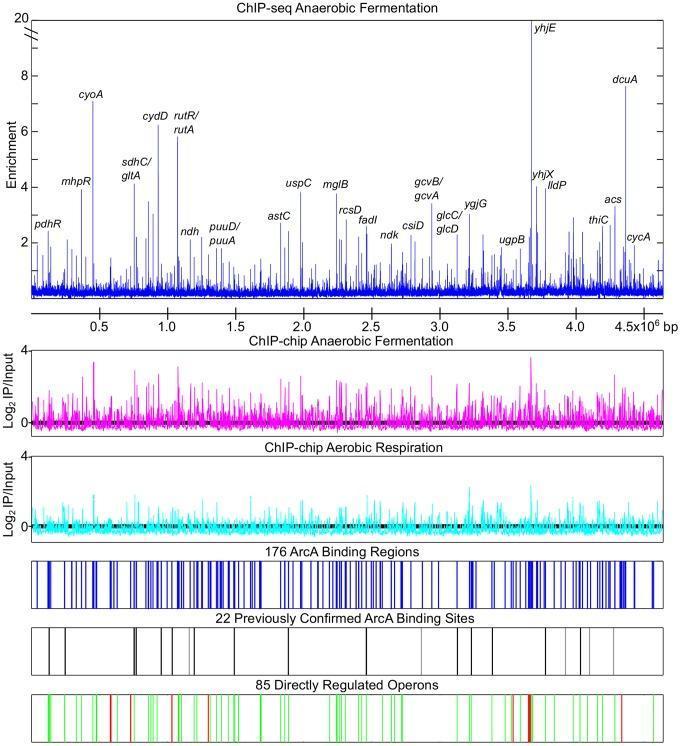
This genomic visualization represents a genome-wide overview of the ArcA regulon in E. coli, serving as a model for understanding bacterial metabolic regulation. The top three panels compare DNA-binding enrichment across different growth conditions and methodologies. The first panel (blue) shows ChIP-seq data during anaerobic fermentation, displaying high-resolution enrichment peaks for ArcA at specific loci such as cyoA, sdhC/gltA, and dcuA. The second (magenta) and third (cyan) panels utilize ChIP-chip methodology to contrast binding during anaerobic fermentation versus aerobic respiration, respectively, demonstrating a significant decrease in ArcA occupancy under aerobic conditions. Below these, three summary tracks provide clinical and research context: the first indicates 176 identified ArcA binding regions (blue vertical lines); the second maps 22 previously confirmed binding sites (black lines); and the final track classifies 85 directly regulated operons, color-coded to show transcriptional repression (green) and activation (red). This data illustrates the transition of global transcriptional regulators in response to oxygen levels, a fundamental concept in microbial pathogenesis and metabolism.
This clinical specimen photograph displays a cross-section of a microbial mat, illustrating the stratification of biological communities based on environmental gradients. The image demonstrates three distinct colored zones: a superficial Green Zone, an intermediate Red Zone, and a deep Black Zone. To the left, vertical arrows indicate chemical gradients, showing that oxygen (O2) concentration is highest at the top (surface) and decreases with depth, while hydrogen sulfide (H2S) concentration increases toward the bottom. This anatomical arrangement reflects the metabolic niches of the organisms present: the green layer is dominated by oxygenic phototrophs (cyanobacteria and algae) where O2 is abundant; the red layer contains anoxygenic phototrophs; and the black layer represents the anaerobic zone dominated by sulfate-reducing bacteria. This visual serves as a pathophysiology diagram for understanding microbial ecology, redox gradients, and the transition from aerobic to anaerobic environments in specialized biological niches.
![<table>
<tr>
<th>Media</th>
<th>Common Isolates</th>
</tr>
<tr>
<td colspan="2"><b>Standard</b></td>
</tr>
<tr>
<td>Blood agar</td>
<td>Aerobic and facultatively anaerobic bacteria, including <i>P. aeruginosa</i>, <i>S. aureus</i>, <i>S. epidermidis</i>, and <i>S. pneumoniae</i></td>
</tr>
<tr>
<td>Chocolate agar</td>
<td>Aerobic and facultatively anaerobic bacteria, including <i>H. influenzae</i>, <i>N. gonorrhea</i>, and <i>Bartonella</i> species</td>
</tr>
<tr>
<td>Thioglycollate broth</td>
<td>Aerobic and facultatively anaerobic bacteria</td>
</tr>
<tr>
<td>Sabouraud dextrose agar</td>
<td>Fungi</td>
</tr>
<tr>
<td>Mannitol salt agar</td>
<td><i>Staphylococcus</i> isolates</td>
</tr>
<tr>
<td colspan="2"><b>Supplemental</b></td>
</tr>
<tr>
<td>Anaerobic blood agar (CDC, Schaedler, Brucella)</td>
<td><i>P. acnes</i>, <i>Peptostreptococcus</i></td>
</tr>
<tr>
<td>Löwenstein-Jensen medium</td>
<td><i>Mycobacterium</i> species, <i>Nocardia</i> species</td>
</tr>
<tr>
<td>Middlebrook agar</td>
<td><i>Mycobacterium</i> species</td>
</tr>
<tr>
<td>Thayer-Martin agar</td>
<td>Pathogenic <i>Neisseria</i> species</td>
</tr>
<tr>
<td colspan="2"><b>Transport</b></td>
</tr>
<tr>
<td>BHI (brain heart infusion [Oxid]) medium</td>
<td>Aerobic and facultatively anaerobic bacteria</td>
</tr>
<tr>
<td>Amies medium without charcoal</td>
<td>Aerobic and facultatively anaerobic bacteria; fungi</td>
</tr>
</table>](https://cdn.orris.care/cdss_images/GLGCA_10669_1766767369966_5bcaaca4-4ca8-43ec-a859-12b2b9144a03_28897682-c1a6-4f79-b9a5-893bd0d20b70.png)
<table> <tr> <th>Media</th> <th>Common Isolates</th> </tr> <tr> <td colspan="2"><b>Standard</b></td> </tr> <tr> <td>Blood agar</td> <td>Aerobic and facultatively anaerobic bacteria, including <i>P. aeruginosa</i>, <i>S. aureus</i>, <i>S. epidermidis</i>, and <i>S. pneumoniae</i></td> </tr> <tr> <td>Chocolate agar</td> <td>Aerobic and facultatively anaerobic bacteria, including <i>H. influenzae</i>, <i>N. gonorrhea</i>, and <i>Bartonella</i> species</td> </tr> <tr> <td>Thioglycollate broth</td> <td>Aerobic and facultatively anaerobic bacteria</td> </tr> <tr> <td>Sabouraud dextrose agar</td> <td>Fungi</td> </tr> <tr> <td>Mannitol salt agar</td> <td><i>Staphylococcus</i> isolates</td> </tr> <tr> <td colspan="2"><b>Supplemental</b></td> </tr> <tr> <td>Anaerobic blood agar (CDC, Schaedler, Brucella)</td> <td><i>P. acnes</i>, <i>Peptostreptococcus</i></td> </tr> <tr> <td>Löwenstein-Jensen medium</td> <td><i>Mycobacterium</i> species, <i>Nocardia</i> species</td> </tr> <tr> <td>Middlebrook agar</td> <td><i>Mycobacterium</i> species</td> </tr> <tr> <td>Thayer-Martin agar</td> <td>Pathogenic <i>Neisseria</i> species</td> </tr> <tr> <td colspan="2"><b>Transport</b></td> </tr> <tr> <td>BHI (brain heart infusion [Oxid]) medium</td> <td>Aerobic and facultatively anaerobic bacteria</td> </tr> <tr> <td>Amies medium without charcoal</td> <td>Aerobic and facultatively anaerobic bacteria; fungi</td> </tr> </table>

This image depicts the cover of the second edition of the medical reference textbook 'Identification of Unusual Pathogenic Gram-Negative Aerobic and Facultatively Anaerobic Bacteria,' commonly known in clinical microbiology as 'The Orange Book.' The cover features the Centers for Disease Control and Prevention (CDC) logo at the top. The background consists of a red-and-white stippled pattern that visually resembles a high-magnification view of bacterial colonies or microscopic features. The text identifies several key contributors, including Robbin S. Weyant, C. Wayne Moss, Robert E. Weaver, Dannie G. Hollis, Jean G. Jordan, Ellen C. Cook, and Maryam I. Daneshvar. This resource is a definitive laboratory reference for the characterization and identification of rare or difficult-to-culture human pathogenic bacteria, serving as a critical tool for medical microbiologists and infectious disease specialists in diagnostic and public health settings.
Aerobic and Anaerobic Bacteria
1. Classification by Oxygen Requirement
| Category | Oxygen Requirement | Energy Source | Examples |
|---|---|---|---|
| Obligate Aerobes | Must have O2 | Aerobic respiration only | Mycobacterium tuberculosis, Bacillus spp., Nocardia |
| Obligate Anaerobes | Cannot tolerate O2 (killed by it) | Fermentation only | Clostridium, Bacteroides, Fusobacterium |
| Facultative Anaerobes | Grow with or without O2 (prefer O2) | Respiration > fermentation | E. coli, Staphylococcus, Enterobacteriaceae, Streptococcus |
| Microaerophiles | Need low O2 (2-10%) | Aerobic respiration at low pO2 | Campylobacter, Helicobacter pylori |
| Aerotolerant Anaerobes | Tolerate O2 but don't use it | Fermentation always | Lactobacillus spp. |
Jawetz, Melnick & Adelberg's Medical Microbiology, 28e (Glossary, p. 313)
2. Aerobic Bacteria - Key Concepts
- Require O2 as the terminal electron acceptor in oxidative phosphorylation
- Possess cytochrome systems to metabolize oxygen
- Produce superoxide dismutase (SOD) and catalase to neutralize toxic oxygen radicals:
- SOD: O2⁻ + O2⁻ + 2H⁺ → H2O2 + O2
- Catalase: 2H2O2 → 2H2O + O2 (produces gas bubbles)
- Can completely oxidize glucose to CO2 via the TCA cycle, yielding maximum ATP
3. Anaerobic Bacteria - Key Concepts
- Do not use oxygen for growth or metabolism; obtain energy from fermentation reactions
- Defined functionally as failing to grow on solid medium in 10% CO2 in ambient air (Jawetz)
- Lack cytochrome systems for oxygen metabolism
- Lack or have minimal SOD and catalase - cannot neutralize toxic oxygen products (H2O2, superoxide)
- Require a low oxidation-reduction (redox) potential (Eh) - some require Eh as low as -300 mV
- Oxygen tolerance is a continuum - some are killed by 0.5% O2, others can survive at 2-8% O2
"Many of the more virulent anaerobic pathogens are able to produce antioxidant enzymes like catalase or superoxide dismutase" - explaining why species like Bacteroides fragilis are more pathogenic.
| Organism | Gram Stain | Normal Habitat | Associated Infections |
|---|---|---|---|
| Bacteroides fragilis | Gram-negative bacillus | Intestine | Intra-abdominal abscess |
| Clostridioides difficile | Gram-positive bacillus | Intestine | Pseudomembranous colitis |
| Clostridium perfringens | Gram-positive bacillus | Intestine/skin | Gas gangrene, food poisoning |
| Clostridium tetani | Gram-positive bacillus | Soil/gut | Tetanus |
| Fusobacterium | Gram-negative bacillus | Mouth | Periodontal disease, Lemierre syndrome |
| Peptostreptococcus | Gram-positive coccus | Mouth/vagina | Abscess, polymicrobial infections |
| Veillonella | Gram-negative coccus | Mouth/intestine | Oral infections |
4. Why Anaerobes Cause Infections in Specific Sites
- Dental/oral infections (periodontal disease, dental abscesses)
- Aspiration pneumonia (necrotic lung tissue)
- Intra-abdominal infections (bowel perforation)
- Pelvic inflammatory disease
- Decubitus/pressure ulcers and diabetic foot infections
- Head and neck infections
5. Identification Algorithms
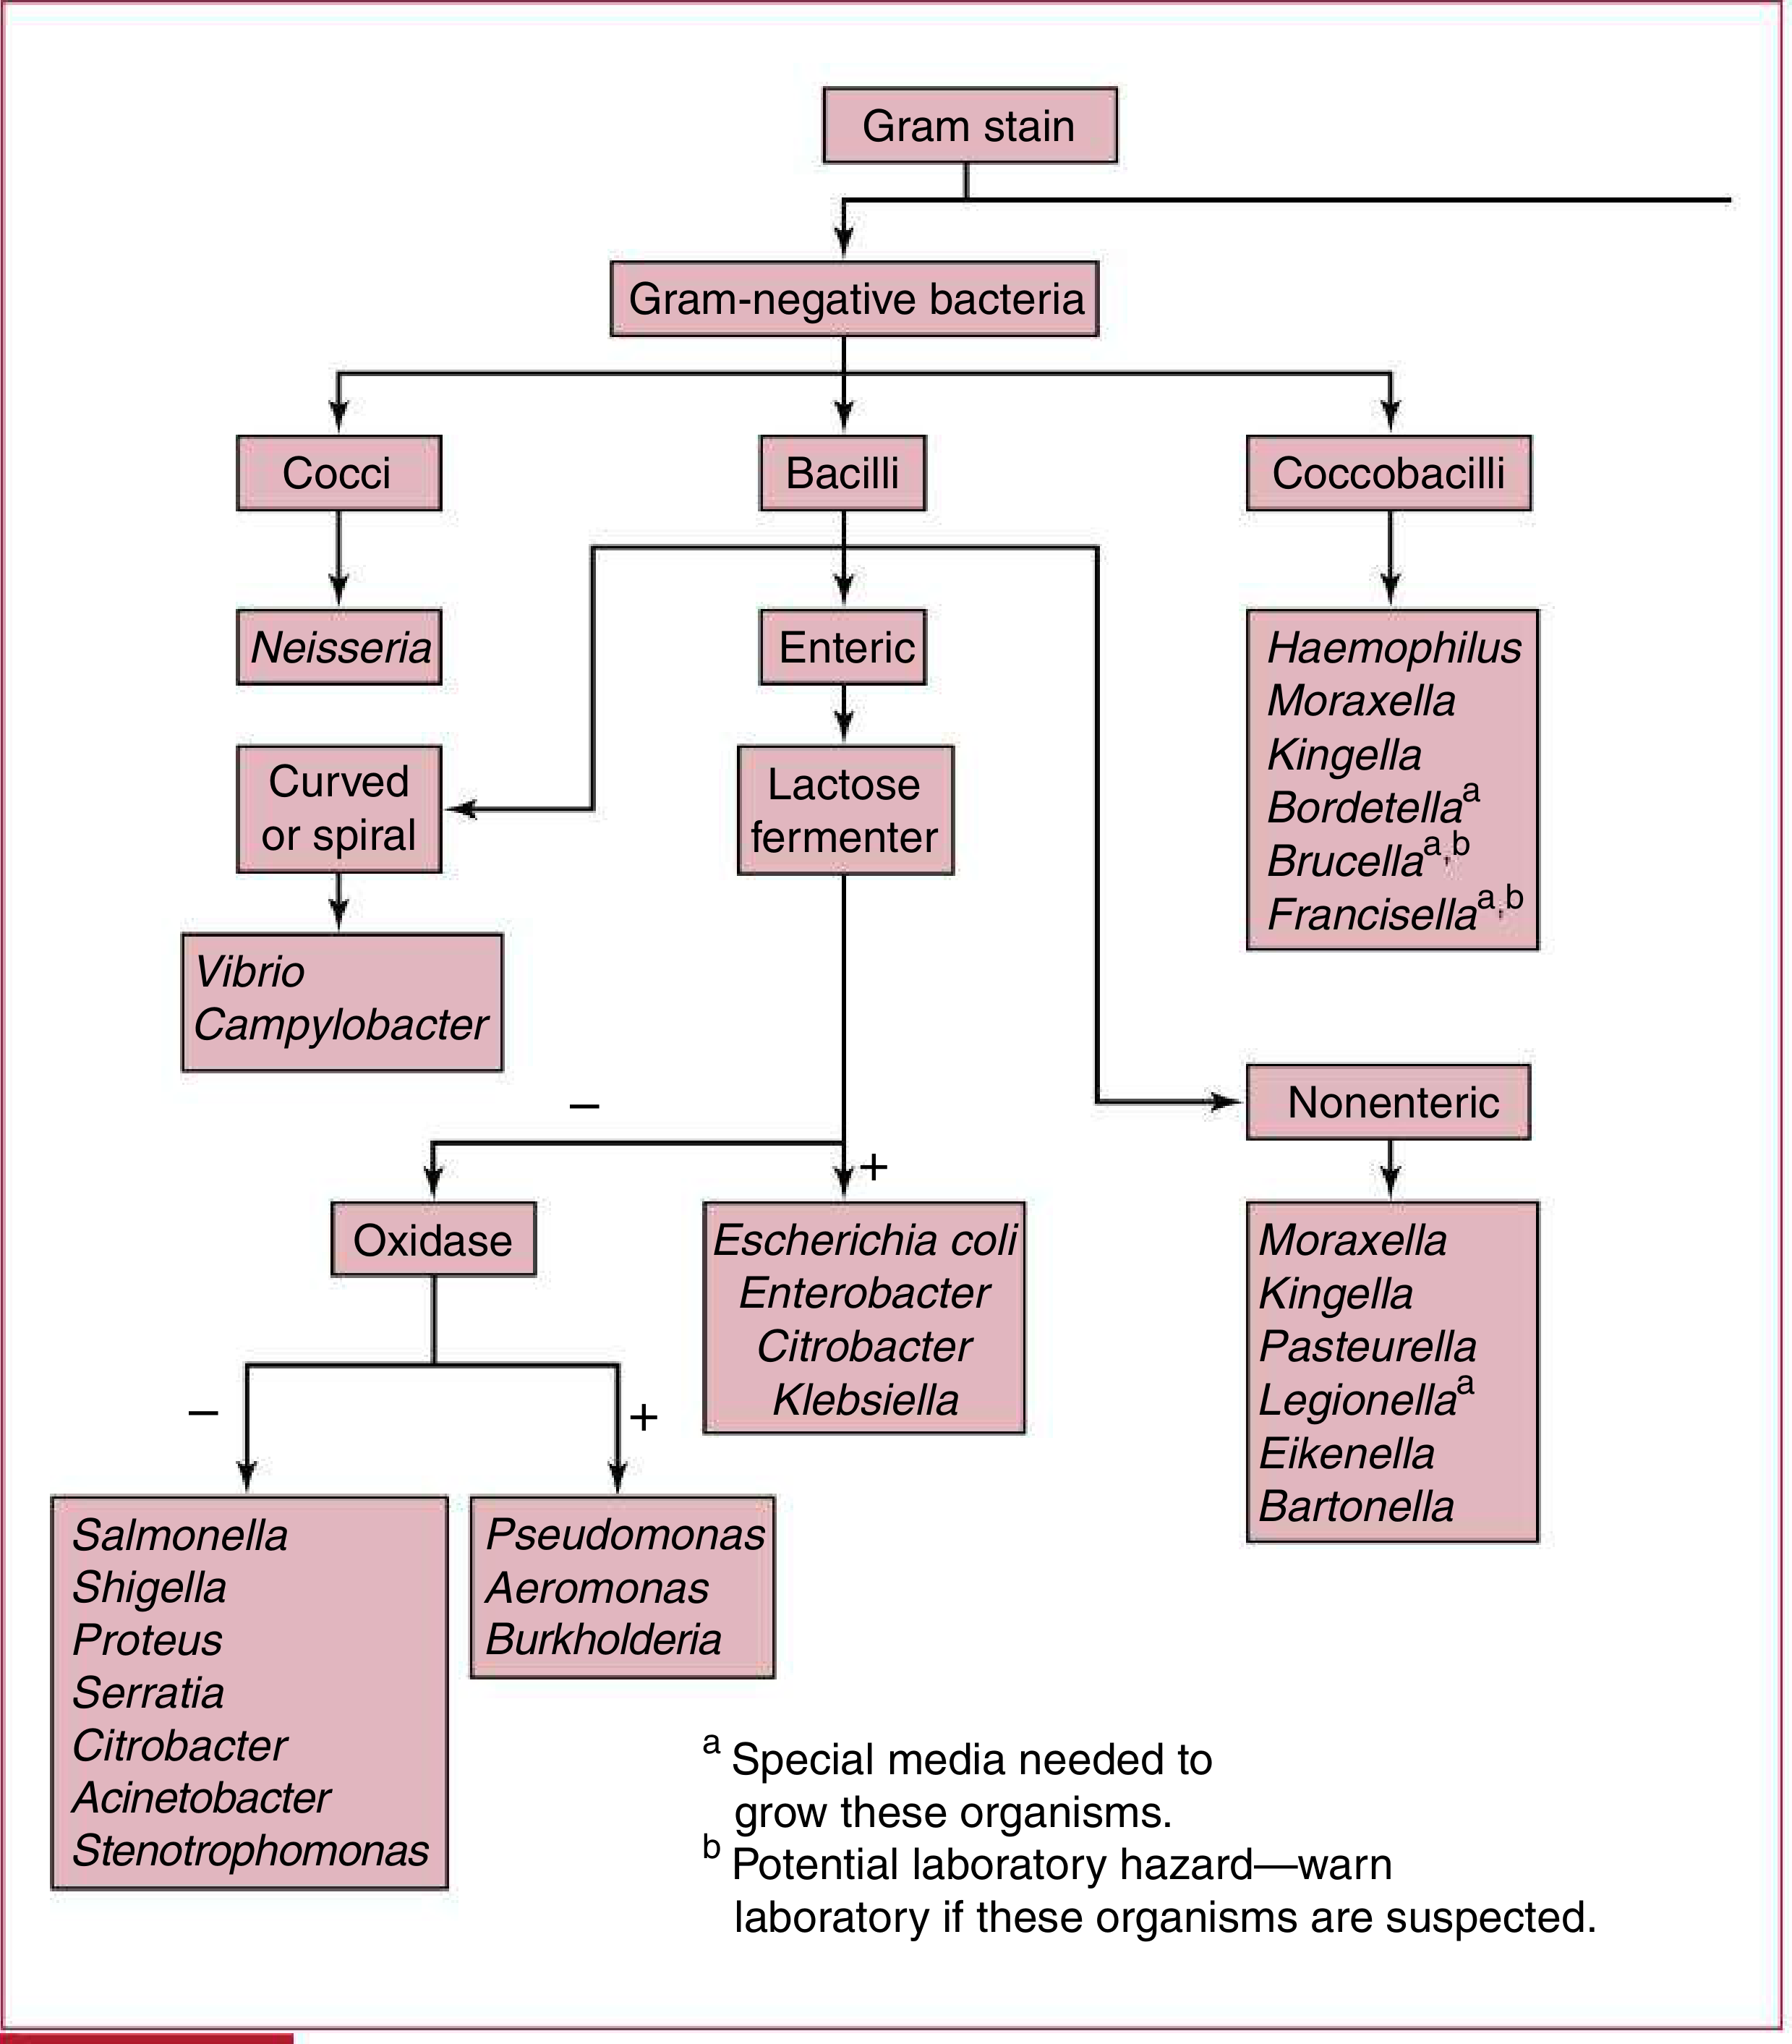
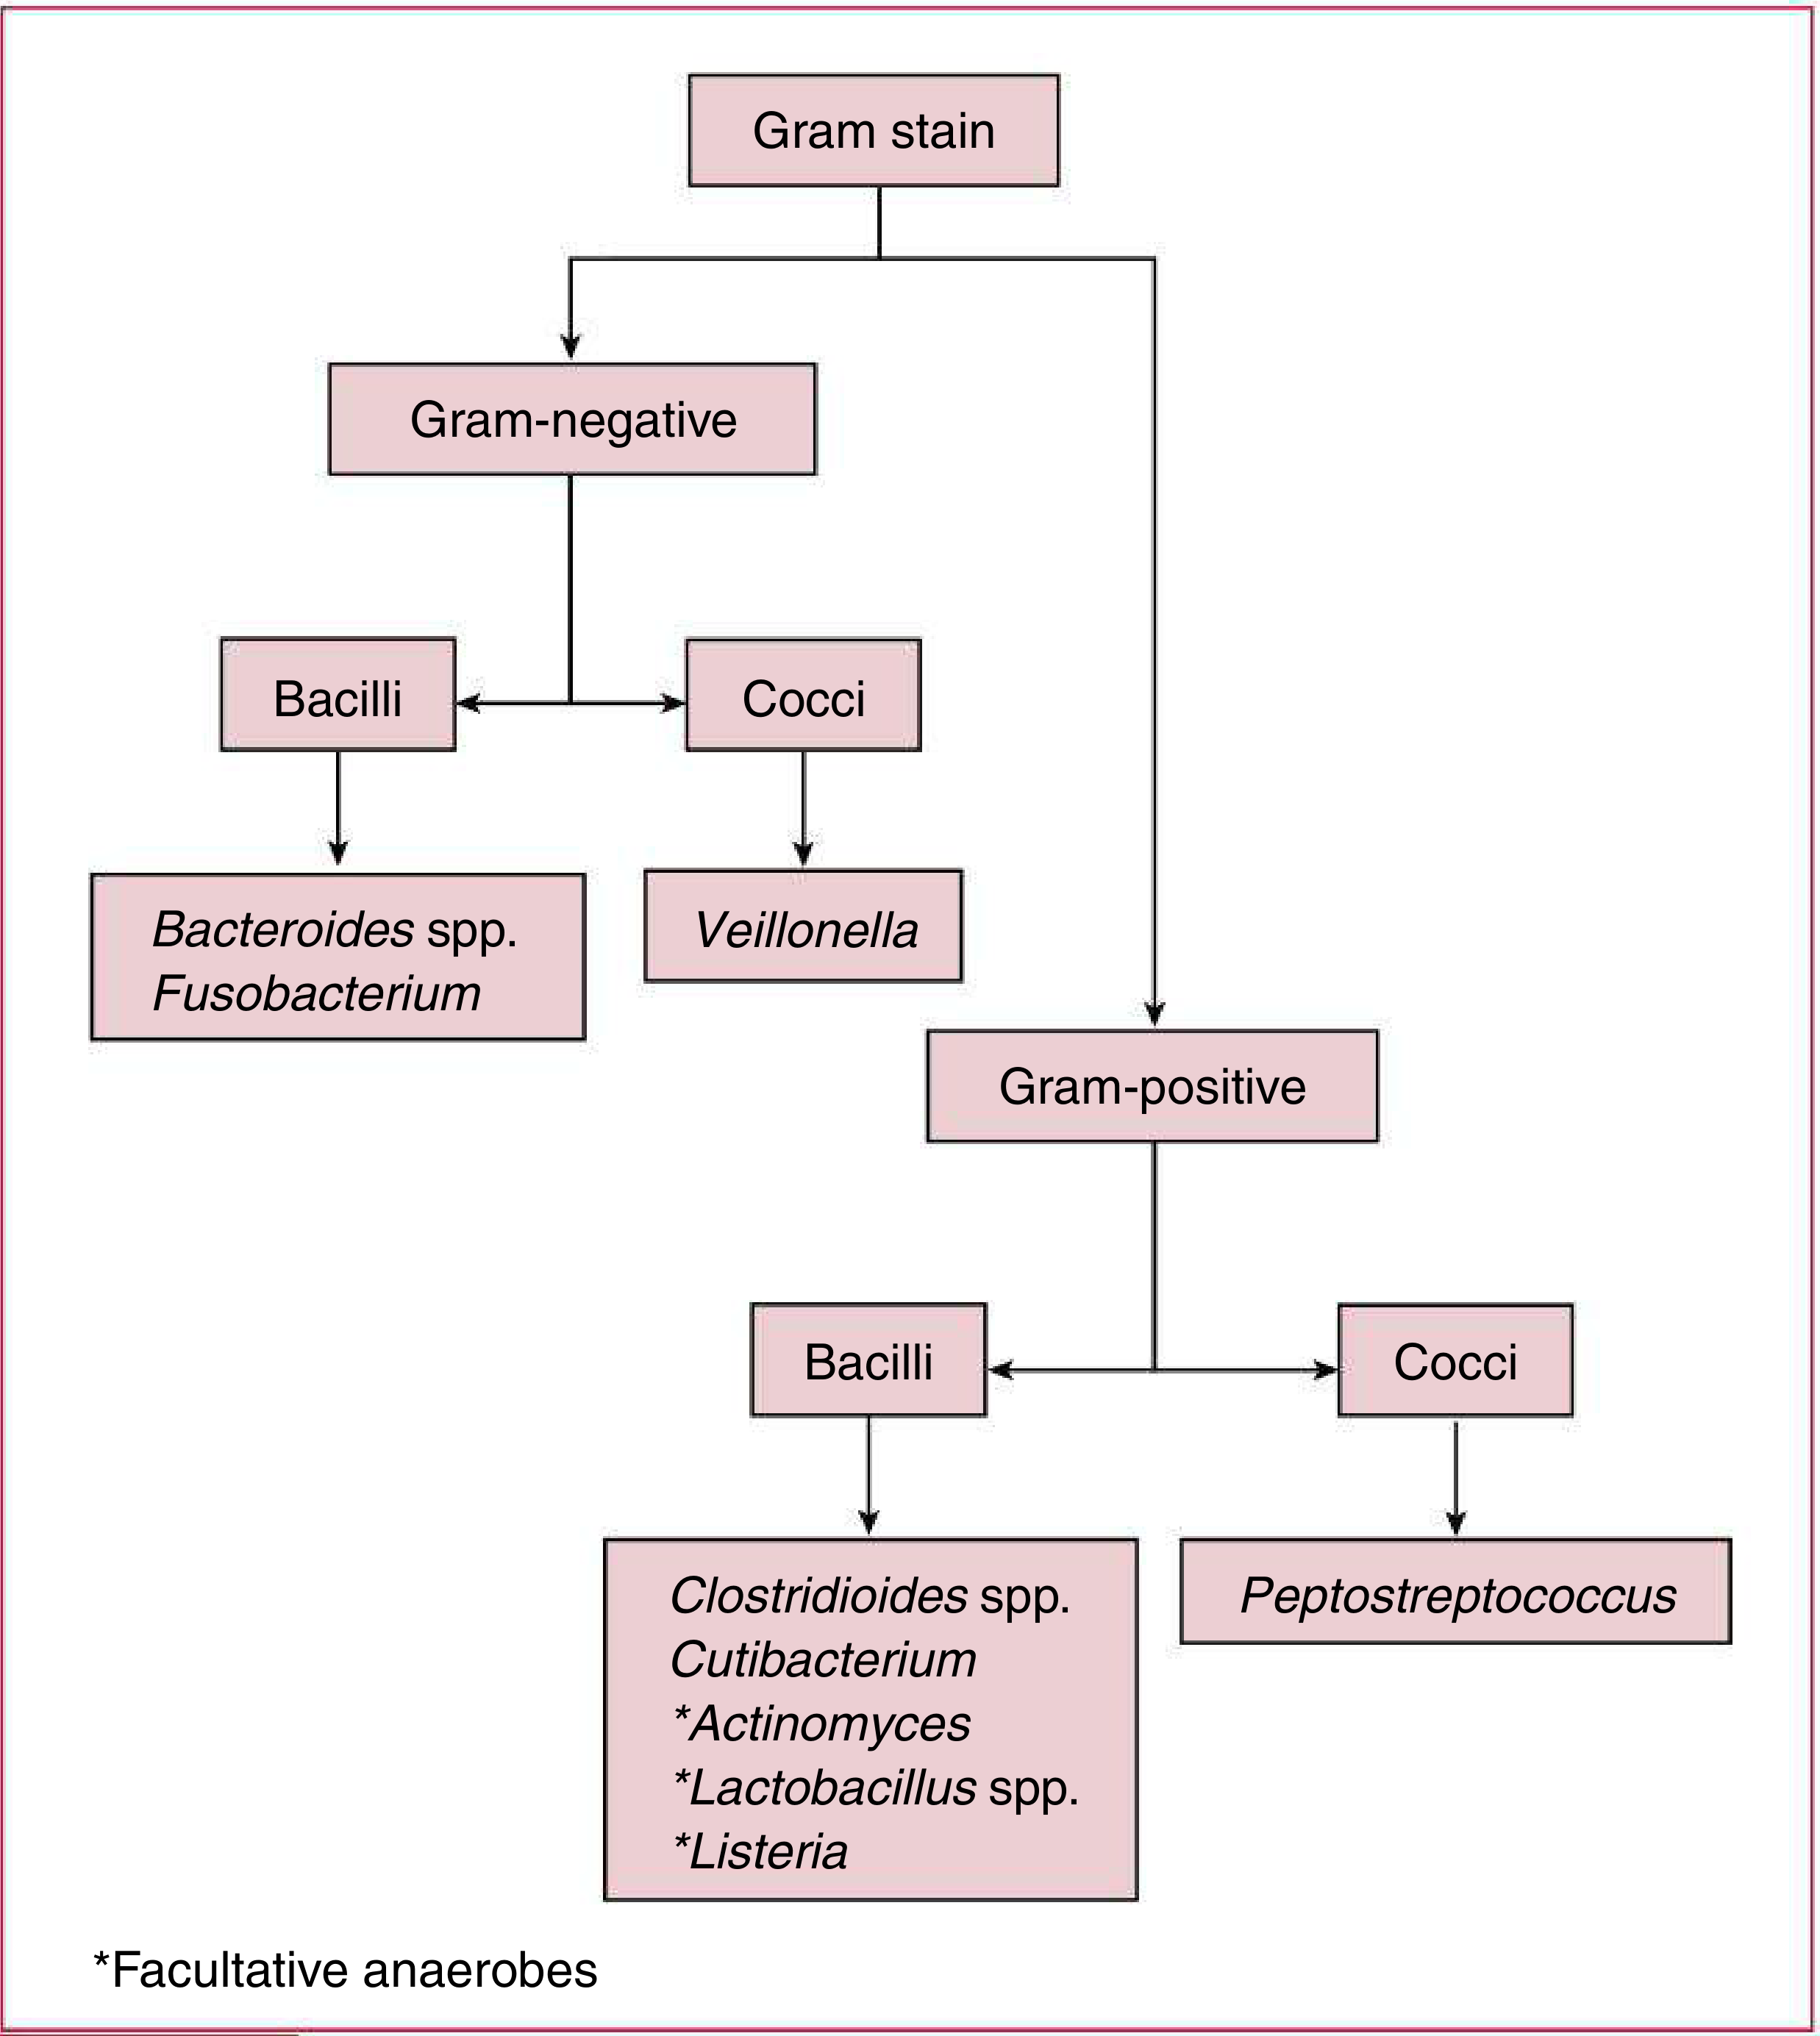
6. Energy Metabolism Comparison
| Process | Aerobic | Anaerobic |
|---|---|---|
| Terminal electron acceptor | O2 | Organic compounds (fermentation) or inorganic (e.g., NO3⁻, SO4²⁻) in anaerobic respiration |
| ATP yield from glucose | ~36-38 ATP | 2 ATP (fermentation) |
| End products | CO2 + H2O | Acids, alcohols, gases (CO2, H2, CH4) |
| Mechanism | Oxidative phosphorylation via ETC | Substrate-level phosphorylation |
7. Clinical Clues Suggesting Anaerobic Infection
- Foul-smelling discharge (from short-chain fatty acid end products)
- Gas in tissues on imaging (produced by fermentation)
- Infection near mucosal surfaces with normal anaerobic flora
- Necrotic tissue / poor blood supply
- Negative standard aerobic cultures despite obvious infection
- Polymicrobial infection
8. Culture and Lab Considerations
- Anaerobes require special transport media (e.g., anaerobic blood agar - CDC, Schaedler, Brucella agars) and anaerobic incubation chambers
- Molecular assays (PCR-based) are increasingly replacing culture-based ID
- Thioglycolate broth supports aerobic and facultatively anaerobic bacteria growth
- The Harriet Lane Handbook notes: "Molecular assays for identification of bacteria and antibiotic resistance are increasingly available"
- Jawetz, Melnick & Adelberg's Medical Microbiology, 28e - pp. 313-315 (Glossary, Physiology & Growth)
- Sherris & Ryan's Medical Microbiology, 8e - pp. 1138-1139 (Anaerobes classification)
- Goldman-Cecil Medicine, 2-volume set - Pathobiology section on anaerobic bacteria
- Medical Microbiology 9e - Metabolism of aerobic/anaerobic respiration
- The Harriet Lane Handbook, 23e - Figs. 17.4 & 17.5 (Identification algorithms)