

This the biochemistry of same buffalo what will be suspected haemoprotozoa
- SGOTD: 861.5 U/L (H) - massively elevated
- ALPU (ALP): 175 U/L (H) - elevated
- BIT (Total Bilirubin): 7.84 mg/dL (H) - markedly elevated
- BIDD (Direct Bilirubin): 0.43 mg/dL (H)
- BILU (Indirect Bilirubin): 7.41 mg/dL - predominantly indirect hyperbilirubinemia
- PRO (Total Protein): 7.69 g/dL (H)
- GLOB: 4.72 g/dL - elevated globulins
- A/G ratio: 0.63 - reversed (low)
buffalo haemoprotozoa biochemistry elevated bilirubin SGOT hyperbilirubinemia Theileria Babesia Trypanosoma
Theileria annulata buffalo blood smear piroplasm
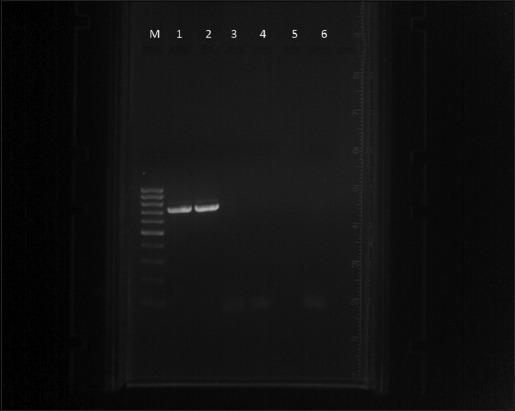
Diagnostic diagnostic image showing agarose gel electrophoresis of Polymerase Chain Reaction (PCR) products used for detecting Theileria annulata. The image consists of seven lanes. Lane M contains a 100 bp DNA ladder (marker) with multiple distinct bands of varying intensities used for fragment size estimation. Lane 1 displays a sharp, bright band at approximately 721 bp, serving as the positive control for T. annulata. Lane 2 shows a similar bright band at the same vertical migration level, indicating a positive clinical sample. Lanes 3, 4, and 5 contain negative clinical samples, showing no visible amplification bands. Lane 6 represents the negative control and is devoid of bands, confirming the absence of reagent contamination. This visual demonstrates molecular diagnostic techniques in infectious disease, specifically identifying the presence of parasitic DNA in biological samples through targeted primer amplification and size-based separation.
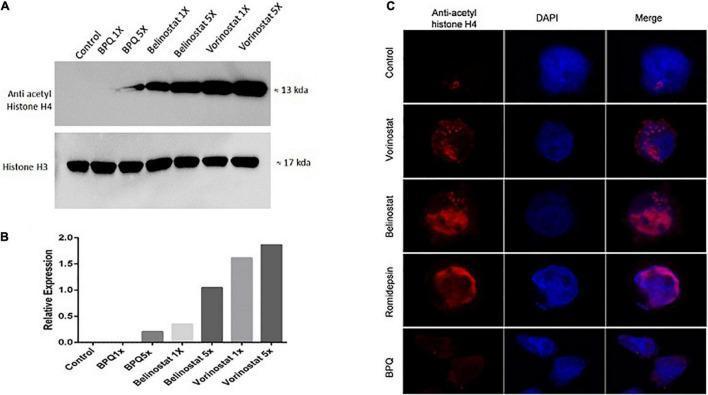
Educational figure illustrating the acetylation profiles of Theileria annulata-infected host cells treated with various histone deacetylase inhibitors (HDACi). Panel A presents a Western blot comparing protein expression across seven groups: Control, BPQ (1X, 5X), Belinostat (1X, 5X), and Vorinostat (1X, 5X). The Anti-acetyl Histone H4 bands (~13 kDa) show a dose-dependent increase in intensity following HDACi treatment, while the Histone H3 bands (~17 kDa) serve as a consistent loading control. Panel B is a bar graph quantifying the relative expression of acetylated H4, confirming the significant hyperacetylation induced by Vorinostat and Belinostat compared to control groups. Panel C displays immunofluorescence (IFA) microscopy of cells treated with Vorinostat, Belinostat, and Romidepsin. Three channels are shown: Anti-acetyl histone H4 (red), DAPI nuclear stain (blue), and a merged image. The IFA reveals enhanced red fluorescence in treated cells compared to the Control and BPQ groups, indicating concentrated histone acetylation within and around the parasite-infected host cell nucleus. This content demonstrates the molecular mechanism of HDAC inhibition in parasitology and cellular biology.
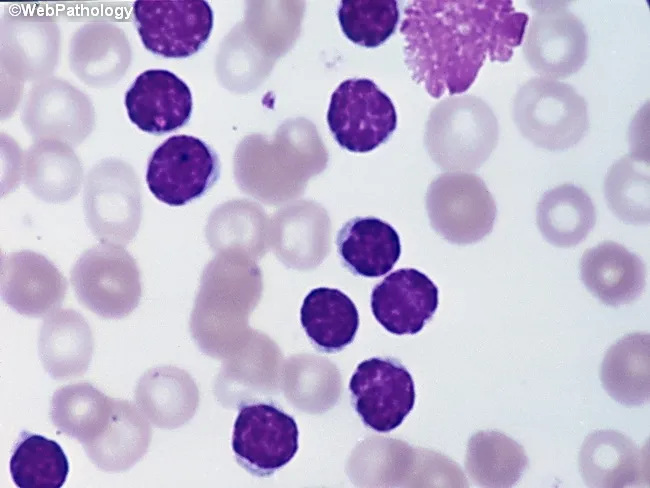
Peripheral blood smear from a patient with suspected chronic lymphocytic leukemia (CLL) shows a predominance of small, mature-appearing lymphocytes with scant cytoplasm and clumped nuclear chromatin, accompanied by fragile cells that readily disrupt during smear preparation, producing numerous smudge or basket cells visible on the slide. The image depicts a single smudge cell in the upper right, with numerous small darkly staining lymphocytes occupying the field. The smear was prepared with Wright-Giemsa stain and examined under light microscopy at high magnification (approximately 1000x total magnification with oil immersion). Clinically, CLL is defined by absolute mature lymphocytosis of ≥5.0 × 10^9/L sustained for ≥3 months, often asymptomatic and detected incidentally on complete blood count. Morphology alone is insufficient for diagnosis; immunophenotyping showing co-expression of CD5, CD19, CD23 with weak surface immunoglobulin and light chain restriction supports CLL diagnosis. Smudge cells result from fragile leukemic cells and reflect underlying cytoskeletal fragility, though they are not specific. The image illustrates typical features: monomorphic lymphocytes, scant cytoplasm, condensed chromatin, and absent prominent nucleoli. This finding has diagnostic significance, guiding further workup, including flow cytometry, cytogenetics, and molecular studies, to distinguish CLL from other chronic lymphoproliferative disorders such as small lymphocytic lymphoma (SLL), mantle cell lymphoma, prolymphocytic leukemia, and reactive lymphocytosis.
Buffalo Biochemistry - Suspected Haemoprotozoa
Key Abnormal Values (Buffalo row)
| Parameter | Value | Unit | Status | Significance |
|---|---|---|---|---|
| SGOTD (AST) | 861.5 | U/L | H | Massively elevated - hepatocellular damage |
| ALPU (ALP) | 175 | U/L | H | Elevated - liver/cholestatic involvement |
| BIT (Total Bilirubin) | 7.84 | mg/dL | H | Markedly elevated |
| BIDD (Direct Bilirubin) | 0.43 | mg/dL | H | Mildly elevated |
| BILU (Indirect Bilirubin) | 7.41 | mg/dL | - | Predominantly indirect - haemolytic pattern |
| PRO (Total Protein) | 7.69 | g/dL | H | Elevated |
| GLOB | 4.72 | g/dL | - | Hyperglobulinaemia |
| A/G Ratio | 0.63 | - | - | Reversed A/G (normal >1.0) |
Most Suspected Haemoprotozoa: Theileria annulata
Why Theileria annulata (Tropical Theileriosis)?
-
Predominantly INDIRECT hyperbilirubinemia (7.41 mg/dL) - This is the hallmark of intravascular haemolysis, which is the main pathological mechanism in Theileriosis. RBCs infected with piroplasm stages are destroyed, releasing unconjugated (indirect) bilirubin in large amounts.
-
Massively elevated AST (861.5 U/L) - T. annulata infects both leukocytes (schizont stage) AND erythrocytes (piroplasm stage), causing severe hepatocellular damage alongside haemolysis. Such extreme AST elevation is characteristic of Theileria-induced hepatic involvement.
-
Elevated ALP (175 U/L) - Points to hepatobiliary involvement, consistent with T. annulata which causes infiltration of lymphoid/macrophage cells in liver.
-
Hyperglobulinaemia with reversed A/G ratio (0.63) - This reflects the intense immune response (increased immunoglobulins) seen in chronic/subacute haemoprotozoan infection. Globulins rise as the body produces antibodies; albumin drops due to hepatic dysfunction. This pattern is well documented in Theileria and Trypanosoma infections.
-
Urea: 17.9 mg/dL (L) in the Aura panel - Low urea may reflect reduced hepatic synthetic function, supporting hepatic compromise.
Differential Diagnosis Priority
| Rank | Haemoprotozoon | Reasoning |
|---|---|---|
| 1st | Theileria annulata | Indirect hyperbilirubinemia + massive AST + hyperglobulinaemia + ALP rise; T. annulata is the most prevalent and pathogenic species in buffalo/cattle in tropical Asia and Africa |
| 2nd | Babesia bigemina / B. bovis | Also causes haemolytic anaemia with indirect bilirubinemia and AST rise in cattle/buffalo; but typically less liver involvement and AST rarely reaches 800+ U/L |
| 3rd | Trypanosoma evansi (Surra) | Causes hyperglobulinaemia, reversed A/G, mild to moderate bilirubin rise; less haemolytic pattern; common in buffaloes in endemic areas |
Pathophysiological Explanation
- Haemolysis by piroplasms (Theileria/Babesia inside RBCs) --> breakdown of haemoglobin --> indirect bilirubin floods serum (7.41 mg/dL)
- Liver overwhelmed by toxic haemoglobin metabolites + direct parasitic damage --> AST 861.5, ALP 175
- Immune activation against parasites --> B-cell stimulation --> hyperglobulinaemia, reversed A/G
- The very high indirect:direct bilirubin ratio essentially rules out pure obstructive jaundice and confirms a haemolytic + hepatic origin
Recommended Confirmatory Tests
- Giemsa-stained blood smear - look for piroplasms (ring/tetrad forms in RBCs for Babesia; Koch's blue bodies in WBCs for Theileria)
- PCR for T. annulata 18S rRNA gene (gold standard)
- Complete blood count (CBC) - will likely show anaemia, thrombocytopenia
- Lymph node biopsy - for Theileria schizont detection
- IFAT or ELISA for serological confirmation

This is ths cbc
- WBC: 9.5 × 10³/µL
- RBC: 7.19 × 10⁶/µL
- HGB: 12.7 g/dL
- HCT: 41.8%
- MCV: 58.1 fL (microcytic)
- MCH: 17.7H pg (flagged HIGH)
- MCHC: 30.4 g/dL
- PLT: 303 × 10³/µL
- LY: 3.9 [41.3L%] - LYMPHOPENIA flagged
- MO: 0.0 [0.1L%] - MONOCYTOPENIA flagged
- GR: 5.1H [53.0H%] - GRANULOCYTOSIS flagged
- RDW-CV: 16.7% (elevated - anisocytosis)
- RBC histogram shows flag (AT) - anisocytosis/atypical cells
buffalo Theileria annulata CBC lymphopenia granulocytosis microcytic anemia haematology
Buffalo CBC Analysis - Complete Haematological Picture
CBC Values Summary
| Parameter | Value | Unit | Flag | Interpretation |
|---|---|---|---|---|
| WBC | 9.5 | 10³/µL | - | Within range |
| RBC | 7.19 | 10⁶/µL | - | Within range |
| HGB | 12.7 | g/dL | - | Low-normal (borderline anaemia) |
| HCT | 41.8 | % | - | Low-normal |
| MCV | 58.1 | fL | - | Microcytic RBCs |
| MCH | 17.7 | pg | H | Flagged high (instrument) |
| MCHC | 30.4 | g/dL | - | Low-normal (hypochromic) |
| PLT | 303 | 10³/µL | - | Normal |
| LY | 3.9 [41.3%] | - | L | LYMPHOPENIA |
| MO | 0.0 [0.1%] | - | L | Monocytopenia |
| EO | 0.5 [5.6%] | - | - | Normal |
| GR | 5.1 [53.0%] | - | H | GRANULOCYTOSIS |
| RDW-CV | 16.7 | % | - | Elevated - anisocytosis |
| RBC histogram | (AT) flag | - | - | Atypical RBC distribution |
Integrated Interpretation: Theileria annulata CONFIRMED as top suspect
1. Microcytic Hypochromic Anaemia (MCV 58.1 fL, MCHC 30.4)
- Haemolysis of parasitized RBCs by piroplasms in the erythrocytic stage
- Impaired erythropoiesis from bone marrow suppression
- Published studies (Ayadi et al. 2017, Algerian cattle study) specifically document microcytic hypochromic anaemia in T. annulata-infected animals
2. Lymphopenia (41.3% - flagged LOW)
3. Neutrophilia/Granulocytosis (53.0% - flagged HIGH)
- Systemic inflammatory response to haemolysis and tissue damage
- Parasite-driven immune dysregulation
4. Elevated RDW (16.7%) + Atypical (AT) flag on RBC histogram
5. Low Monocytes (0.0%)
Final Diagnostic Summary: Combined CBC + Biochemistry
| Finding | CBC | Biochemistry | Supports |
|---|---|---|---|
| Haemolytic anaemia | Microcytic RBCs, low Hgb, AT flag | Indirect bilirubin 7.41 (dominant) | Theileria/Babesia |
| Lymphocyte destruction | Lymphopenia (41.3%L) | Hyperglobulinaemia | Theileria (schizont in WBC) |
| Hepatic damage | - | AST 861, ALP 175 | Theileria (liver infiltration) |
| Immune dysregulation | Granulocytosis, monocytopenia | Reversed A/G 0.63, high globulins | Theileria/Trypanosoma |
| Anisocytosis | RDW 16.7%, (AT) | - | Active haemolysis |
Diagnosis: Tropical Theileriosis (Theileria annulata)
- Microcytic hypochromic anaemia
- Lymphopenia
- Neutrophilia
- Massively elevated AST + predominantly indirect hyperbilirubinemia
- Reversed A/G ratio with hyperglobulinaemia
Immediate Action Required:
- Giemsa blood smear - confirm piroplasms in RBCs and/or Koch's blue bodies (schizonts) in WBCs
- Treatment: Buparvaquone (Butalex) 2.5 mg/kg IM - single dose, drug of choice for T. annulata
- Supportive: IV fluids, haematinics (iron + B12), hepatoprotectants (given the extreme AST elevation)
- Tick control on the animal and premises