
Difference between T score and NZ score
The T-score and Z-score (I'll assume you mean Z-score, as "NZ score" likely refers to it) are both standardized scores used in different contexts. Here's a quick overview:
- T-score: Mean of 50, SD of 10. Used in psychological testing and bone density (DEXA scans).
- Z-score: Mean of 0, SD of 1. Used in statistics to express how many standard deviations a value is from the population mean.
However, if you're asking in a bone densitometry context, both T-score and Z-score are specific DXA measurements with distinct clinical meanings.
Searching sources...
Reading File
Searching the Web
T score vs Z score bone density DXA difference clinical use
Finding Sources
Reading File
Reading File
Let me fetch the diagram that shows the T-score vs Z-score relationship.
Loading Image
Loading Image
I now have excellent textbook content and diagrams. Here is a complete answer:
T-Score vs Z-Score (Bone Densitometry - DXA Scan)
Both scores are generated from a DXA (Dual-energy X-ray Absorptiometry) scan and express bone mineral density (BMD) in standard deviations (SDs) from a reference mean - but they use different reference populations.
Key Difference at a Glance
| Feature | T-Score | Z-Score |
|---|---|---|
| Reference population | Healthy young adults (peak bone mass, ~age 30), matched for sex and race | Age-, sex-, and ethnicity-matched population |
| What it measures | How far BMD deviates from peak healthy bone mass | How far BMD deviates from what is expected for that age |
| Primary use | Diagnosing osteoporosis | Detecting secondary (pathological) bone loss |
| Used in | Postmenopausal women and men ≥50 years | Premenopausal women, men <50, children, adolescents |
| Normal range | ≥ -1.0 | ≥ -2.0 |
| Falls with age? | Yes - T-score worsens as patient ages | Remains relatively stable (age is matched out) |
T-Score in Detail
- Compares your BMD to the peak bone mass of a healthy 30-year-old of the same sex and race.
- The mean is set to 0, with range from +2.5 to -2.5.
- WHO diagnostic thresholds (postmenopausal women and men ≥50):
| T-Score | Diagnosis |
|---|---|
| ≥ -1.0 | Normal |
| -1.0 to -2.5 | Osteopenia (low bone density) |
| ≤ -2.5 | Osteoporosis |
- As a person ages, their BMD declines, so the T-score progressively worsens - even if their bones are normal for their age.
Z-Score in Detail
- Compares your BMD to what is expected for your age, sex, and ethnicity - it "corrects out" the effect of aging.
- Used in: premenopausal women, men <50 years, children.
- A Z-score ≤ -2.0 is defined as "below the expected range for age" and suggests a secondary cause of bone loss should be sought (e.g., glucocorticoid use, malabsorption, hypogonadism, hyperparathyroidism).
- A Z-score can be misleading in postmenopausal women and men >50 because age-related bone loss is "normal" and gets absorbed into the reference - making their bone loss appear less abnormal than it truly is.
The Classic Example (from Harrison's Principles of Internal Medicine)
A 60-year-old woman with a Z-score of -1 (1 SD below mean for her age) has a T-score of -2.5 (2.5 SDs below mean for a young adult). This is because her bone density is typical for a 60-year-old but still far below peak young-adult bone mass.
This is illustrated clearly in the diagram below:
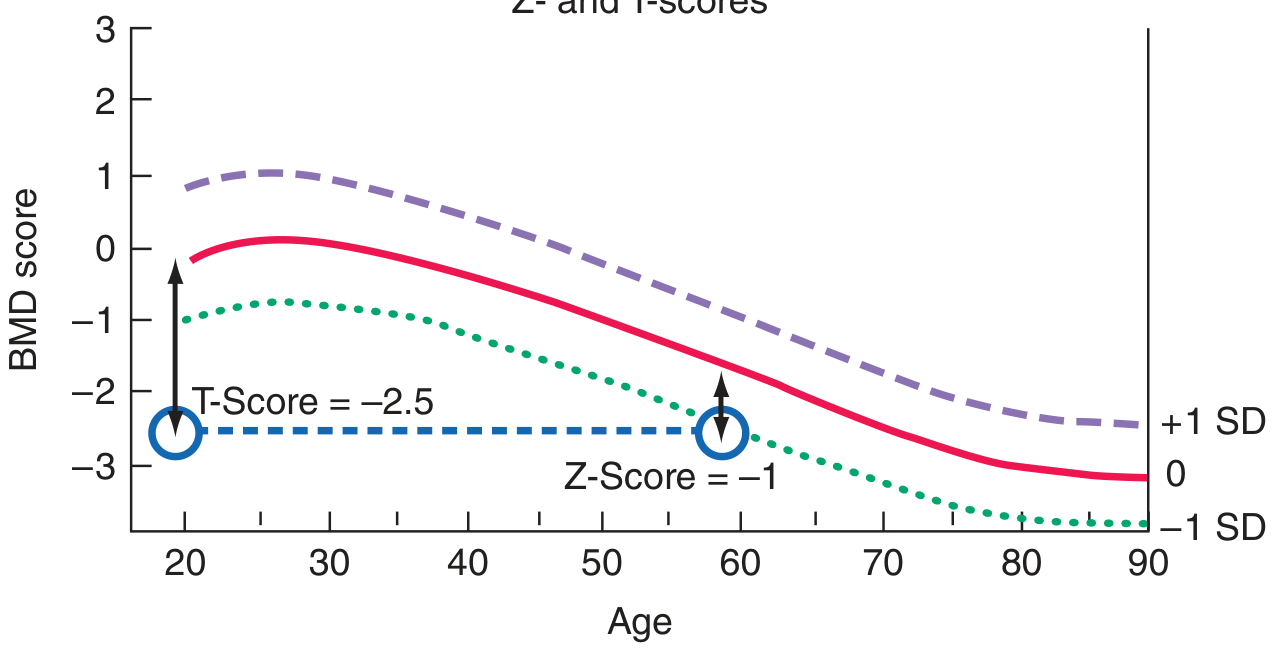
At age 60, a Z-score of -1 corresponds to a T-score of -2.5 (the osteoporosis threshold). At age 20, the same T-score of -2.5 would represent an extreme deviation from the young-adult norm.
This DXA printout from Rheumatology further illustrates how the T and Z reference bands diverge with age (spine L1-L4):
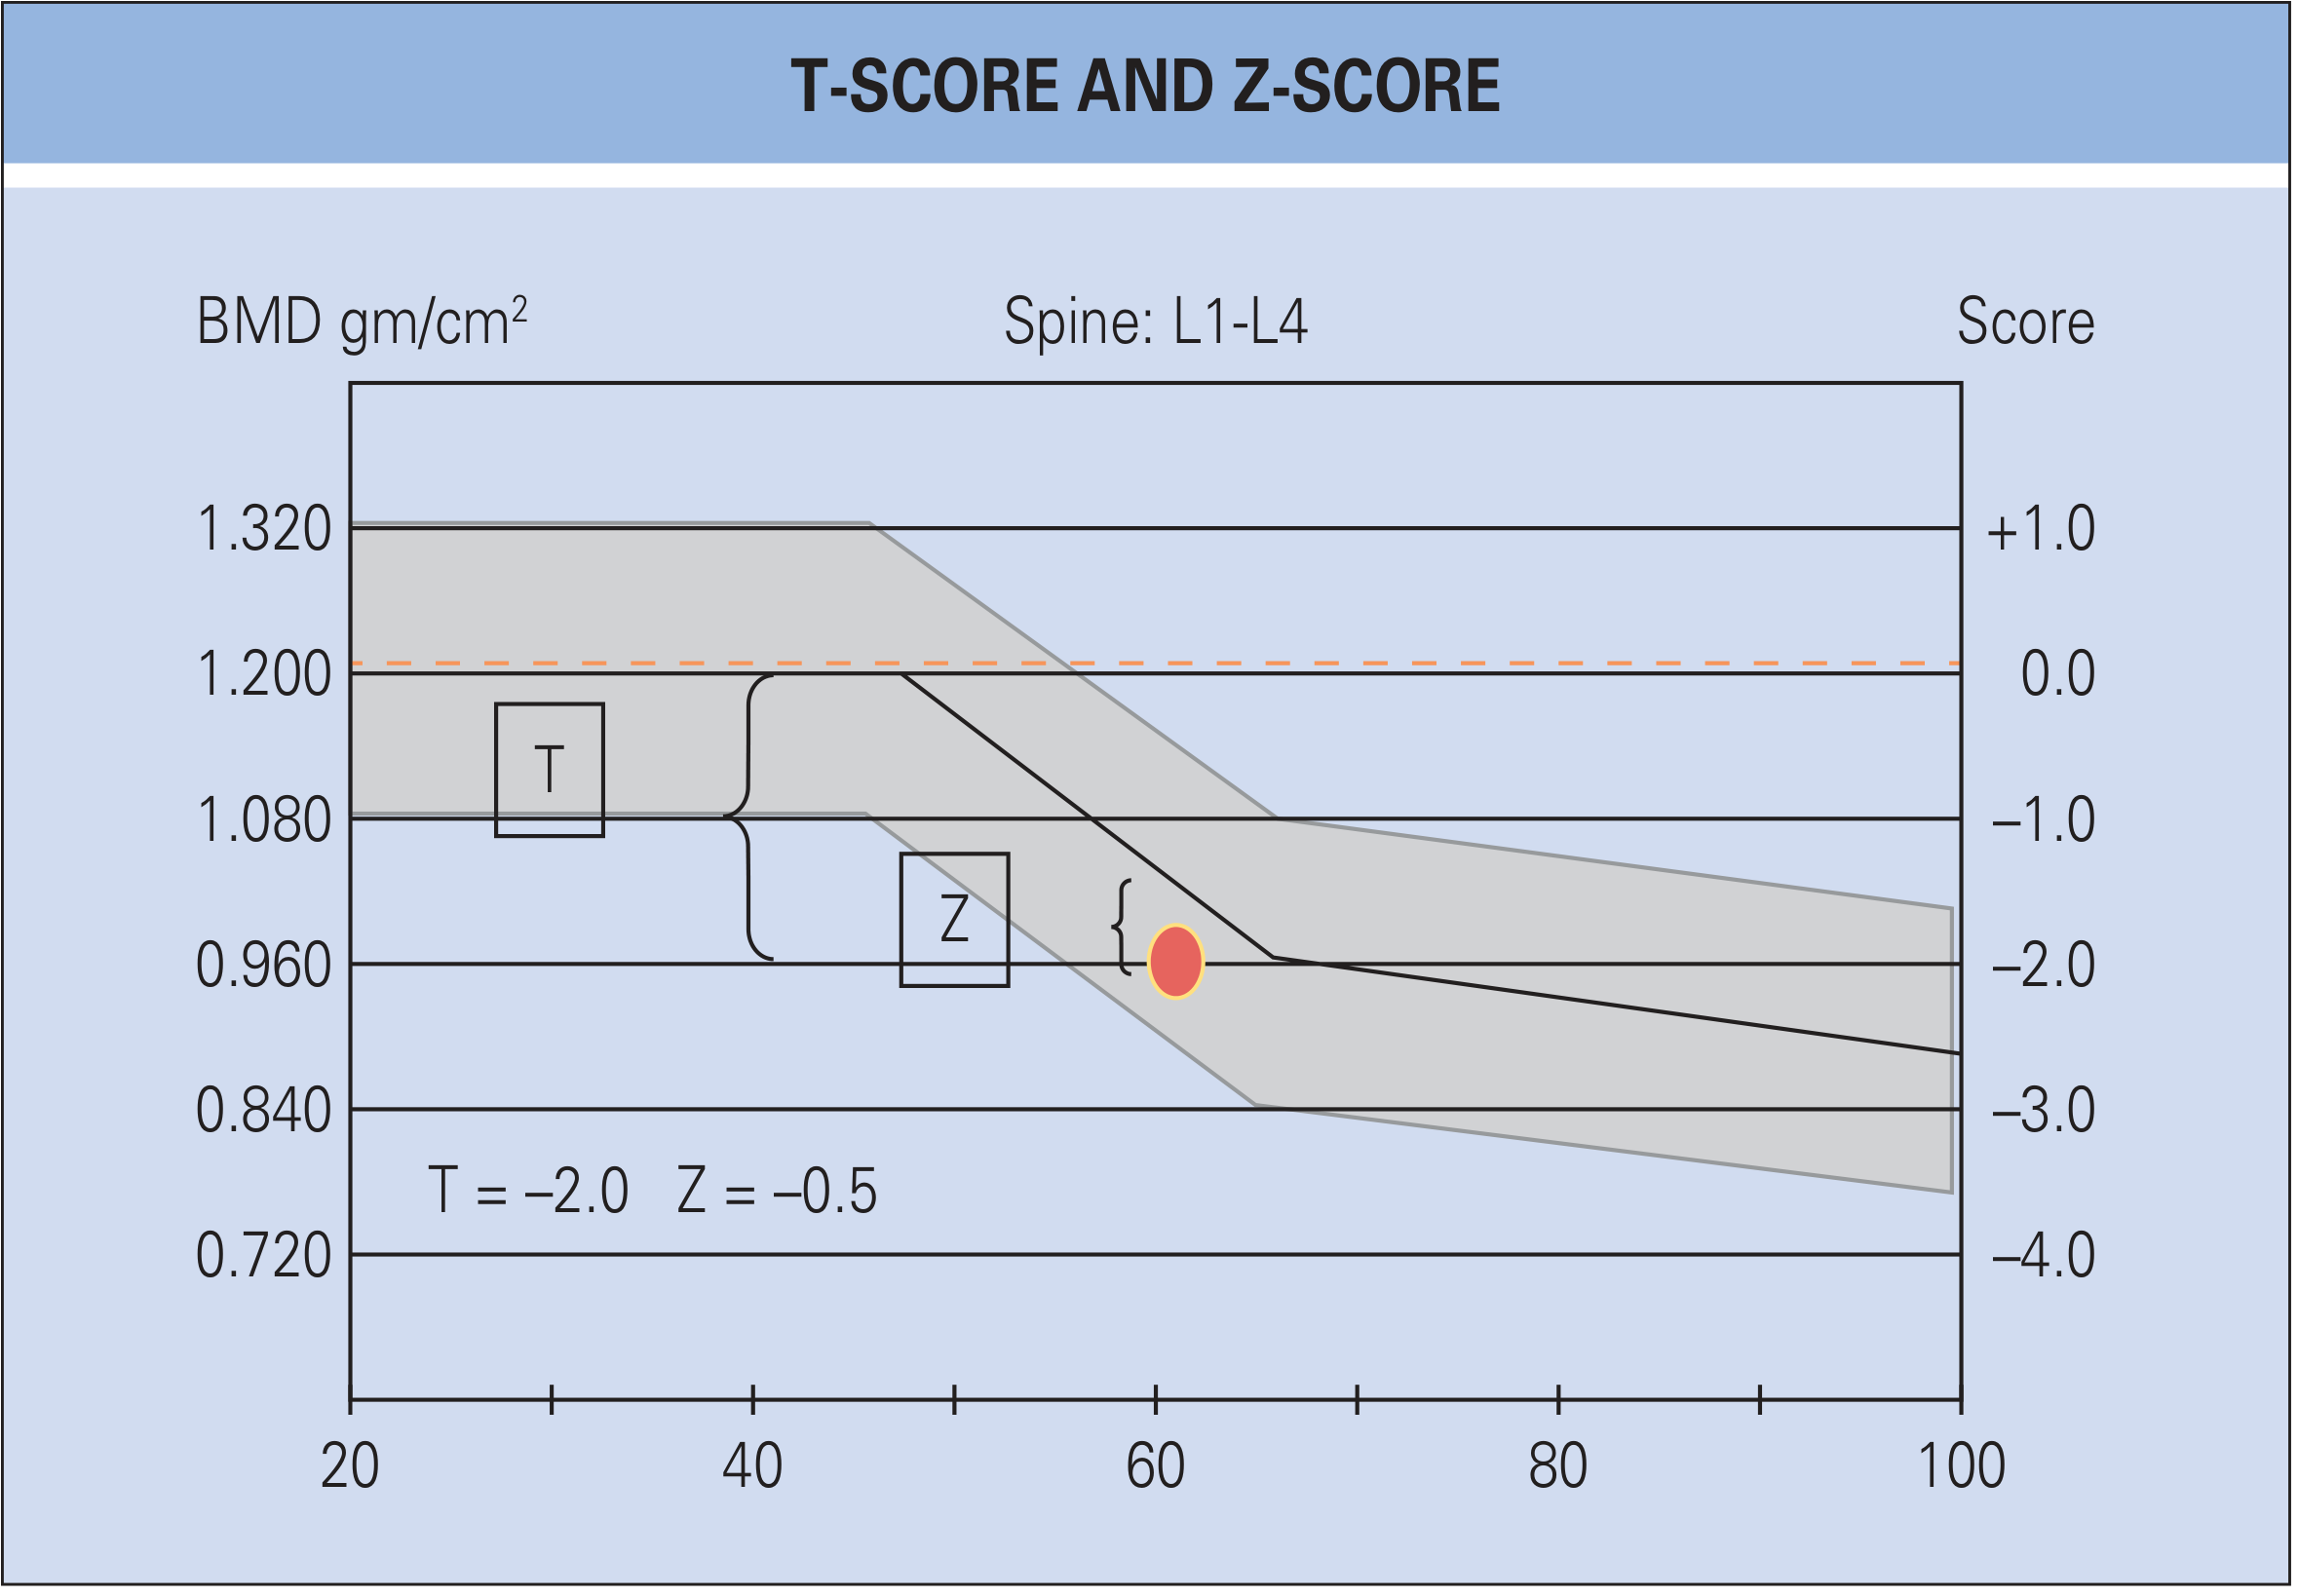
At age 60, the patient's dot (T = -2.0, Z = -0.5) shows that although the T-score places the patient in osteopenia, the Z-score is nearly normal for age - illustrating how these two scores can give very different impressions of the same result.
Why This Distinction Matters Clinically
- T-score drives treatment decisions in older adults - a T-score ≤ -2.5 meets WHO criteria for osteoporosis and typically triggers pharmacological therapy.
- Z-score flags secondary osteoporosis - if the Z-score is unexpectedly low (≤ -2.0) in a young person, it prompts a workup for underlying disease rather than attributing bone loss to aging.
- In children and adolescents, T-scores should never be used because they have not yet reached peak bone mass.
Sources: Harrison's Principles of Internal Medicine 22E, p. 3340; Rheumatology, 2-Volume Set (2022, Elsevier), p. 438; Mayo Clinic DXA scan overview
This is a shared conversation. Sign in to Orris to start your own chat.