
Leukemias for mbbs university examination
acute lymphoblastic leukemia ALL blood smear lymphoblasts
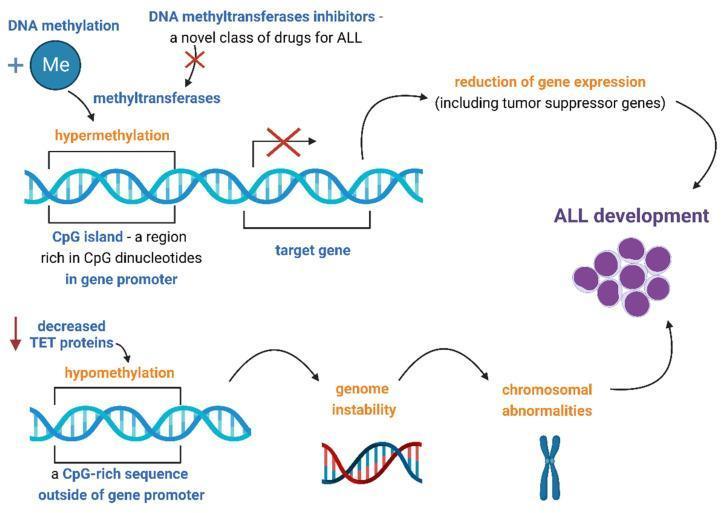
A pathophysiology diagram illustrating the mechanisms of aberrant DNA methylation in the development of pediatric Acute Lymphoblastic Leukemia (ALL). The diagram is divided into two primary epigenetic pathways. The upper pathway shows hypermethylation: DNA methyltransferases add methyl groups (Me) to CpG islands within gene promoters. This leads to the silencing of target genes, specifically tumor suppressor genes, resulting in reduced gene expression and subsequent ALL development. A red inhibition symbol highlights DNA methyltransferase inhibitors as a therapeutic intervention to block this process. The lower pathway depicts hypomethylation occurring at CpG-rich sequences outside of gene promoters, triggered by decreased Ten-Eleven Translocation (TET) proteins. This mechanism results in genome instability and chromosomal abnormalities, further contributing to the development of leukemia cells, which are visually represented by a cluster of purple lymphoblasts. This infographic serves as an educational summary of epigenetic dysregulation and targeted pharmacological strategy in hematologic oncology.
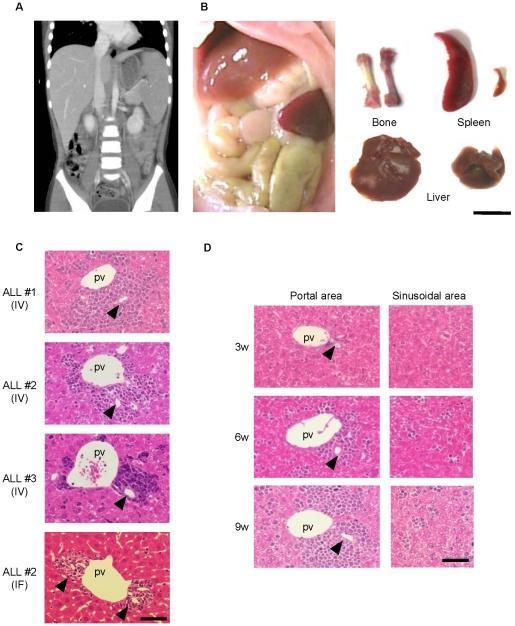
Educational panel demonstrating the clinical and histopathological pathology of Acute Lymphoblastic Leukemia (ALL) in human patients and NOG mouse xenograft models. (A) Coronal CT scan of a human abdomen showing marked hepatosplenomegaly. (B) Macroscopic comparison between normal and leukemic NOG mice organs, highlighting significant splenomegaly, hepatomegaly, and a pale femur (bone marrow) in the leukemic model. (C) H&E-stained histopathological sections of mouse livers across different ALL cases (IV and IF injection routes), showing dense clusters of leukemic lymphoblasts infiltrating the portal areas surrounding the portal vein (pv); arrowheads indicate bile ducts. (D) Sequential histopathological analysis at 3, 6, and 9 weeks post-transplantation, contrasting the progression of leukemic cell accumulation. Large, expanding clusters are visible in the portal area over time, while the sinusoidal areas show only sparse, scattered leukemic cells. This visual evidence supports the portal area as a specific niche for ALL cell harboring and proliferation.
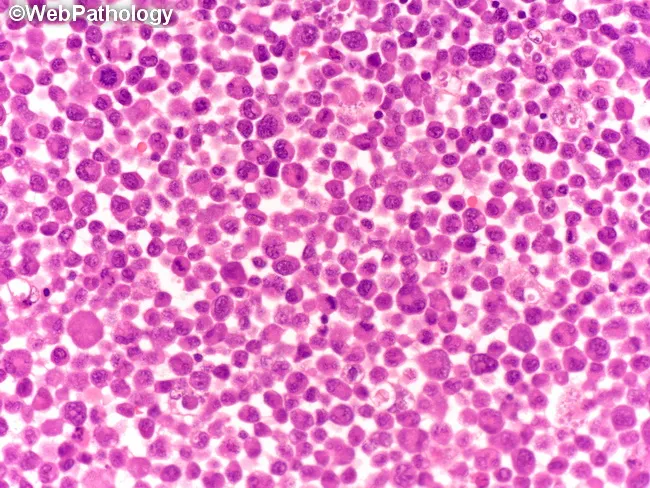
This brightfield light microscopy image depicts a dense bone marrow aspirate smear stained with hematoxylin and eosin. The cellularity is high with a uniform population of small to medium-sized lymphoid cells (lymphoblast-like cells) occupying much of the field. Nuclei are round to ovoid with finely dispersed, coarse chromatin, and scant basophilic cytoplasm; nucleoli are inconspicuous. The architecture is diffuse rather than follicular, with little evidence of erythroid or myeloid precursors; occasional mitotic figures may be present but are not prominent at this magnification. The histology shows a monotonous lymphoid infiltrate, a pattern that raises concern for a lymphoblastic process. Pathologic interpretation would emphasize lymphoid blasts consistent with acute lymphoblastic leukemia or lymphoblastic lymphoma; however, definitive classification requires ancillary studies such as flow cytometry immunophenotyping, immunohistochemistry, and genetic studies (cytogenetics/molecular). Clinically, such a pattern correlates with acute presentations: cytopenias, signs of marrow failure, fatigue, infections, or organomegaly. Potential uses include medical education for recognizing quantitative lymphoid blasts on bone marrow smears, training in differential diagnoses of monomorphic blue cell infiltrates, and optimizing search queries for pathology image datasets. Keywords include: lymphoblasts, pediatric ALL, bone marrow failure, marrow infiltration, hematopathology, immunophenotype, CD markers, prognosis guidance, diagnostic workflow, and educational value overall.
CML chronic myeloid leukemia Philadelphia chromosome blood smear
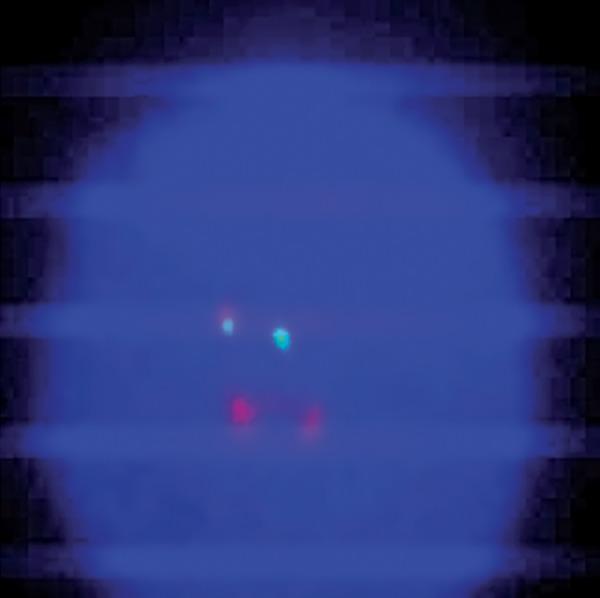
A diagnostic microphotograph of a peripheral blood interphase cell from a patient with Chronic Myeloid Leukemia (CML), analyzed via Fluorescence In Situ Hybridization (FISH). The image demonstrates an atypical BCR-ABL1 translocation pattern using a dual-color, dual-fusion probe. Against the dark blue DAPI-stained nuclear background, four distinct fluorescent signals are visible. The observed configuration is classified as 1F1G2R: one orange/yellow fusion signal (representing the BCR-ABL1 hybrid on the derivative chromosome 22), one green signal (representing the native BCR locus on chromosome 22), and two red signals (representing the native ABL1 locus on chromosome 9). This atypical pattern deviates from the standard 2F1G1R fusion signal usually seen in Philadelphia chromosome-positive cells, indicating clonal evolution or complex chromosomal rearrangements. This image serves as an educational example of cytogenetic variability in hematologic malignancies and the use of FISH for monitoring molecular response in patients undergoing tyrosine kinase inhibitor (TKI) therapy like imatinib.
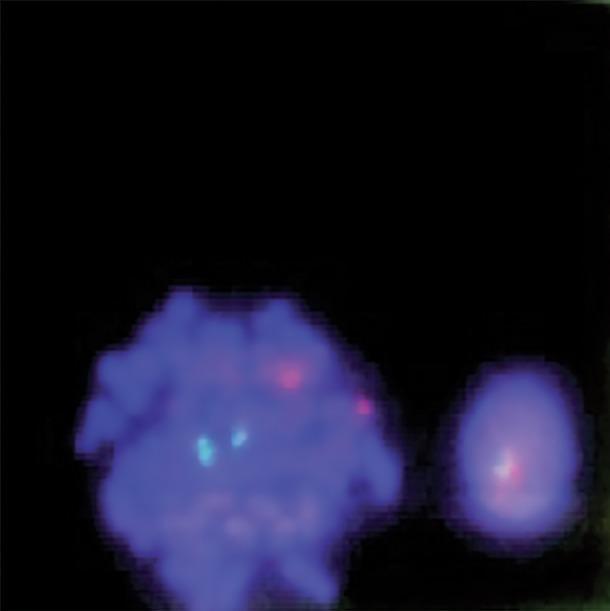
This diagnostic image displays a fluorescence in situ hybridization (FISH) analysis of human bone marrow cells, used primarily for detecting the BCR-ABL1 gene fusion associated with Chronic Myeloid Leukemia (CML). The image shows two blue-stained nuclei (DAPI) against a dark background. On the left, a larger metaphase cell exhibits a normal signal pattern with two distinct cyan/green signals and two distinct red signals (2G2R), representing the normal location of the ABL1 and BCR genes on their respective chromosomes. On the right, a smaller interphase cell demonstrates a fusion signal where a red and a cyan/green signal overlap or are closely apposed, indicative of a chromosomal translocation. This visual is a key educational tool for demonstrating molecular cytogenetics, specifically the dual-color, dual-fusion probe technique used in hematopathology to identify the Philadelphia chromosome.
Auer rods AML acute myeloid leukemia myeloblasts
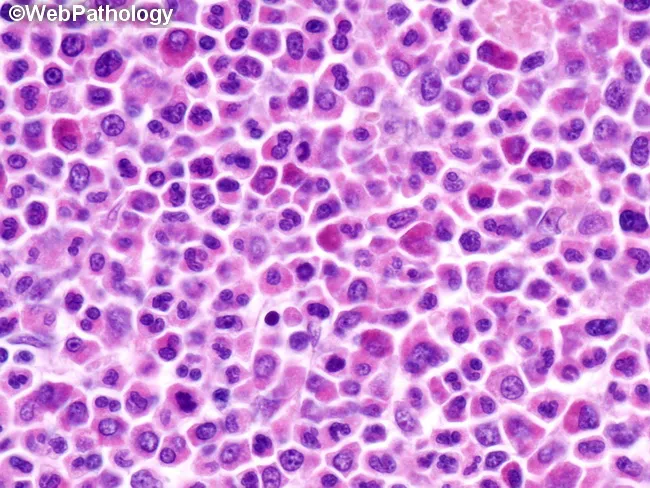
This high-magnification light microscopy image shows an H&E stained tissue section documenting an extramedullary myeloid tumor (myeloid sarcoma) composed of immature myeloid precursors arranged in diffuse sheets. The cellular population includes myeloblasts with high nuclear-to-cytoplasmic ratio, fine nuclear chromatin, prominent nucleoli, and frequent mitotic figures, accompanied by promyelocytes and maturation to myelocytes in variable proportions. Cytoplasm is scant to moderate and can contain occasional cytoplasmic granules; rod-shaped inclusions (Auer rods) may be seen in scattered blasts. The architectural pattern lacks normal tissue stratification, with cohesive clusters and dispersed cells infiltrating the stroma, consistent with an extramedullary granulocytic tumor. The image corresponds to a histopathology specimen most often obtained from soft tissue, lymph node, skin, or other extramedullary sites in patients with or without overt bone marrow involvement. Clinically, myeloid sarcoma is diagnostic of acute myeloid leukemia (AML) and often precedes or heralds AML relapse; immunohistochemical profiling (MPO, CD34, CD117, CD43, lysozyme) and cytogenetic/molecular testing are essential for classification and prognosis. Potential diagnostic significance includes associations with AML subtypes and recurrent translocations (e.g., t(8;21), inv(16), 11q23). This image is valuable for educational illustration of AML-related solid tumors, hematopathology education, differential diagnosis with lymphoma or metastatic carcinoma, and correlation with systemic hematologic disease and treatment planning.
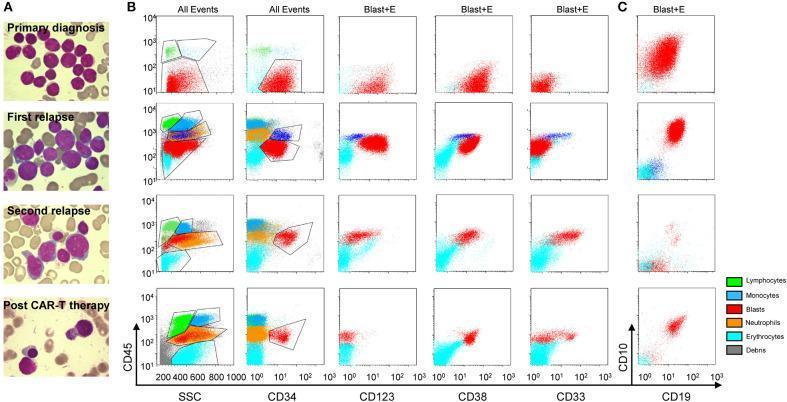
This composite educational graphic illustrates the morphologic and immunophenotypic evolution of a secondary Acute Myeloid Leukemia (AML) case across four clinical stages: primary diagnosis, first relapse, second relapse, and post-anti-CLL1 CAR T-cell therapy. Panel A consists of Wright-Giemsa stained bone marrow aspirate smears. Early stages show dense populations of myeloblasts with high N:C ratios, fine chromatin, and nucleoli. The second relapse reveals increasing dysplasia, while the post-therapy image demonstrates hematopoietic recovery with mature leukocytes and a significant reduction in blast cells. Panels B and C present flow cytometric scatter plots utilizing two gating strategies: 'All Events' and 'Blast+E' (blasts and erythroid cells). Markers analyzed include CD45, Side Scatter (SSC), CD34, CD123, CD38, CD33, CD10, and CD19. Color-coded populations identify blasts (red), lymphocytes (green), monocytes (dark blue), neutrophils (orange), and erythrocytes (light blue). The plots track the lineage switch and immunophenotypic shifts, such as the emergence of myeloid markers (CD33, CD123) in later relapses and the subsequent elimination of the malignant blast population following targeted CAR T-cell therapy.
Leukemias - MBBS University Examination
Overview
- Lineage: Myeloid vs. Lymphoid
- Tempo: Acute vs. Chronic
| Myeloid | Lymphoid | |
|---|---|---|
| Acute | AML | ALL |
| Chronic | CML | CLL |
1. ACUTE MYELOID LEUKEMIA (AML)
Definition
Epidemiology
- Occurs at all ages; incidence rises throughout life, peaking after 60 years
- Most common acute leukemia in adults
- ~13,000 new cases/year in the US
Pathogenesis - Driver Mutations (4 Categories)
| Category | Examples |
|---|---|
| Transcription factor mutations | t(8;21) disrupts RUNX1; inv(16) disrupts CBFB; t(15;17) produces PML-RARα |
| Signaling mutations | FLT3 activating mutation, RAS mutations |
| Epigenome mutations | IDH1/IDH2 mutations (produce oncometabolite 2-hydroxyglutarate); cohesin mutations |
| TP53/p53 mutations | Associated with complex karyotype, erythroid differentiation, poor prognosis |
WHO Classification (2022)
| Subtype | Translocation | Prognosis | Key Feature |
|---|---|---|---|
| AML with RUNX1::RUNX1T1 | t(8;21) | Favorable | Auer rods easily found |
| AML with CBFB::MYH11 | inv(16) | Favorable | Abnormal eosinophilic precursors |
| APL (acute promyelocytic) | t(15;17) PML::RARA | Very favorable | Numerous Auer rods in bundles; high DIC incidence |
| AML with KMT2A rearrangement | t(11q23) | Poor | Monocytic differentiation |
| AML with mutated NPM1 | - | Favorable | Detected by DNA sequencing |
| AML with myelodysplasia-related changes | del 5q/7q | Poor |
- AML minimally differentiated
- AML without maturation
- AML with maturation
- Acute myelomonocytic leukemia
- Acute monoblastic/monocytic leukemia
- Pure erythroid leukemia
- Acute megakaryoblastic leukemia (most common AML in Down syndrome)
- Acute basophilic leukemia
Diagnostic threshold: Blasts ≥20% in bone marrow (except when defining genetic aberration is present)
Morphology
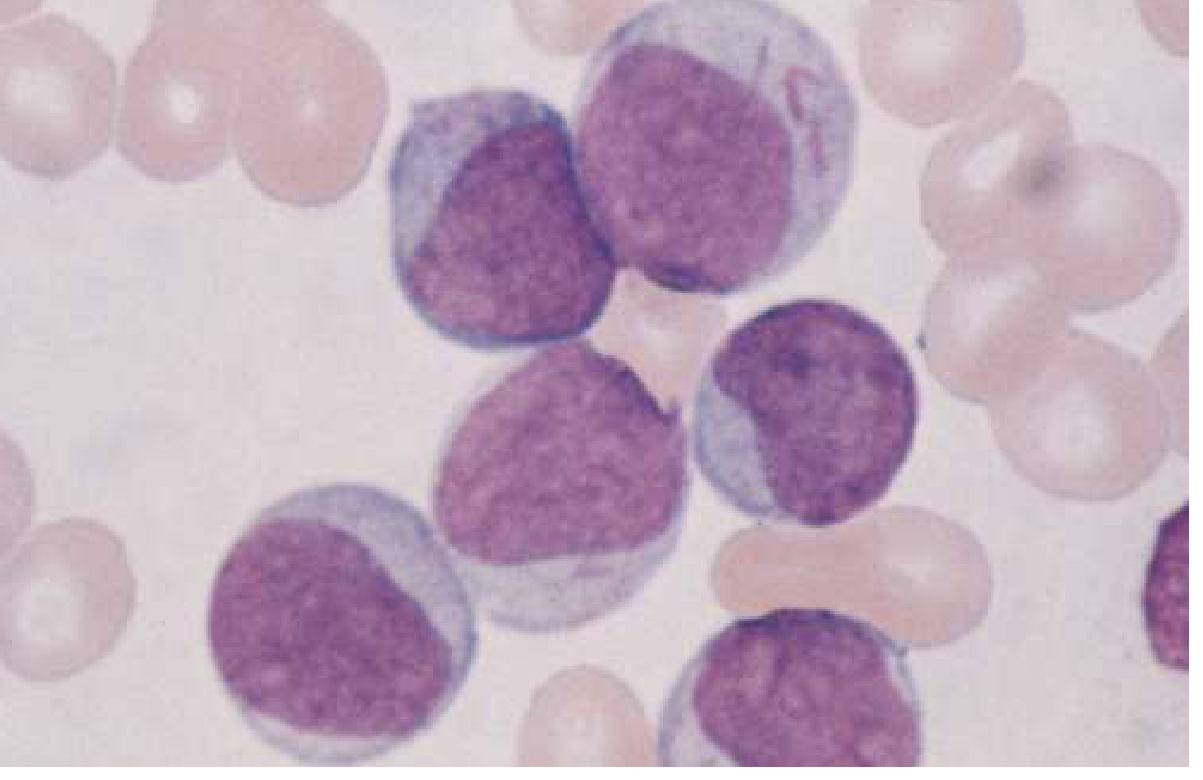
- Myeloblasts: Delicate nuclear chromatin, 2-4 nucleoli, more cytoplasm than lymphoblasts
- Auer rods: Needle-like azurophilic cytoplasmic inclusions - pathognomonic for AML, most numerous in APL
- Monoblasts: Folded/lobulated nuclei, NSE (non-specific esterase)-positive, no Auer rods
Immunophenotype (Flow Cytometry)
- Immature AML: CD34, CD117, HLA-DR
- More differentiated: CD13, CD33
- Monocytic features: CD14, CD15, CD11b
- Erythroid: CD36, CD71, CD235a (glycophorin A)
- Megakaryocytic: CD41, CD61
Staining Markers
- Myeloperoxidase (MPO) - positive in myeloblasts (>3% blasts to confirm)
- Sudan Black B - positive in myeloid lineage
- Non-specific esterase (NSE/butyrate esterase) - positive in monocytic lineage
Complications of APL [t(15;17)]
- The PML-RARα fusion protein blocks terminal differentiation of granulocytes
- High incidence of DIC (due to release of procoagulants from granules)
- Responds dramatically to ATRA (all-trans retinoic acid) + arsenic trioxide - overrides the differentiation block
Clinical Features
- Anemia: fatigue, pallor
- Thrombocytopenia: bleeding, petechiae
- Neutropenia: recurrent/severe infections
- Bone pain, lymphadenopathy, hepatosplenomegaly
- Rarely: gingival hypertrophy (monocytic AML), CNS involvement, leukostasis
Treatment
- Induction: 7+3 regimen (cytarabine 7 days + daunorubicin/idarubicin 3 days)
- APL specifically: ATRA + arsenic trioxide (ATO) - highly curative
- Targeted: IDH inhibitors (enasidenib for IDH2; ivosidenib for IDH1); FLT3 inhibitors (midostaurin)
- Consolidation: High-dose cytarabine (HDAC)
- Allogeneic stem cell transplant: For high-risk / relapsed disease
2. ACUTE LYMPHOBLASTIC LEUKEMIA (ALL)
Definition
Epidemiology
- Peak incidence: 2-5 years of age
- Second peak in adults >60 years
- B-ALL is more common than T-ALL
Classification
| Subtype | Markers | Frequency |
|---|---|---|
| Pro-B ALL (most immature) | CD19, CD22, no CD10 | ~10% |
| CALLA-positive ALL (pre-B) | CD19, CD22, CD10+ | 50-60% - best prognosis |
| Pre-B-ALL | CD19, CD22, CD10 + cytoplasmic Ig | ~10% |
| Mature B-ALL | Surface immunoglobulin | <5% - Burkitt-like |
- CD7+, CD1a-, CD3- (Early T-cell precursor ALL - worst prognosis)
- CD1a+ (cortical/thymic T-ALL)
- CD3+ (mature T-ALL)
- t(9;22) Philadelphia chromosome (BCR-ABL1) - poor prognosis; treated with imatinib + chemo
- t(12;21) ETV6-RUNX1 - most common translocation in childhood ALL; favorable
- Hyperdiploidy (>50 chromosomes) - favorable
- Hypodiploidy (<44 chromosomes) - poor prognosis
- MLL rearrangements (infant ALL) - very poor
Morphology
- Lymphoblasts: Smaller than myeloblasts, higher nuclear:cytoplasmic ratio, less distinct nucleoli, scant basophilic cytoplasm
- No Auer rods (key distinction from AML)
- Cytoplasm may show PAS-positive material (glycogen)
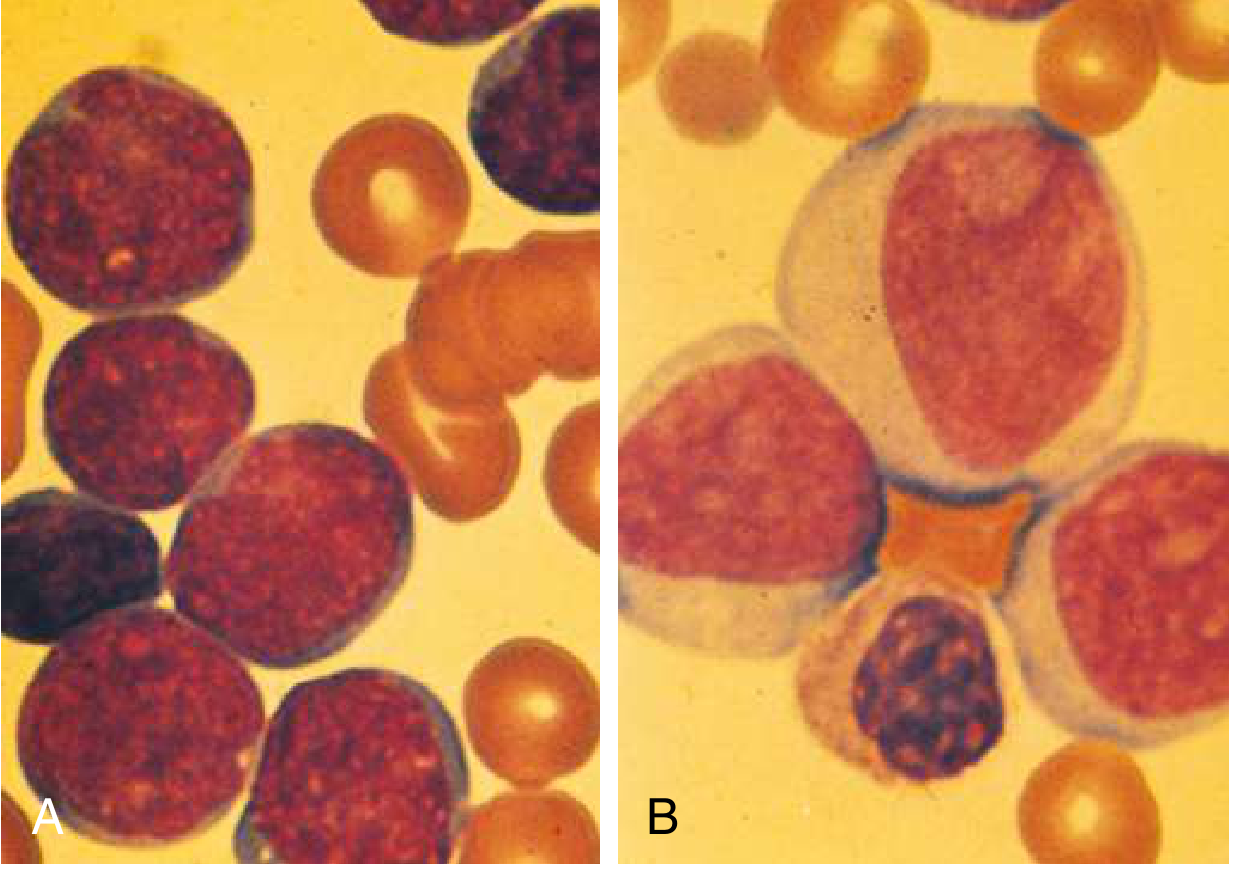
Staining
- PAS (periodic acid-Schiff) positive (block pattern)
- MPO negative (key distinction from AML)
- TdT (terminal deoxynucleotidyl transferase) - positive in both ALL and some AML; very useful marker
Clinical Features
- Bone pain (very common in children - leukemic infiltration of periosteum)
- Lymphadenopathy, hepatosplenomegaly
- CNS involvement (headache, cranial nerve palsies, meningism) - more common than in AML
- Mediastinal mass (superior vena cava syndrome) - T-ALL
- Testicular involvement (sanctuary site) - important in relapse
Treatment
- Induction: Vincristine + prednisolone + L-asparaginase ± anthracycline
- CNS prophylaxis: Intrathecal methotrexate (replaces cranial radiation in most protocols)
- Philadelphia+ ALL: Add tyrosine kinase inhibitor (imatinib/dasatinib) to chemotherapy
- Consolidation and maintenance: 2-3 years total therapy
- Relapsed ALL: Blinatumomab (CD19×CD3 BiTE antibody), inotuzumab ozogamicin (anti-CD22), CAR-T cells
- Allogeneic SCT: For high-risk or relapsed cases
Prognostic Factors in ALL
| Good Prognosis | Poor Prognosis |
|---|---|
| Age 1-10 years | Age <1 or >10 years |
| Low WBC at diagnosis | High WBC (>50,000) |
| CALLA (CD10) positive | T-cell or mature B-cell |
| Hyperdiploidy | Hypodiploidy |
| t(12;21) ETV6-RUNX1 | t(9;22) Ph+; MLL rearrangements |
| Female sex | Male sex |
| Rapid response to treatment | Slow/no response |
3. CHRONIC MYELOID LEUKEMIA (CML)
Definition
The Philadelphia Chromosome
- Reciprocal translocation: chromosome 9 (ABL1) + chromosome 22 (BCR) → derivative chromosome 22 = Ph chromosome
- p210 fusion protein - produced in most cases (M-BCR breakpoint)
- p230 - rare; associated with marked thrombocytosis
- p190 - associated with Ph+ ALL and monocytosis
Epidemiology
- Median age at diagnosis: 50-60 years
- ~15% of all adult leukemias
Phases of CML
- Leukocytosis with full range of myeloid cells at all stages of maturation
- "Myelocyte bulge" - proportion of myelocytes exceeds other immature forms
- Basophilia + eosinophilia + thrombocytosis
- Blasts usually <1%
- Splenomegaly (often massive)
- Low LAP (leukocyte alkaline phosphatase) score - distinguishes from leukemoid reaction
- Absolute monocytosis
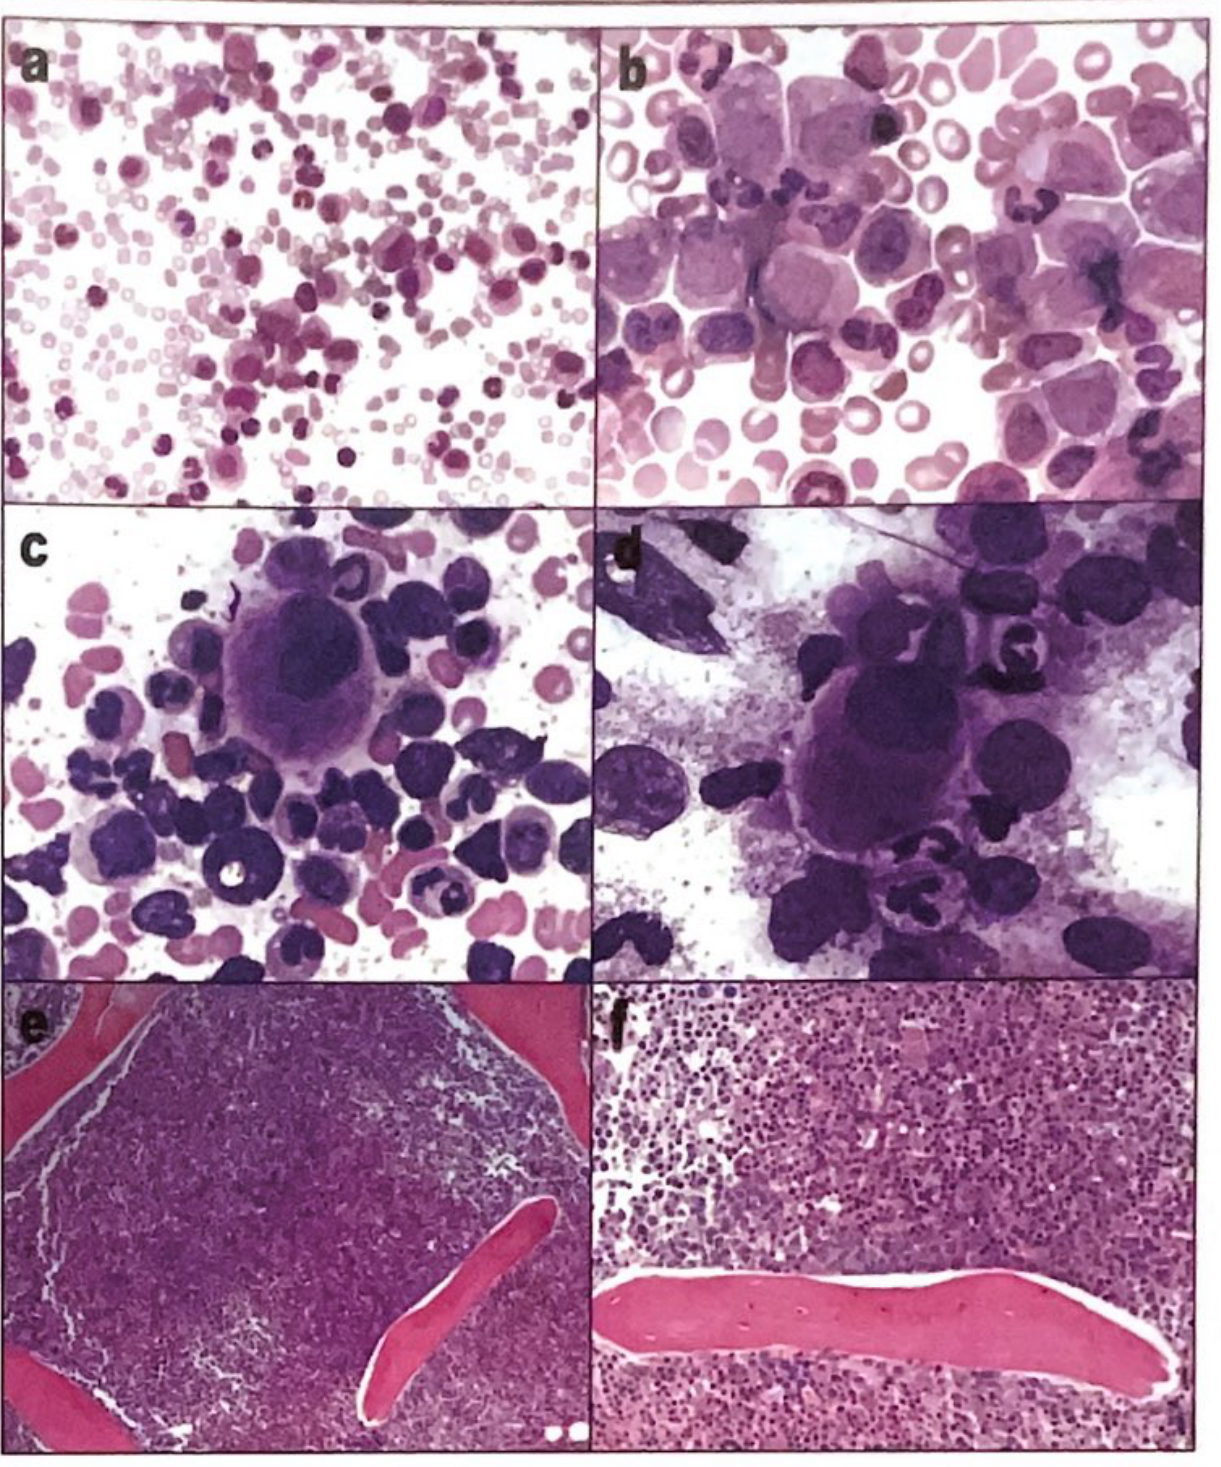
- Marrow: hypercellular with increased/abnormal "dwarf" megakaryocytes
- Progressive basophilia >20%
- Thrombocytopenia unrelated to therapy
- Leukocytosis unresponsive to therapy
- Blasts 10-19%
- Clonal cytogenetic progression (+8, i(17q), +19, additional Ph)
- Clusters of abnormal megakaryocytes
- LAP score tends to rise
- Blasts ≥20% in blood or marrow
- 70% myeloid (AML) type; 30% lymphoid (ALL) type
- Additional cytogenetic abnormalities: duplicate Ph, +8, i(17q)
- Very poor prognosis
Laboratory Findings (Chronic Phase)
| Finding | CML | Leukemoid Reaction |
|---|---|---|
| LAP score | Low | High |
| Basophilia | Present | Absent |
| Ph chromosome | Present | Absent |
| Splenomegaly | Common (massive) | Mild/absent |
Treatment
- Imatinib (Gleevec): First-line TKI - competitive inhibition of ATP binding site of BCR-ABL; also active against PDGFR and c-Kit
- 2nd generation TKIs: Nilotinib, dasatinib (for imatinib resistance or intolerance)
- 3rd generation: Ponatinib (for T315I "gatekeeper" mutation)
- Imatinib resistance mechanisms: T315I mutation, MDR1/P-glycoprotein overexpression, BCR-ABL amplification, clonal evolution
- Response monitoring: Quantitative RT-PCR for BCR-ABL1 transcript levels
- Allogeneic SCT: Reserved for blast crisis or TKI failure
4. CHRONIC LYMPHOCYTIC LEUKEMIA (CLL)
Definition
Epidemiology
- Median age: ~70 years
- Rare below 50 years
- Male > Female (2:1)
Pathogenesis
- Monoclonal proliferation of small mature B-lymphocytes
- These B cells are CD5+ B cells (CD5 is normally a T-cell marker - aberrant expression)
- Immunoglobulin heavy chain variable region (IGHV) mutation status: mutated = better prognosis
Immunophenotype (Hallmark)
- CD5+, CD19+, CD20+(dim), CD23+, surface Ig (dim)
- Low levels of surface immunoglobulin (monoclonal IgM or IgD)
- CD10 negative (distinguishes from follicular lymphoma)
Clinical Features
- Often asymptomatic - discovered incidentally on CBC
- Painless lymphadenopathy
- Hepatosplenomegaly
- Fatigue, weight loss (B symptoms)
- Recurrent infections (hypogammaglobulinemia)
- Autoimmune hemolytic anemia (AIHA) and immune thrombocytopenia (ITP) - due to dysregulated immune function
Blood Film / Laboratory
- Absolute lymphocytosis (>5,000 mature lymphocytes/μL sustained)
- Smudge/smear cells (Gumprecht shadows) - fragile CLL lymphocytes rupture during blood film preparation
- Bone marrow: lymphocytic infiltration
- Hypogammaglobulinemia
Staging
| Stage | Features | Risk |
|---|---|---|
| 0 | Lymphocytosis only | Low |
| I | + Lymphadenopathy | Intermediate |
| II | + Splenomegaly/hepatomegaly | Intermediate |
| III | + Anemia (Hb <11 g/dL) | High |
| IV | + Thrombocytopenia (platelets <100×10⁹/L) | High |
- Stage A: <3 lymphoid areas enlarged, no anemia/thrombocytopenia
- Stage B: ≥3 lymphoid areas enlarged
- Stage C: Anemia or thrombocytopenia
Prognostic Markers
- IGHV mutated → better prognosis
- del(17p) or TP53 mutation → very poor prognosis (ibrutinib-based therapy needed)
- del(13q14) alone → best prognosis
- del(11q) → intermediate/poor
- Trisomy 12 → intermediate
- ZAP-70 expression, CD38 expression → poor
Richter Transformation
- Transformation of CLL into diffuse large B-cell lymphoma (DLBCL) or occasionally Hodgkin lymphoma
- Occurs in ~5-10% of cases
- Marked by sudden clinical deterioration, rapidly enlarging nodes, fever, elevated LDH
Treatment
- Early stage (Rai 0-II / Binet A-B): "Watch and wait" - treatment not always needed
- Indication for treatment: Symptomatic disease, autoimmune complications, rapid doubling of lymphocyte count, Rai III-IV / Binet C
- Treatment options:
- BTK inhibitors: Ibrutinib (first choice for most patients, especially del(17p))
- BCL-2 inhibitor: Venetoclax
- Anti-CD20: Rituximab, obinutuzumab (combination regimens)
- FCR regimen: Fludarabine + cyclophosphamide + rituximab (preferred in young fit patients with IGHV-mutated disease)
- Splenectomy: For refractory splenomegaly or hemolytic anemia
COMPARISON TABLE: The Four Leukemias
| Feature | AML | ALL | CML | CLL |
|---|---|---|---|---|
| Age peak | >60 yrs | Children 2-5 yrs | 50-60 yrs | >70 yrs |
| Cell origin | Myeloid progenitor | Lymphoid progenitor | Myeloid stem cell | Mature B cell |
| Key marker | MPO+, CD33+, CD13+ | TdT+, CD10+, CD19/CD7 | Ph chromosome | CD5+, CD19+, CD23+ |
| Pathognomonic finding | Auer rods | No Auer rods | t(9;22) BCR-ABL1 | Smudge cells |
| Blast % | ≥20% in marrow | ≥20% in marrow | <10% chronic; ≥20% blast crisis | <20% |
| LAP score | Elevated | - | Low | - |
| Key complication | DIC (APL) | CNS, testicular relapse | Blast crisis | AIHA, Richter's |
| Hallmark therapy | ATRA+ATO (APL); 7+3 | Vincristine/pred/ASP + TKI if Ph+ | Imatinib | Ibrutinib; venetoclax |
| Prognosis | Intermediate-poor | Children excellent (85% cure) | Good with TKI | Indolent but incurable |
HIGH-YIELD EXAM POINTS
- Auer rods = AML (never ALL); most numerous in APL t(15;17)
- APL = t(15;17) PML-RARα; treatment = ATRA + ATO; complication = DIC
- Philadelphia chromosome = t(9;22) = BCR-ABL1 = CML (also ~25% of adult ALL)
- Imatinib = competitive inhibitor of ABL kinase ATP binding site
- TdT positive = lymphoblastic leukemia/lymphoma (ALL)
- CD5+ B cells = CLL (aberrant expression)
- Smudge cells = CLL
- CALLA (CD10) positive ALL = best prognosis subgroup in ALL
- Myelocyte bulge + low LAP + basophilia = CML chronic phase
- Blast crisis of CML: ≥20% blasts; 70% myeloid, 30% lymphoid
- Richter transformation = CLL → DLBCL
- Hyperdiploidy in ALL = favorable; Hypodiploidy = poor
- Down syndrome = acute megakaryoblastic leukemia (AMKL) most common AML
- ALL most common malignancy in children; CLL most common leukemia in adults (Western countries)
- del(17p)/TP53 in CLL = poor prognosis; use ibrutinib, avoid FCR