Explain the mechanism of ECG skill
Reading File
Finding Sources
Finding Sources
Finding Sources
Reading File
Reading File
Reading File
Finding Sources
Loading Image
Finding Sources
Loading Image
Reading File
Reading File
Loading Image
Loading Image
I now have excellent textbook content and diagrams. Let me compile the full answer.
Mechanism of the ECG (Electrocardiogram)
What Is the ECG?
The electrocardiogram (ECG/EKG) is a recording of tiny potential differences (voltages) on the body surface that reflect the electrical activity of the heart. These measurable voltages arise because the entire myocardium does not depolarize all at once - the atria and ventricles depolarize and repolarize in a specific, timed sequence, creating potential differences that spread to the skin surface where electrodes can detect them.
"The ECG is the result of differences in electrical potential generated by the heart at sites of the surface recording." - Miller's Anesthesia, 10e
Step 1: The Electrical Origin - The SA Node
Every normal heartbeat begins at the sinoatrial (SA) node, a cluster of specialized cells in the right atrium. SA nodal cells have automaticity - they spontaneously depolarize to threshold and fire action potentials without an external stimulus, at a rate of ~60-100 beats/min. Notably, SA nodal depolarization itself is NOT visible on the surface ECG because the electrical mass is too small.
Step 2: Conduction Pathway and Timing
Once the SA node fires, the impulse travels through the cardiac conduction system in a precise sequence:
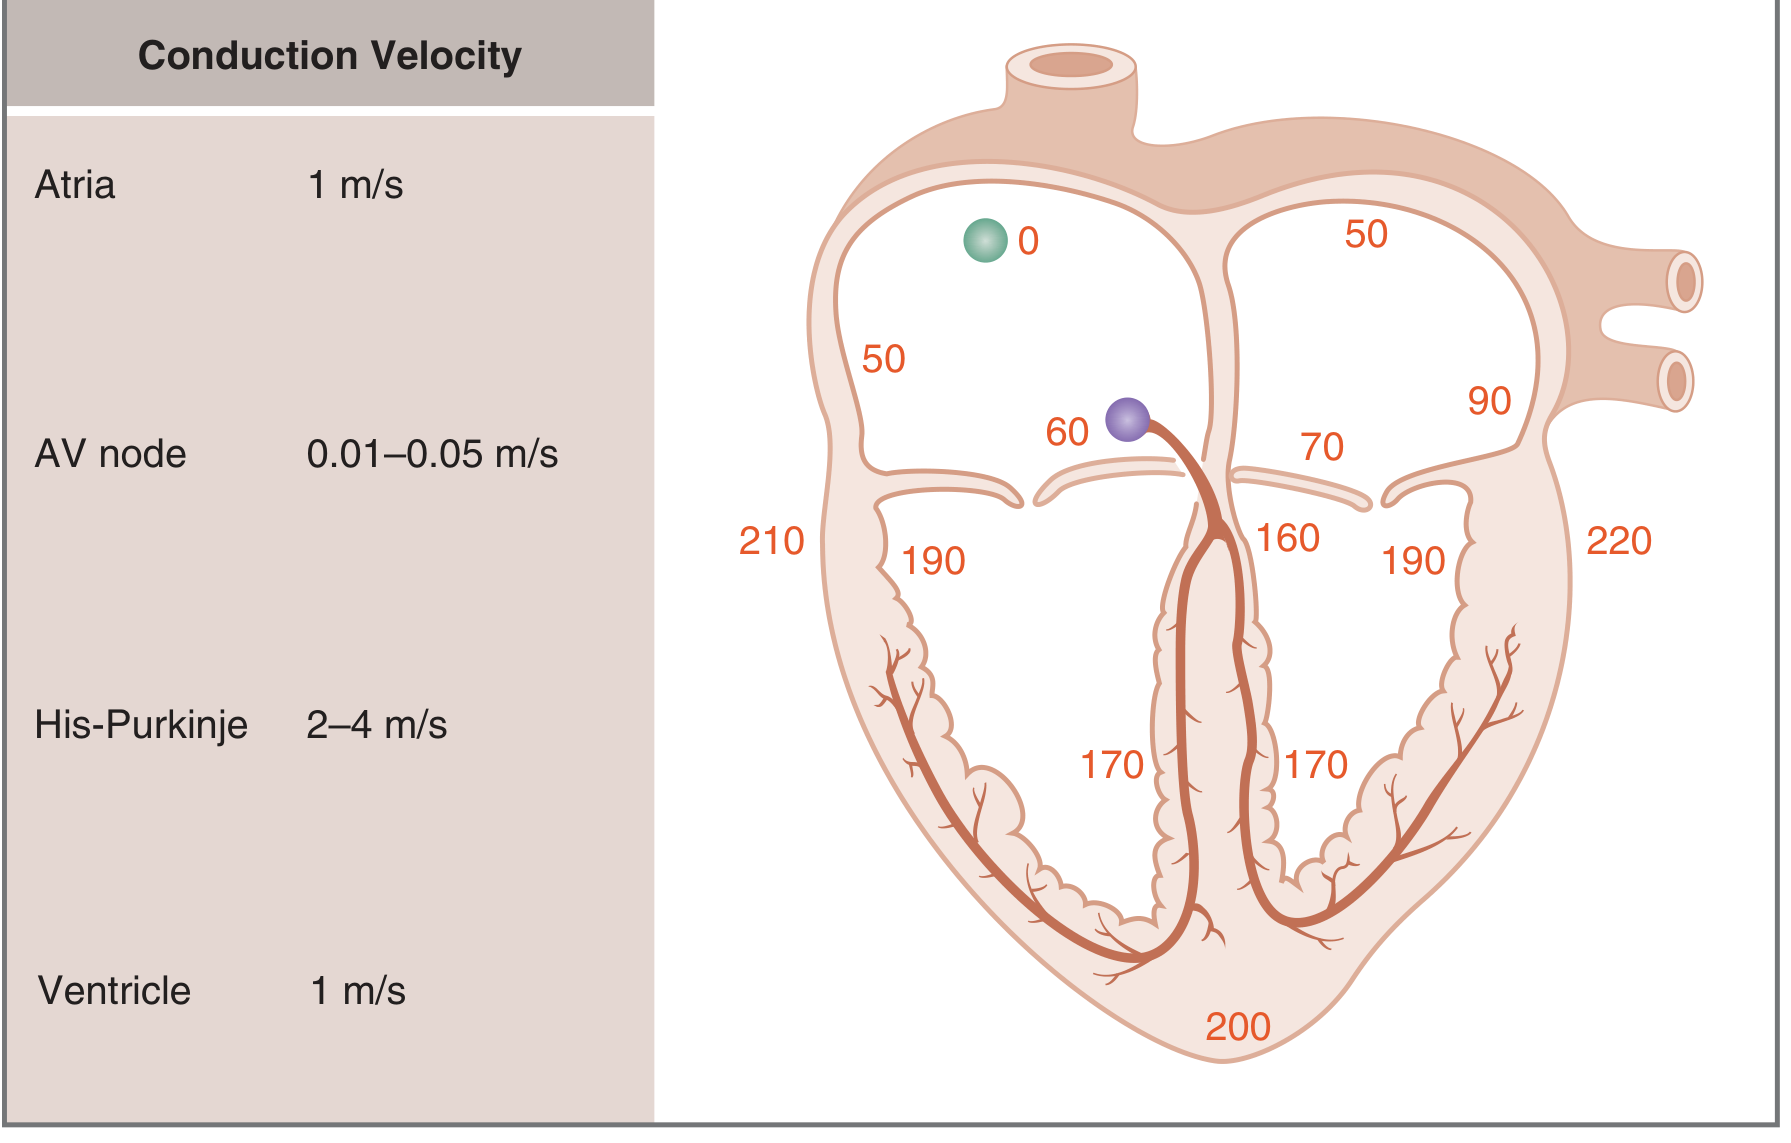
Fig. 4.14 - Timing of activation (ms) from SA node (time zero) through the myocardium. Costanzo Physiology 7th Ed.
| Structure | Conduction Velocity | Cumulative Time |
|---|---|---|
| SA node | - | 0 ms |
| Atria | 1 m/s | 0-90 ms |
| AV node | 0.01-0.05 m/s (slowest) | ~60-160 ms |
| His bundle / Bundle branches | 2-4 m/s | ~160 ms |
| Purkinje fibers | 2-4 m/s (fastest) | ~160-200 ms |
| Ventricular muscle | 1 m/s | ~200-220 ms |
Why is the AV node so slow? The slow velocity (0.01-0.05 m/s) deliberately creates an "AV delay" of ~100 ms, ensuring the ventricles do not contract before the atria have time to fill them with blood. The Purkinje fibers are the opposite - their fast conduction ensures both ventricles activate nearly simultaneously for efficient ejection.
Step 3: The Cellular Mechanism - Local Current Propagation
The propagation of action potentials through the heart works by local current spread:
- An action potential at one site creates an inward depolarizing current (carried by Na+ in atrial/ventricular/Purkinje cells, by Ca2+ in SA/AV nodal cells).
- This inward current generates local currents that flow to adjacent, resting cells.
- Adjacent cells are depolarized to threshold and fire their own action potentials.
- This process repeats cell-by-cell across the myocardium.
Conduction velocity depends on:
- Size of the inward current during the action potential upstroke (larger = faster conduction)
- Rate of rise (dV/dt) of the upstroke
- Cable properties of the fiber: cell membrane resistance (Rm) and internal resistance (Ri)
Step 4: The ECG Waveforms - What Each Represents
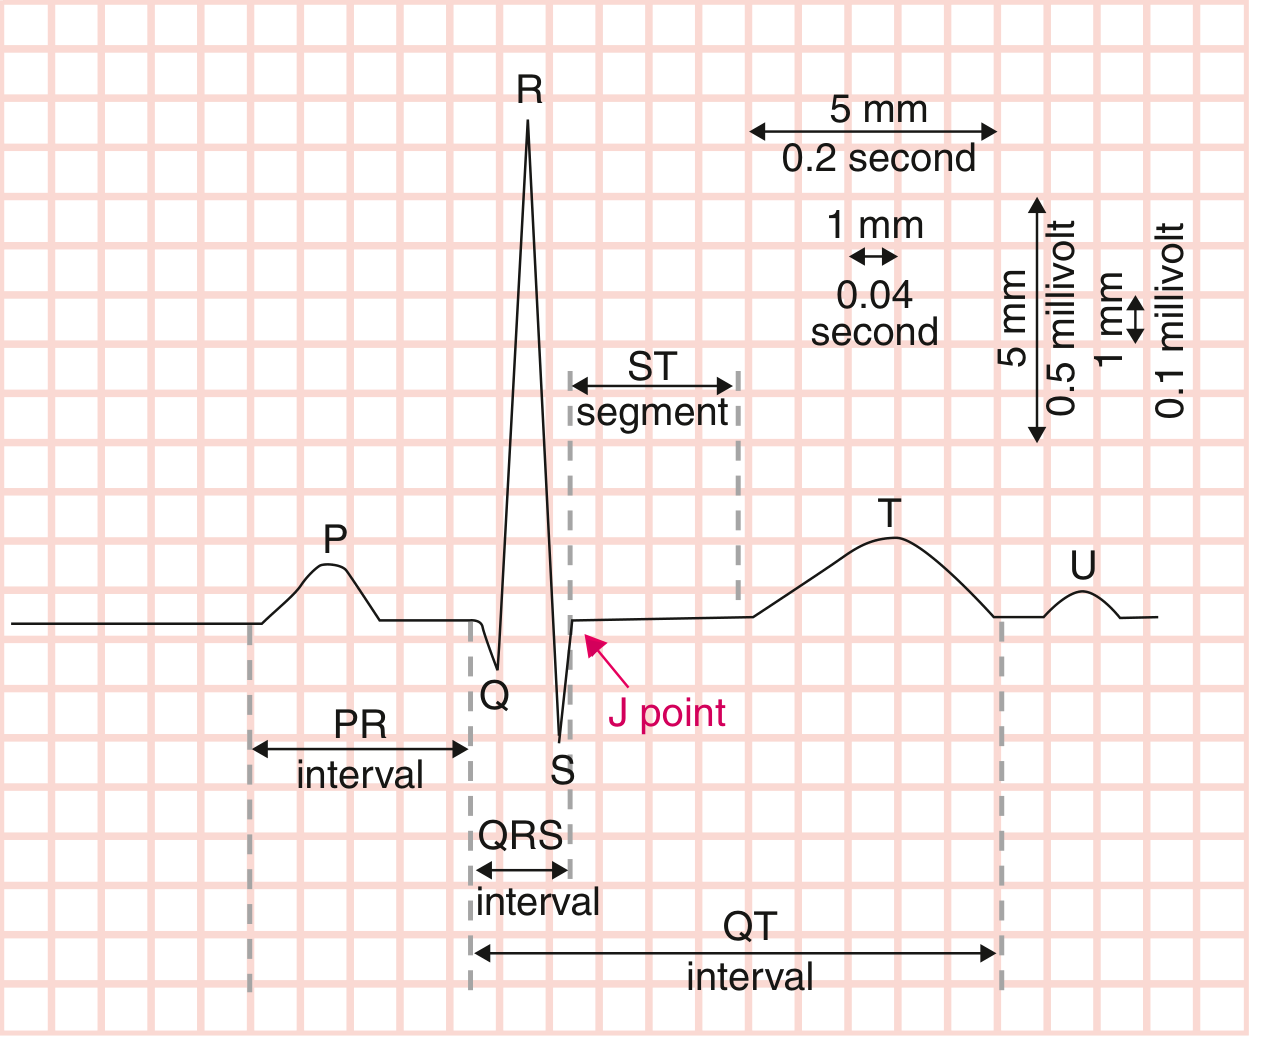
Standard ECG paper: horizontal axis = time (1 mm = 0.04 sec), vertical axis = voltage (1 mm = 0.1 mV). Goldman-Cecil Medicine.

Fig. 4.17 - ECG measured from lead II. Costanzo Physiology 7th Ed.
P Wave
- Represents atrial muscle depolarization
- Duration reflects conduction time through the atria (slower conduction = wider P wave)
- Atrial repolarization is NOT seen on the ECG - it is buried underneath the QRS complex because ventricular electrical mass far exceeds atrial mass
PR Interval
- Time from onset of atrial depolarization to onset of ventricular depolarization
- Includes the P wave PLUS the flat PR segment (which reflects slow AV node conduction)
- Normal ~160 ms
- Sympathetic stimulation shortens PR; parasympathetic stimulation lengthens it
QRS Complex (Q + R + S waves)
- Represents ventricular muscle depolarization
- Despite the ventricles being much larger than the atria, the QRS duration is similar to the P wave duration - because the His-Purkinje system conducts at 2-4 m/s, activating ventricular muscle rapidly and nearly simultaneously
- Amplitude is much larger than the P wave, reflecting the greater ventricular muscle mass
ST Segment
- Isoelectric (flat) portion between QRS and T wave
- Corresponds to the plateau phase of the ventricular action potential (all cells fully depolarized, no voltage difference between them)
- ST elevation or depression signals injury/ischemia
T Wave
- Represents ventricular repolarization
- Normally upright because the ventricles repolarize in the opposite direction to which they depolarized
QT Interval
- From QRS onset to T wave offset
- Encompasses ventricular depolarization + repolarization (the full ventricular action potential cycle)
J Point
- The junction between the end of QRS and start of ST segment
- A J wave (Osborn wave) can appear here in hypothermia, hypercalcemia, or brain injury
Step 5: Correlation with Mechanical Events
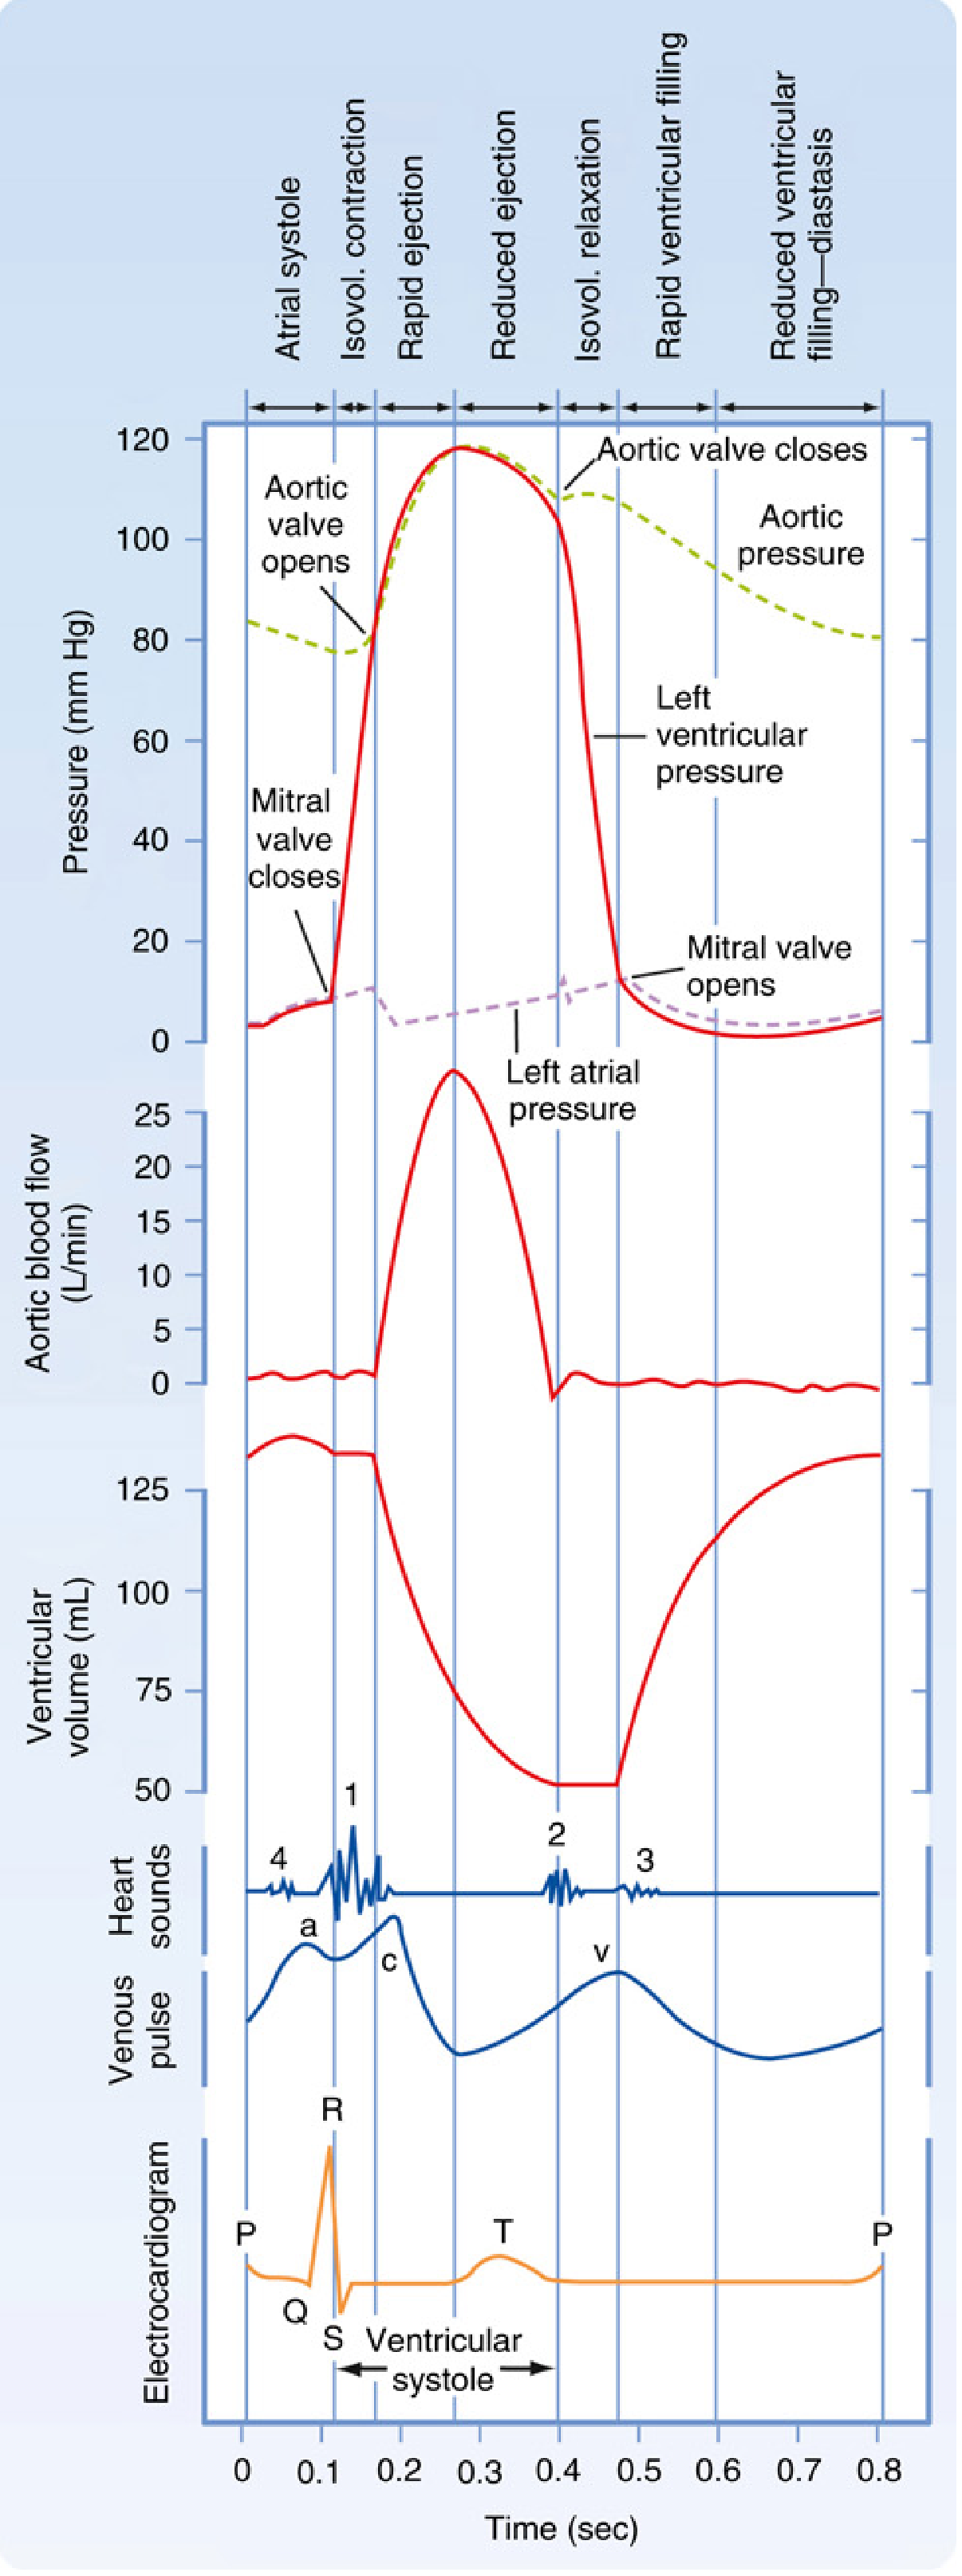
Fig. 13.1 - Electrical and mechanical events during a single cardiac cycle. Miller's Anesthesia 10e.
| ECG Event | Mechanical Event |
|---|---|
| P wave | Atrial systole begins ("atrial kick") |
| PR interval | AV delay; ventricular filling completes |
| QRS (R wave peak) | Mitral/tricuspid valves close; ventricular systole begins |
| ST segment | Isovolumic contraction; then ejection phase |
| T wave | Ventricular repolarization; precedes relaxation |
| T-P interval | Ventricular diastole and filling |
Summary of the Mechanism
- SA node auto-fires an action potential (not visible on ECG)
- Impulse spreads through atria via local current propagation → P wave
- Impulse reaches the AV node, slows deliberately (~100 ms delay) → PR segment
- Impulse rapidly traverses the His bundle, bundle branches, and Purkinje fibers
- Purkinje fibers activate ventricular cardiomyocytes simultaneously → QRS complex
- All ventricular cells hold their plateau phase → ST segment
- Ventricular cells repolarize in sequence → T wave
- Cycle repeats at the next SA node firing
Sources:
- Costanzo Physiology 7th Edition, pp. 143-149
- Goldman-Cecil Medicine, International Edition, p. 421
- Miller's Anesthesia 10e, pp. 1364-1368
This is a shared conversation. Sign in to Orris to start your own chat.