Take me through the basics of ecg comprehensive as per accurate resource made easy
Reading File
Finding Sources
Finding Sources
Finding Sources
Finding Sources
Finding Sources
Finding Sources
Reading File
Reading File
Reading File
Finding Sources
Finding Sources
Finding Sources
Finding Sources
Reading File
Reading File
Reading File
Reading File
Reading File
Loading Image
Loading Image
Reading File
Reading File
Loading Image
I now have comprehensive, authoritative content from multiple major textbooks plus excellent diagrams. I have enough to write a thorough ECG basics guide. Let me compose the full response.
ECG Basics - A Comprehensive Guide
Sources: Goldman-Cecil Medicine (Chapter 42 - Electrocardiography), Costanzo Physiology 7th Ed., Harrison's Principles of Internal Medicine 22e (2025), Medical Physiology (Boron & Boulpaep)
1. What is an ECG?
The electrocardiogram (ECG or EKG) is a recording of the tiny potential differences on the surface of the body that reflect the electrical activity of the heart. These surface voltages arise because the atria and ventricles do not depolarize and repolarize simultaneously - the sequential, ordered spread of depolarization and repolarization through the myocardium creates potential differences that can be detected by electrodes on the skin.
Introduced by Einthoven in the early 1900s, the ECG has changed surprisingly little in principle. It allows simultaneous recording of myocardial activation from multiple vantage points, permitting analysis of electrical events in different regions.
2. The Cardiac Conduction System (The ECG's Electrical Source)
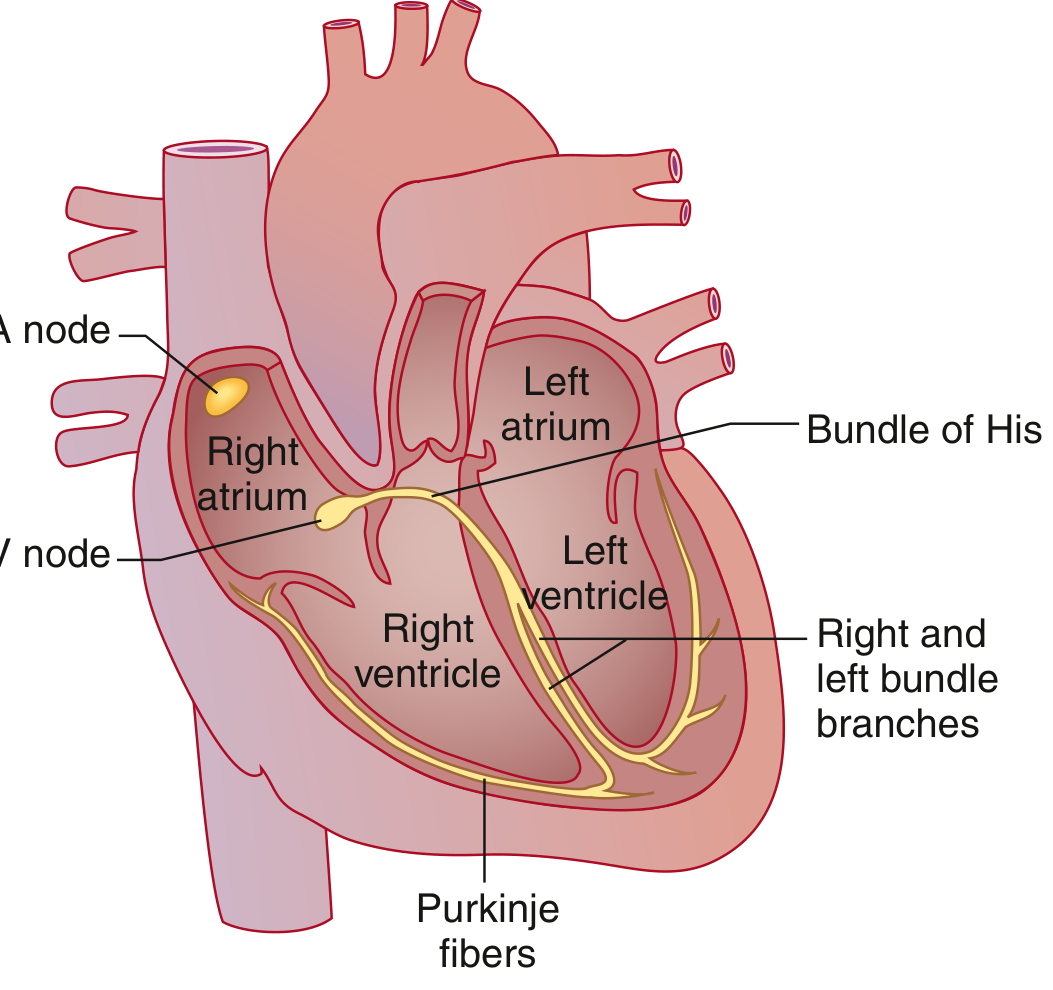
The sequence, from top to bottom:
| Structure | Role |
|---|---|
| SA node | High lateral right atrium, near SVC. Spontaneous depolarizer - dominant pacemaker (~60-100 bpm) |
| Bachmann bundle | Specialized intra-atrial tract - speeds depolarization to the left atrium |
| AV node | Only normal electrical bridge between atria and ventricles. Physiologic conduction delay here (inscribes the PR segment) |
| Bundle of His | Exits AV node; rapid conduction tissue |
| Left & Right bundle branches | Left branch divides into anterior and posterior fascicles |
| Purkinje fibers | Fastest-conducting tissue; delivers impulse to ventricular muscle |
The reason the ventricles depolarize just as fast as the atria despite being far larger: conduction velocity in the His-Purkinje system is much faster than in atrial tissue.
3. The ECG Paper and Technical Standards
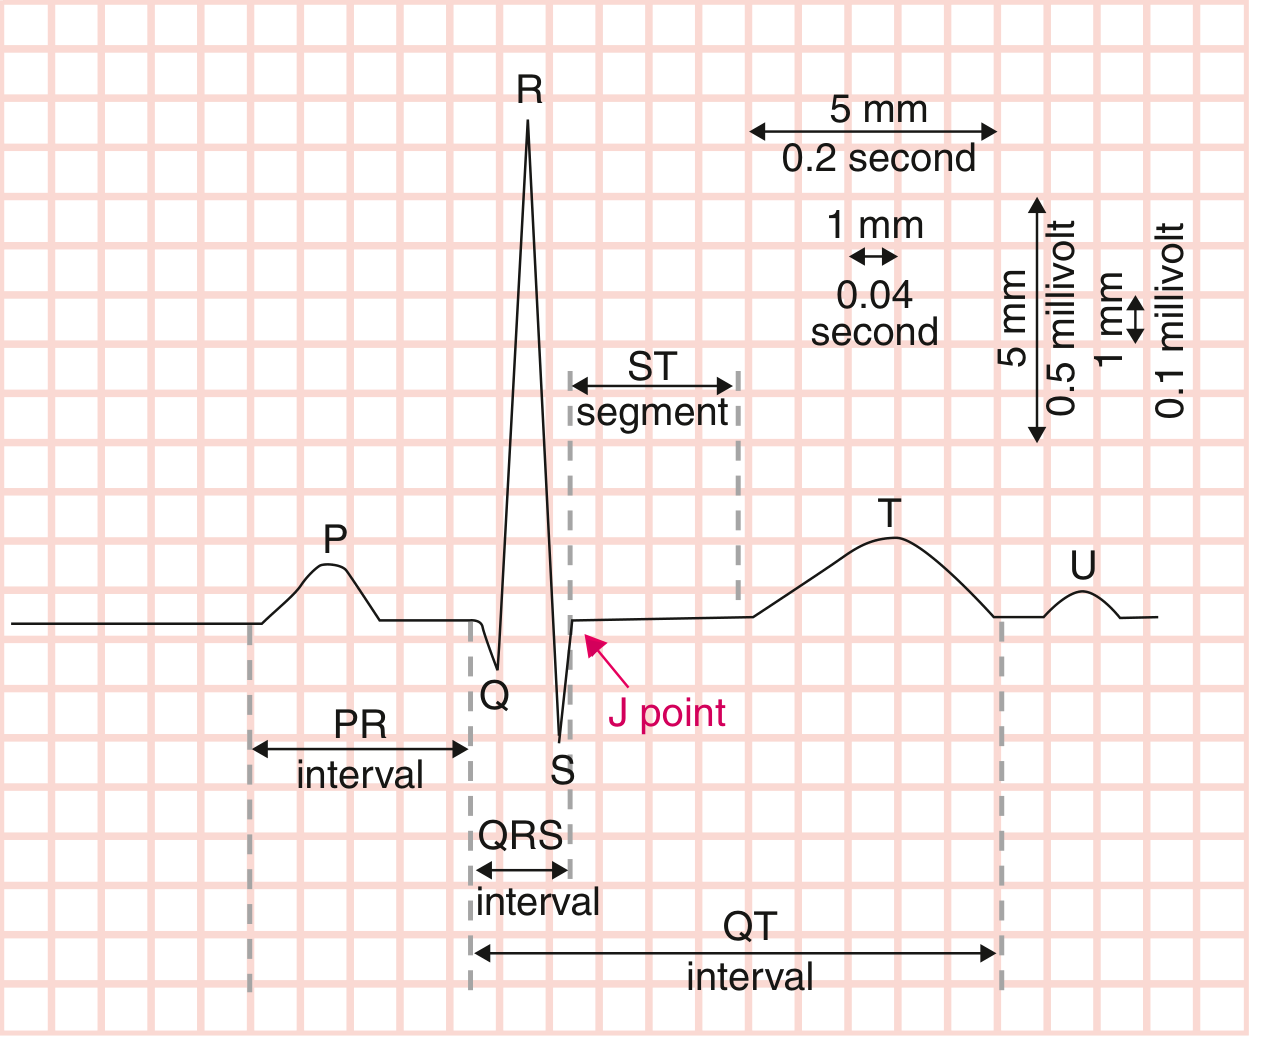
ECG paper has a grid with two types of lines:
| Measurement | Small box (1 mm) | Large box (5 mm) |
|---|---|---|
| Time (horizontal axis) | 0.04 sec (40 ms) | 0.2 sec (200 ms) |
| Voltage (vertical axis) | 0.1 mV | 0.5 mV |
- Standard paper speed: 25 mm/sec
- Standard calibration: 10 mm = 1 mV
- A standard ECG records 10 seconds of activity, with 12 leads arranged in groups: I, II, III → aVR, aVL, aVF → V1, V2, V3 → V4, V5, V6
4. The ECG Waveforms

P Wave
- Represents: Atrial depolarization
- Normal duration: < 120 ms (< 3 small boxes)
- Atrial repolarization is NOT seen on the normal ECG - it is buried under the QRS complex (atrial muscle mass is too small)
- Morphology reflects atrial structure: if conduction slows through the atria, the P wave widens
PR Interval
- Measured from: Onset of P wave to onset of QRS complex
- Represents: Conduction time through atrial muscle + AV node + His-Purkinje system (the AV nodal delay is the isoelectric PR segment within the interval)
- Normal: 90-200 ms (0.09-0.20 sec)
- Sympathetic stimulation shortens it; parasympathetic stimulation (or AV node disease) prolongs it
QRS Complex
- Represents: Ventricular muscle depolarization
- Normal duration: 75-110 ms (< 3 small boxes)
- Much larger amplitude than the P wave because of the large ventricular muscle mass
- Contains tremendous information about ventricular structure and function
Naming conventions within QRS:
- Q wave = first negative deflection before any positive deflection
- R wave = first positive deflection
- S wave = negative deflection after the R wave
- Additional deflections are labeled R', S', etc.
ST Segment
- Measured from: J point (junction of QRS end and ST start) to onset of T wave
- Represents: Plateau phase of the ventricular action potential (isoelectric - no net current flow)
- Normally isoelectric (flat, at baseline)
- Elevation or depression is a major clinical sign
T Wave
- Represents: Ventricular repolarization
- Normally upright in most leads
- T waves are concordant with the QRS (i.e., upright where QRS is predominantly positive) in normal ECG
U Wave
- Small deflection following the T wave (occasionally seen)
- May represent repolarization of the Purkinje fibers or mid-myocardial "M cells"
- Prominent U waves: hypokalemia, bradycardia, certain drugs
QT Interval
- Measured from: QRS onset to T wave offset
- Represents: Total ventricular depolarization and repolarization (ventricular systole)
- Must be corrected for heart rate using Bazett's formula: QTc = QT / √RR (in seconds)
- Normal QTc: Males ≤450 ms; Females ≤460 ms
J Point (Osborn Wave)
- The J point marks the end of QRS and start of ST segment
- A positive deflection at the J point = J wave (Osborn wave) - classically seen in hypothermia, also in hypercalcemia and brain injury
5. Normal ECG Intervals - Reference Table
| Parameter | Normal Value |
|---|---|
| Heart rate | 50-100 beats/min |
| P wave duration | < 120 ms |
| PR interval | 90-200 ms |
| QRS duration | 75-110 ms |
| QTc (males) | 390-450 ms |
| QTc (females) | 390-460 ms |
| QRS axis | -30° to +90° |
6. Calculating Heart Rate
Method 1 (regular rhythms):
Heart rate = 60,000 ÷ RR interval (in ms)
Method 2 (quick estimate from big boxes):
Count the number of large boxes between two R waves → divide into 300:
- 1 box = 300 bpm
- 2 boxes = 150 bpm
- 3 boxes = 100 bpm
- 4 boxes = 75 bpm
- 5 boxes = 60 bpm
- 6 boxes = 50 bpm
Method 3 (10-second strip):
Count total QRS complexes in the strip × 6
7. The 12 Leads - What Each One "Sees"
Limb Leads (Frontal Plane)
| Lead | Electrode pairing | View |
|---|---|---|
| I | LA (+) vs RA (-) | Lateral wall |
| II | LL (+) vs RA (-) | Inferior wall |
| III | LL (+) vs LA (-) | Inferior wall |
| aVR | RA (+) (augmented) | Cavity/right |
| aVL | LA (+) (augmented) | Lateral wall |
| aVF | LL (+) (augmented) | Inferior wall |
Precordial (Chest) Leads (Horizontal Plane)
| Lead | Position | View |
|---|---|---|
| V1 | 4th ICS, right sternal border | Septal |
| V2 | 4th ICS, left sternal border | Septal |
| V3 | Between V2 and V4 | Anterior |
| V4 | 5th ICS, midclavicular line | Anterior |
| V5 | 5th ICS, anterior axillary line | Lateral |
| V6 | 5th ICS, midaxillary line | Lateral |
R-wave progression: From V1 to V6, the R wave normally grows taller (and S wave smaller). The point where R = S is the transition zone, normally at V3-V4.
8. The Electrical Axis
The QRS axis represents the average direction of ventricular depolarization in the frontal plane.
| Axis range | Classification |
|---|---|
| -30° to +90° | Normal |
| -30° to -90° | Left axis deviation (LAD) |
| +90° to +180° | Right axis deviation (RAD) |
| -90° to ±180° | Extreme/northwest axis |
Quick method: Look at leads I and aVF:
- Both positive → Normal axis
- I positive, aVF negative → LAD (check if truly left: leads II)
- I negative, aVF positive → RAD
- Both negative → Extreme axis deviation
Causes of LAD: Left anterior fascicular block (LAFB), inferior MI, LVH, WPW (right-sided)
Causes of RAD: RVH, pulmonary hypertension, LPFB, lateral MI, WPW (left-sided), dextrocardia
9. Bundle Branch Blocks and Fascicular Blocks
When conduction through the His-Purkinje system is impaired, the QRS widens and changes shape because ventricular depolarization proceeds more slowly through muscle rather than specialized tissue.
| Block | QRS duration | Axis | Key morphology |
|---|---|---|---|
| RBBB | ≥120 ms | Normal | rSR' (rabbit ears) in V1; wide S in I and V6 |
| LBBB | ≥120 ms | Normal or LAD | Broad notched R in I, aVL, V5-V6; no septal Q waves |
| LAFB | < 120 ms | -45° to -90° (LAD) | qR in aVL; rS in II, III, aVF |
| LPFB | < 120 ms | +90° to +180° (RAD) | rS in I, aVL; qR in III, aVF |
Clinical note: Isolated LBBB in an otherwise healthy person carries a ~2x higher risk of cardiovascular events and should prompt cardiac evaluation.
10. Key Abnormalities to Recognize
ST Changes
- ST elevation (≥1 mm in limb leads, ≥2 mm in precordial): STEMI, pericarditis (diffuse, with PR depression), Brugada, early repolarization
- ST depression: Ischemia (subendocardial), reciprocal changes, digoxin effect (scooped)
Pathological Q Waves
- Width ≥40 ms OR depth ≥25% of R wave height = significant
- Indicate prior transmural infarction (electrically dead tissue)
P-Wave Abnormalities
- Broad, notched P (P mitrale): Left atrial enlargement - LA conduction is delayed
- Tall, peaked P (P pulmonale, >2.5 mm in II): Right atrial enlargement
PR Interval Changes
| Finding | Meaning |
|---|---|
| Short PR + delta wave | WPW (accessory pathway bypasses AV node) |
| Prolonged PR (>200 ms) | 1st degree AV block |
| Progressive PR lengthening → dropped QRS | 2nd degree AV block, Mobitz I (Wenckebach) |
| Fixed PR with randomly dropped QRS | 2nd degree AV block, Mobitz II |
| No relationship between P and QRS | 3rd degree (complete) AV block |
QTc Prolongation
- QTc >450 ms (males) or >460 ms (females)
- Risk of torsades de pointes (polymorphic VT)
- Causes: drugs (amiodarone, sotalol, macrolides, antipsychotics), hypokalemia, hypomagnesemia, congenital long QT syndrome
11. Systematic Approach to Reading an ECG
Use this order every time:
- Rate - Calculate from RR interval
- Rhythm - Regular or irregular? P before every QRS? QRS after every P?
- Axis - Look at leads I and aVF
- Intervals - PR, QRS duration, QTc
- P wave morphology - Size, shape, axis
- QRS morphology - Bundle branch blocks, R-wave progression, Q waves
- ST segments - Elevation or depression vs. J point
- T waves - Upright, inverted, peaked?
- U waves - Present?
- Compare with prior ECG if available
12. Summary Cheat Sheet
| What you see | What it means |
|---|---|
| P wave | Atrial depolarization |
| PR interval | AV node conduction delay |
| QRS complex | Ventricular depolarization |
| ST segment | Ventricular plateau (recovery begins) |
| T wave | Ventricular repolarization |
| QT interval | Total ventricular electrical systole |
| Wide QRS (>120 ms) | Bundle branch block or ventricular origin |
| Delta wave + short PR | WPW pre-excitation |
| Pathological Q wave | Prior MI (dead myocardium) |
| ST elevation | STEMI, pericarditis, Brugada |
| Peaked T waves | Hyperkalemia (early) |
| Long QTc | Risk of torsades de pointes |
| Osborn (J) wave | Hypothermia |
Sources: Goldman-Cecil Medicine 2 Vol Set (International Ed.), Chapter 42 - Electrocardiography, by Leonard Ganz & Mark S. Link; Costanzo Physiology 7th Ed., Chapter 4; Harrison's Principles of Internal Medicine 22e (2025), Chapter 247 - Basic ECG Waveforms; Medical Physiology, Boron & Boulpaep.
Calculations using seconds made easy
Reading File
Reading File
I have everything needed. Here is the complete, made-easy guide:
ECG Calculations Using Seconds - Made Easy
Source: Goldman-Cecil Medicine, Chapter 42; Costanzo Physiology 7th Ed.
The Foundation: The Grid
Everything starts with one simple fact:
1 small box  =  0.04 sec  (40 ms)
1 large box  =  0.20 sec  (200 ms)   [= 5 small boxes]
From this single rule, every ECG calculation follows.
Step 1 - Converting Boxes to Seconds
This is just multiplication:
| Boxes counted | × 0.04 sec | = Time in seconds |
|---|---|---|
| 1 small box | × 0.04 | = 0.04 sec |
| 2 small boxes | × 0.04 | = 0.08 sec |
| 3 small boxes | × 0.04 | = 0.12 sec |
| 4 small boxes | × 0.04 | = 0.16 sec |
| 5 small boxes | × 0.04 | = 0.20 sec = 1 large box |
| 10 small boxes | × 0.04 | = 0.40 sec = 2 large boxes |
Trick: Just count small boxes and add a zero after the decimal.
- 3 boxes → 0.3... → 0.03 × 4 → actually just say: 3 boxes = 0.12 sec
- Or memorize: boxes × 4 = milliseconds (e.g., 3 × 4 = 12 → 0.12 sec)
Step 2 - Measuring Each Interval
P Wave Duration
- Count small boxes from start to end of P wave
- Normal: < 3 small boxes (< 0.12 sec)
Example: P wave spans 2 boxes
2 × 0.04 = 0.08 sec ✓ Normal
PR Interval
- Count small boxes from start of P to start of QRS
- Normal: between 0.09 sec and 0.20 sec (roughly 2-5 small boxes)
Normal range in boxes:
  0.09 sec ÷ 0.04 = ~2.25 boxes (minimum)
  0.20 sec ÷ 0.04 =  5 boxes (maximum = exactly 1 large box)

Example: PR spans 4 small boxes
4 × 0.04 = 0.16 sec ✓ Normal

Example: PR spans 6 small boxes
6 × 0.04 = 0.24 sec ✗ Prolonged → 1st degree AV block
QRS Duration
- Count small boxes from start to end of QRS
- Normal: ≤ 2.5-3 small boxes (≤ 0.11 sec)
Normal upper limit = 0.11 sec ÷ 0.04 = ~2.75 boxes

Example: QRS spans 2 boxes
2 × 0.04 = 0.08 sec ✓ Normal

Example: QRS spans 4 boxes
4 × 0.04 = 0.16 sec ✗ Wide → Bundle branch block
Key rule: QRS ≥ 3 boxes (≥ 0.12 sec) = wide QRS = bundle branch block territory
QT Interval
- Count small boxes from start of QRS to end of T wave
- Normal depends on heart rate, so we correct it
Bazett's Formula (QTc):
QTc = QT (in seconds) ÷ √RR interval (in seconds)
Step-by-step example:
- Measure QT: spans 10 small boxes → 10 × 0.04 = 0.40 sec
- Measure RR: spans 20 small boxes → 20 × 0.04 = 0.80 sec
- √0.80 = 0.894
- QTc = 0.40 ÷ 0.894 = 0.447 sec = 447 ms
- Check: Males ≤ 450 ms ✓ (just within normal)
Normal QTc:
- Males: ≤ 0.45 sec (450 ms)
- Females: ≤ 0.46 sec (460 ms)
Step 3 - Heart Rate Calculation
Formula Method
HR = 60 ÷ RR interval (in seconds)
  OR
HR = 1500 ÷ RR interval (in small boxes)
  OR
HR = 300 ÷ RR interval (in large boxes)
Example:
- RR interval = 15 small boxes
- 15 × 0.04 = 0.60 sec
- HR = 60 ÷ 0.60 = 100 bpm
- Same result: 1500 ÷ 15 = 100 bpm ✓
The "300 Rule" - Fastest Clinical Method
Count the number of large boxes between two R waves, divide into 300:
| Large boxes between R waves | Heart rate |
|---|---|
| 1 | 300 bpm |
| 2 | 150 bpm |
| 3 | 100 bpm |
| 4 | 75 bpm |
| 5 | 60 bpm |
| 6 | 50 bpm |
Memory trick: 300 - 150 - 100 - 75 - 60 - 50
Just memorize this sequence. Count large boxes, pick the number.
The "10-Second Strip" Method (for irregular rhythms like AF)
Count all QRS complexes in the 10-second strip × 6 = HR
Example: 12 QRS complexes counted → 12 × 6 = 72 bpm
Step 4 - All Normal Values in "Box Language"
| Interval | Normal (sec) | Normal (small boxes) | Memory |
|---|---|---|---|
| P wave | < 0.12 sec | < 3 boxes | "Less than 3" |
| PR interval | 0.09-0.20 sec | 2-5 boxes | "2 to 5" |
| QRS | ≤ 0.11 sec | ≤ 2.5 boxes | "Less than 3" |
| QTc | ≤ 0.45/0.46 sec | measure in sec for QTc | see Bazett |
Quick Clinical Decisions in Seconds
| You measure... | Interpretation |
|---|---|
| PR = 6 boxes (0.24 sec) | 1st degree AV block |
| QRS = 4 boxes (0.16 sec) | Bundle branch block |
| P wave = 4 boxes (0.16 sec) | Left atrial enlargement (P mitrale) |
| QTc = 480 ms | Prolonged QT - risk of torsades |
| RR = 5 large boxes | Heart rate = 60 bpm |
| RR = 3 large boxes | Heart rate = 100 bpm |
The One-Glance Summary
SMALL BOX = 0.04 sec  |  LARGE BOX = 0.20 sec

INTERVALS (count small boxes × 0.04):
  P wave     < 3 boxes  = < 0.12 sec
  PR         2-5 boxes  = 0.08-0.20 sec
  QRS        < 3 boxes  = < 0.12 sec

HEART RATE:
  300 ÷ (large boxes between R waves)
  OR  1500 ÷ (small boxes between R waves)
  OR  beats on 10-sec strip × 6

QTc = QT(sec) ÷ √RR(sec)    →   ≤ 0.45 sec (M), ≤ 0.46 sec (F)
Source: Goldman-Cecil Medicine (International Ed.), Chapter 42 - Electrocardiography; Costanzo Physiology 7th Ed., Chapter 4.
In short the best ones made easy
Here are the best, most clinically used ECG calculation tricks - distilled to the essentials:
ECG Calculations - The Best Ones, Made Easy
The Only Rule You Need to Memorize First
1 small box = 0.04 sec
1 large box = 0.20 sec
Everything else is built on this.
1. Heart Rate - 3 Methods, Pick One
The 300 Rule (fastest, for regular rhythms)
Count large boxes between 2 R waves → divide into 300
1 box = 300    2 = 150    3 = 100
4 = 75         5 = 60     6 = 50
Tip: Just memorize the sequence: 300, 150, 100, 75, 60, 50
The 1500 Rule (most accurate, regular rhythms)
HR = 1500 ÷ small boxes between R waves
Example: 20 small boxes → 1500 ÷ 20 = 75 bpm
The ×6 Rule (best for irregular rhythms like AF)
Count QRS complexes in 10-sec strip × 6 = HR
Example: 9 complexes → 9 × 6 = 54 bpm
2. Intervals - Count Boxes, Multiply by 0.04
| Interval | Measure from → to | Normal | In boxes |
|---|---|---|---|
| PR | Start of P → Start of QRS | 0.12-0.20 sec | 3-5 boxes |
| QRS | Start → End of QRS | < 0.12 sec | < 3 boxes |
| QT | Start of QRS → End of T | < 0.44 sec | < 11 boxes |
| P wave | Start → End of P | < 0.12 sec | < 3 boxes |
The rule of 3: P wave, PR max, and QRS are all judged against 3 small boxes (0.12 sec)
3. QTc - Corrected QT (Bazett's Formula)
QTc = QT (sec) ÷ √RR (sec)
Normal: ≤ 0.44 sec (some sources: ♂ ≤ 0.45, ♀ ≤ 0.46)
Shortcut without a calculator:
If QT is less than half the RR interval → QT is probably normal
4. What the Numbers Mean Clinically
| Finding | Value | Diagnosis |
|---|---|---|
| PR > 5 boxes (> 0.20 sec) | > 0.20 sec | 1st degree AV block |
| QRS ≥ 3 boxes (≥ 0.12 sec) | ≥ 0.12 sec | Bundle branch block |
| QTc > 0.45-0.46 sec | > 450/460 ms | Long QT → risk of torsades |
| P wave > 3 boxes | > 0.12 sec | Left atrial enlargement |
One Card Summary
┌─────────────────────────────────────────┐
│  1 small box = 0.04 sec                 │
│  1 large box = 0.20 sec                 │
├─────────────────────────────────────────┤
│  RATE  →  300 ÷ large boxes (R to R)    │
│           300/150/100/75/60/50          │
├─────────────────────────────────────────┤
│  PR    →  3-5 small boxes (0.12-0.20s)  │
│  QRS   →  < 3 small boxes (< 0.12s)    │
│  QTc   →  QT ÷ √RR  ≤ 0.44-0.46s      │
│  Shortcut: QT < ½ RR = likely normal   │
└─────────────────────────────────────────┘
That's all you need for 95% of ECG calculations at the bedside.
This is a shared conversation. Sign in to Orris to start your own chat.