
Management of hypothyroidism
"hypothyroidism"[MeSH Terms] AND "levothyroxine"[MeSH Terms]
"hypothyroidism" AND "levothyroxine" AND "treatment"
hypothyroidism management algorithm levothyroxine treatment
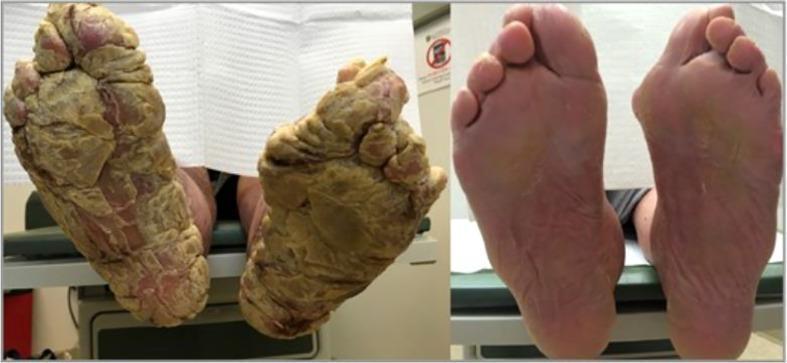
This clinical photograph presents a side-by-side comparison of acquired palmoplantar keratoderma in a patient with severe hypothyroidism, showcasing the appearance at diagnosis (left) and after four months of levothyroxine treatment (right). The 'before' image displays the bilateral plantar surfaces with massive, diffuse hyperkeratosis. The skin is characterized by a yellowish-brown, verrucous texture with deep ridges, fissures, and thick adherent scales that distort the normal anatomy of the feet. Focal areas of erythema are visible beneath the shedding scale. In contrast, the 'after' image demonstrates a near-complete resolution of the keratoderma. The plantar skin appears significantly thinner, smoother, and maintains a healthy pinkish-white hue with a return of normal dermatoglyphics and foot contour. This case highlights the clinical presentation of secondary palmoplantar keratoderma as a cutaneous manifestation of endocrine dysfunction and demonstrates the efficacy of systemic hormonal correction over standard topical keratolytics in metabolic-associated skin disease.
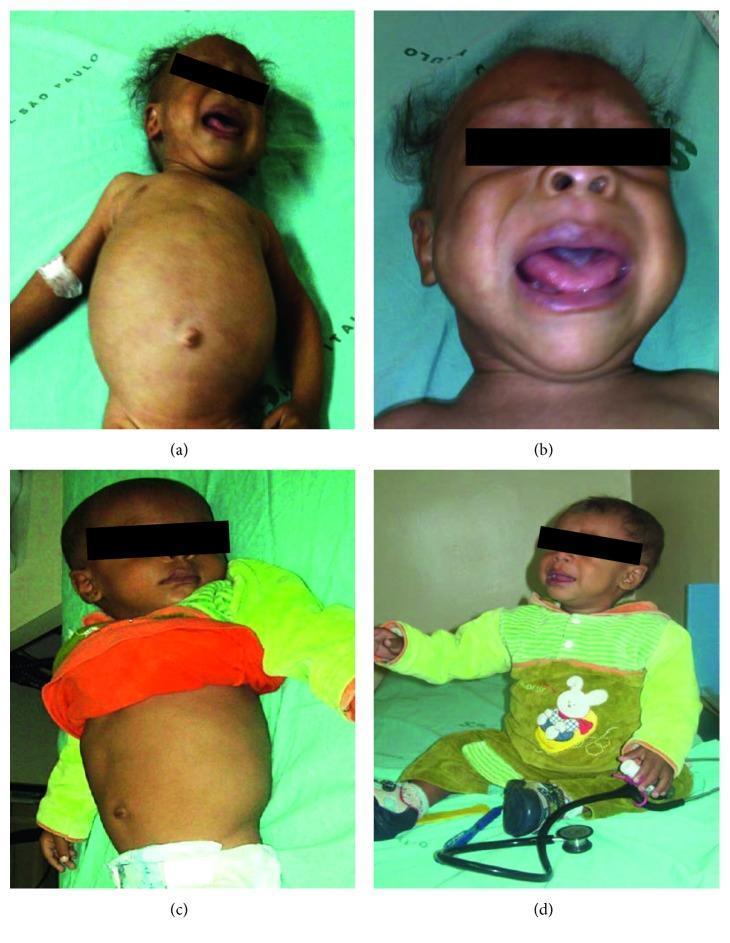
A series of four clinical photographs (a–d) documenting the progression of a pediatric patient with primary congenital hypothyroidism before and after treatment. Images (a) and (b) represent the patient at admission, exhibiting classic symptoms of untreated hypothyroidism: severe abdominal distension (pseudo-obstruction secondary to constipation), an umbilical hernia, generalized myxedema, and visible irritability. Facial features in (b) show macroglossia (enlarged tongue), rarefied eyebrows, and brittle, sparse hair. Images (c) and (d) depict the same patient six months after initiating levothyroxine sodium replacement therapy. These images demonstrate significant clinical improvement, including the complete resolution of abdominal distension (c) and achievement of developmental milestones, such as sitting without support (d). The comparison illustrates the systemic effects of thyroid hormone deficiency on metabolism, gastrointestinal motility, and neurodevelopmental progress in infants, as well as the efficacy of hormonal replacement.
![This Comparison Chart consists of two scatter plot panels (a and b) illustrating the variability of laboratory reference ranges for Free Thyroxine (FT4) concentrations in a neonatal and infant cohort following start of levothyroxine (LT4) treatment. The x-axis represents 'Time [day]' and the y-axis represents 'FT4 conc. of reference ranges [pmol/l]'. Panel (a) provides a detailed view of the first 50 days, highlighting significantly elevated and highly variable upper reference limits (grey circles) reaching up to 80 pmol/l in the early postnatal period. Panel (b) shows the total time interval up to 750 days, demonstrating more stable reference distributions over time. In both panels, grey crosses indicate the lower limits of reference ranges, while bold black step-lines represent the age-dependent target reference ranges used for normalization. The visual data emphasizes the heterogeneity of local laboratory standards compared to a unified target range, reflecting center-related and assay-related differences in monitoring thyroid function in congenital hypothyroidism.](https://cdn.orris.care/cdss_images/pmc_clinical_VQA_3c9c648c706d05419727ce9657325eae1aff01127e6da141f64894f4af784f4f.jpg)
This Comparison Chart consists of two scatter plot panels (a and b) illustrating the variability of laboratory reference ranges for Free Thyroxine (FT4) concentrations in a neonatal and infant cohort following start of levothyroxine (LT4) treatment. The x-axis represents 'Time [day]' and the y-axis represents 'FT4 conc. of reference ranges [pmol/l]'. Panel (a) provides a detailed view of the first 50 days, highlighting significantly elevated and highly variable upper reference limits (grey circles) reaching up to 80 pmol/l in the early postnatal period. Panel (b) shows the total time interval up to 750 days, demonstrating more stable reference distributions over time. In both panels, grey crosses indicate the lower limits of reference ranges, while bold black step-lines represent the age-dependent target reference ranges used for normalization. The visual data emphasizes the heterogeneity of local laboratory standards compared to a unified target range, reflecting center-related and assay-related differences in monitoring thyroid function in congenital hypothyroidism.
Management of Hypothyroidism
Classification (for treatment purposes)
| Type | TSH | Free T4 | Notes |
|---|---|---|---|
| Overt (primary) | >20 mIU/L (often) | Low | Symptomatic |
| Subclinical (primary) | 4.5-20 mIU/L | Normal | Often asymptomatic |
| Secondary/Central | Low or normal | Low | Pituitary failure |
| Myxedema coma | Very high | Very low | Life-threatening emergency |
1. Drug of Choice: Levothyroxine (L-T4)
- Available tablet strengths: 25, 50, 75, 88, 100, 112, 125, 137, 150, 175, 200, and 300 mcg
- Average replacement dose: 1.6 mcg/kg/day (adults)
- Effectiveness: Improvement in symptoms often takes weeks; TSH should be measured 6-8 weeks after initiation or dose change
- Goldman-Cecil Medicine, TREATMENT - Overt Hypothyroidism
- Textbook of Family Medicine 9e, p. 1022
- Lippincott Illustrated Reviews: Pharmacology, Clinical Application 23.2
2. Overt Hypothyroidism
- Start at the weight-based dose (1.6 mcg/kg) in otherwise healthy adults
- In elderly patients or those with coronary artery disease, start at a low dose (25-50 mcg/day) and titrate slowly to avoid precipitating angina or arrhythmia
- Aging decreases the L-thyroxine requirement (reduced tissue demand)
- Monitoring goal: Normalize serum TSH to the laboratory reference range
- Recheck TSH no earlier than 5-6 weeks after starting or changing the dose (time to steady state)
- Once stable, TSH can be rechecked annually
3. Subclinical Hypothyroidism
| Scenario | Recommendation |
|---|---|
| TSH > 10 mIU/L | Treat - likely beneficial; lowers LDL cholesterol |
| TSH 5-10 mIU/L + symptoms or high TPO antibodies | Treat |
| TSH 5-10 mIU/L, asymptomatic, age >65 | Defer treatment; recheck TSH + FT4 annually |
| Asymptomatic, TSH <10, elderly | Evidence of benefit is lacking |
- Goldman-Cecil Medicine, Subclinical Hypothyroidism section
4. Administration - Critical Points
| Agent | Mechanism |
|---|---|
| Ferrous sulfate (iron) | Binds T4, reduces absorption |
| Calcium carbonate | Binds T4, reduces absorption |
| Aluminum hydroxide (antacids) | Binds T4 |
| Sucralfate | Binds T4 |
| Cholestyramine | Binds T4 |
| Soy protein | Binds T4 |
| Phenytoin, phenobarbital, carbamazepine, rifampicin | Increase T4 metabolism (enzyme induction) |
- Stick to the same brand/formulation where possible - bioavailability varies between formulations
- If formulation is switched, recheck TSH at 6 weeks
5. Secondary (Central) Hypothyroidism
- Caused by pituitary failure (TSH low/normal with low FT4)
- Cannot use TSH to monitor - use free T4 instead (target mid-normal FT4 range)
- Treat with levothyroxine at the same weight-based dose
- Must rule out and treat concurrent adrenal insufficiency first before starting T4 (giving T4 without steroids can precipitate an adrenal crisis)
6. Myxedema Coma (Emergency)
- IV levothyroxine loading dose: 200-300 mcg IV, then 1.6 mcg/kg IV every 24 hours
- IV T3 (liothyronine): 5-10 mcg every 8-12 hours - added because T4 to T3 conversion may be impaired; continue until clinical improvement
- Hydrocortisone 100 mg IV every 6 hours - mandatory before or alongside T4, to cover possible concurrent adrenal insufficiency
- Supportive care: Passive rewarming only for hypothermia (active rewarming causes vasodilation and hypotension), ventilatory support, fluids, treat precipitating cause
- Goldman-Cecil Medicine, Myxedema Coma section
7. Hypothyroidism in Pregnancy
-
Required dose may increase by 25-50% depending on residual thyroid reserve
-
Women with no thyroid reserve (post-thyroidectomy): may need up to 33-50% dose increase
-
Women with Hashimoto thyroiditis (partial reserve): 25% increase often sufficient
-
Increase dose as soon as pregnancy is confirmed - undetected hypothyroidism in early pregnancy is linked to impaired fetal neurological development
-
Practical approach: increase from 7 tablets/week to 9 tablets/week (add one tablet on two days)
-
TSH target during gestation: <2.5 mIU/L
-
Recheck TSH every 4 weeks until mid-gestation
-
Goldman-Cecil Medicine, Pregnancy section; Creasy & Resnik's Maternal-Fetal Medicine
8. Hashimoto Thyroiditis (Most Common Cause in Developed Countries)
- Autoimmune destruction of the thyroid gland; TPO antibodies are the primary marker
- Once hypothyroidism is confirmed (elevated TSH, low/normal FT4, positive TPO Ab), start levothyroxine at 1.6 mcg/kg/day
- Monitor TSH annually once stable
- Titer of TPO/anti-Tg antibodies predicts progression of thyroid failure
9. Monitoring Summary
| Situation | Monitoring |
|---|---|
| New treatment / dose change | TSH at 5-6 weeks |
| Stable overt hypothyroidism | TSH annually |
| Pregnancy | TSH every 4 weeks to mid-gestation; target <2.5 mIU/L |
| Secondary hypothyroidism | Free T4 (not TSH) |
| Formulation change | TSH at 6 weeks |
Clinical Image: Levothyroxine Treatment Effect
Recent Literature
- Levothyroxine (T4) monotherapy is the standard of care
- Dose: 1.6 mcg/kg/day; start low in elderly/cardiac patients
- Take on an empty stomach; separate from interfering medications by hours
- Monitor TSH at 6 weeks post-change; annually when stable
- Pregnancy requires prompt dose increase and TSH target <2.5 mIU/L
- Myxedema coma needs IV T4 + IV T3 + hydrocortisone + supportive care
Find clinical guidelines for screening hypothyroidism in pregnancy
"hypothyroidism" AND "screening" AND "pregnancy" AND "guidelines"
ATA guidelines 2024 2025 thyroid disease management pregnancy screening hypothyroidism
https://www.thyroid.org/professionals/ata-professional-guide…
"thyroid" AND "pregnancy" AND "screening" AND "ATA guidelines"
Clinical Guidelines for Screening Hypothyroidism in Pregnancy
Key Guideline Sources
| Organization | Guideline | Year |
|---|---|---|
| ATA (American Thyroid Association) | Guidelines for Thyroid Disease in Preconception, Pregnancy, and Postpartum | 2026 (Korevaar TIM, Leung AM, Alexander EK et al., Thyroid 2026;36(5):481-544) |
| ATA (previous) | Diagnosis and Management of Thyroid Disease during Pregnancy and Postpartum | 2017 (Alexander, Pearce et al., Thyroid 2017;27(3):315-389) |
| ACOG | Testing for thyroid function in women with risk factors | Current |
| Endocrine Society | Targeted screening for thyroid dysfunction during pregnancy | Current |
| AACE | Screening prior to conception or at first prenatal visit | Current |
1. Universal vs. Targeted Screening - The Core Debate
-
Universal screening protocols identify more thyroid dysfunction, but they primarily identify subclinical hypothyroidism (SCH), and LT4 treatment of SCH has not clearly demonstrated improved pregnancy or offspring outcomes in large RCTs.
-
Both ATA and ACOG recommend against universal thyroid screening in pregnancy based on lack of demonstrated benefit in RCT data.
-
However, targeted screening may miss 18%-89% of pregnant persons with thyroid dysfunction - a widely acknowledged limitation.
-
Some European societies and experts argue that thyroid function screening is a cost-effective strategy meeting WHO criteria for screening programs; a universal screen-and-treat program has been shown to decrease adverse perinatal outcomes in low-risk populations (Negro et al.).
-
Creasy & Resnik's Maternal-Fetal Medicine, Screening section, p. 1502
-
Harrison's Principles of Internal Medicine 22E, 2025
2. Recommended Approach: Verbal Risk Screening + Targeted TSH Testing
- Verbally screen all reproductive-age persons planning pregnancy or in early gestation for high-risk factors
- If risk factors present → targeted TSH testing
3. High-Risk Factors Warranting TSH Screening (Box 61.1)
| Category | Specific Risk Factor |
|---|---|
| Thyroid history | Prior thyroid disorder/dysfunction, postpartum thyroiditis, neck radiation |
| Antibodies | Known thyroid antibody positivity (TPO-Ab, Tg-Ab) |
| Family history | Thyroid disease or autoimmune disorder in first-degree relative |
| Symptoms/Signs | Symptoms of thyroid disease, goiter, thyroid nodule |
| Autoimmune conditions | Type 1 diabetes mellitus, Addison disease, rheumatoid arthritis, other autoimmune disorders |
| Reproductive history | Infertility, recurrent pregnancy loss, prior preterm delivery |
| Obstetric | Multigravida with ≥2 prior pregnancies; assisted reproduction (IVF) |
| Demographics | Age >30 years; BMI ≥40 kg/m² |
| Medications | Thyroid function-altering drugs (amiodarone, lithium, checkpoint inhibitors) |
| Environment | Residing in area of known moderate-severe iodine deficiency |
-
Women with type 1 diabetes (33% prevalence of thyroid dysfunction; 3-fold increased risk of postpartum thyroid dysfunction)
-
Women taking lithium therapy (35% prevalence)
-
Women with infertility (12% prevalence)
-
Women with depression (10-12% prevalence)
-
Women ≥50 years
-
Berek & Novak's Gynecology, Recommendations for Testing and Treatment, p. 1982
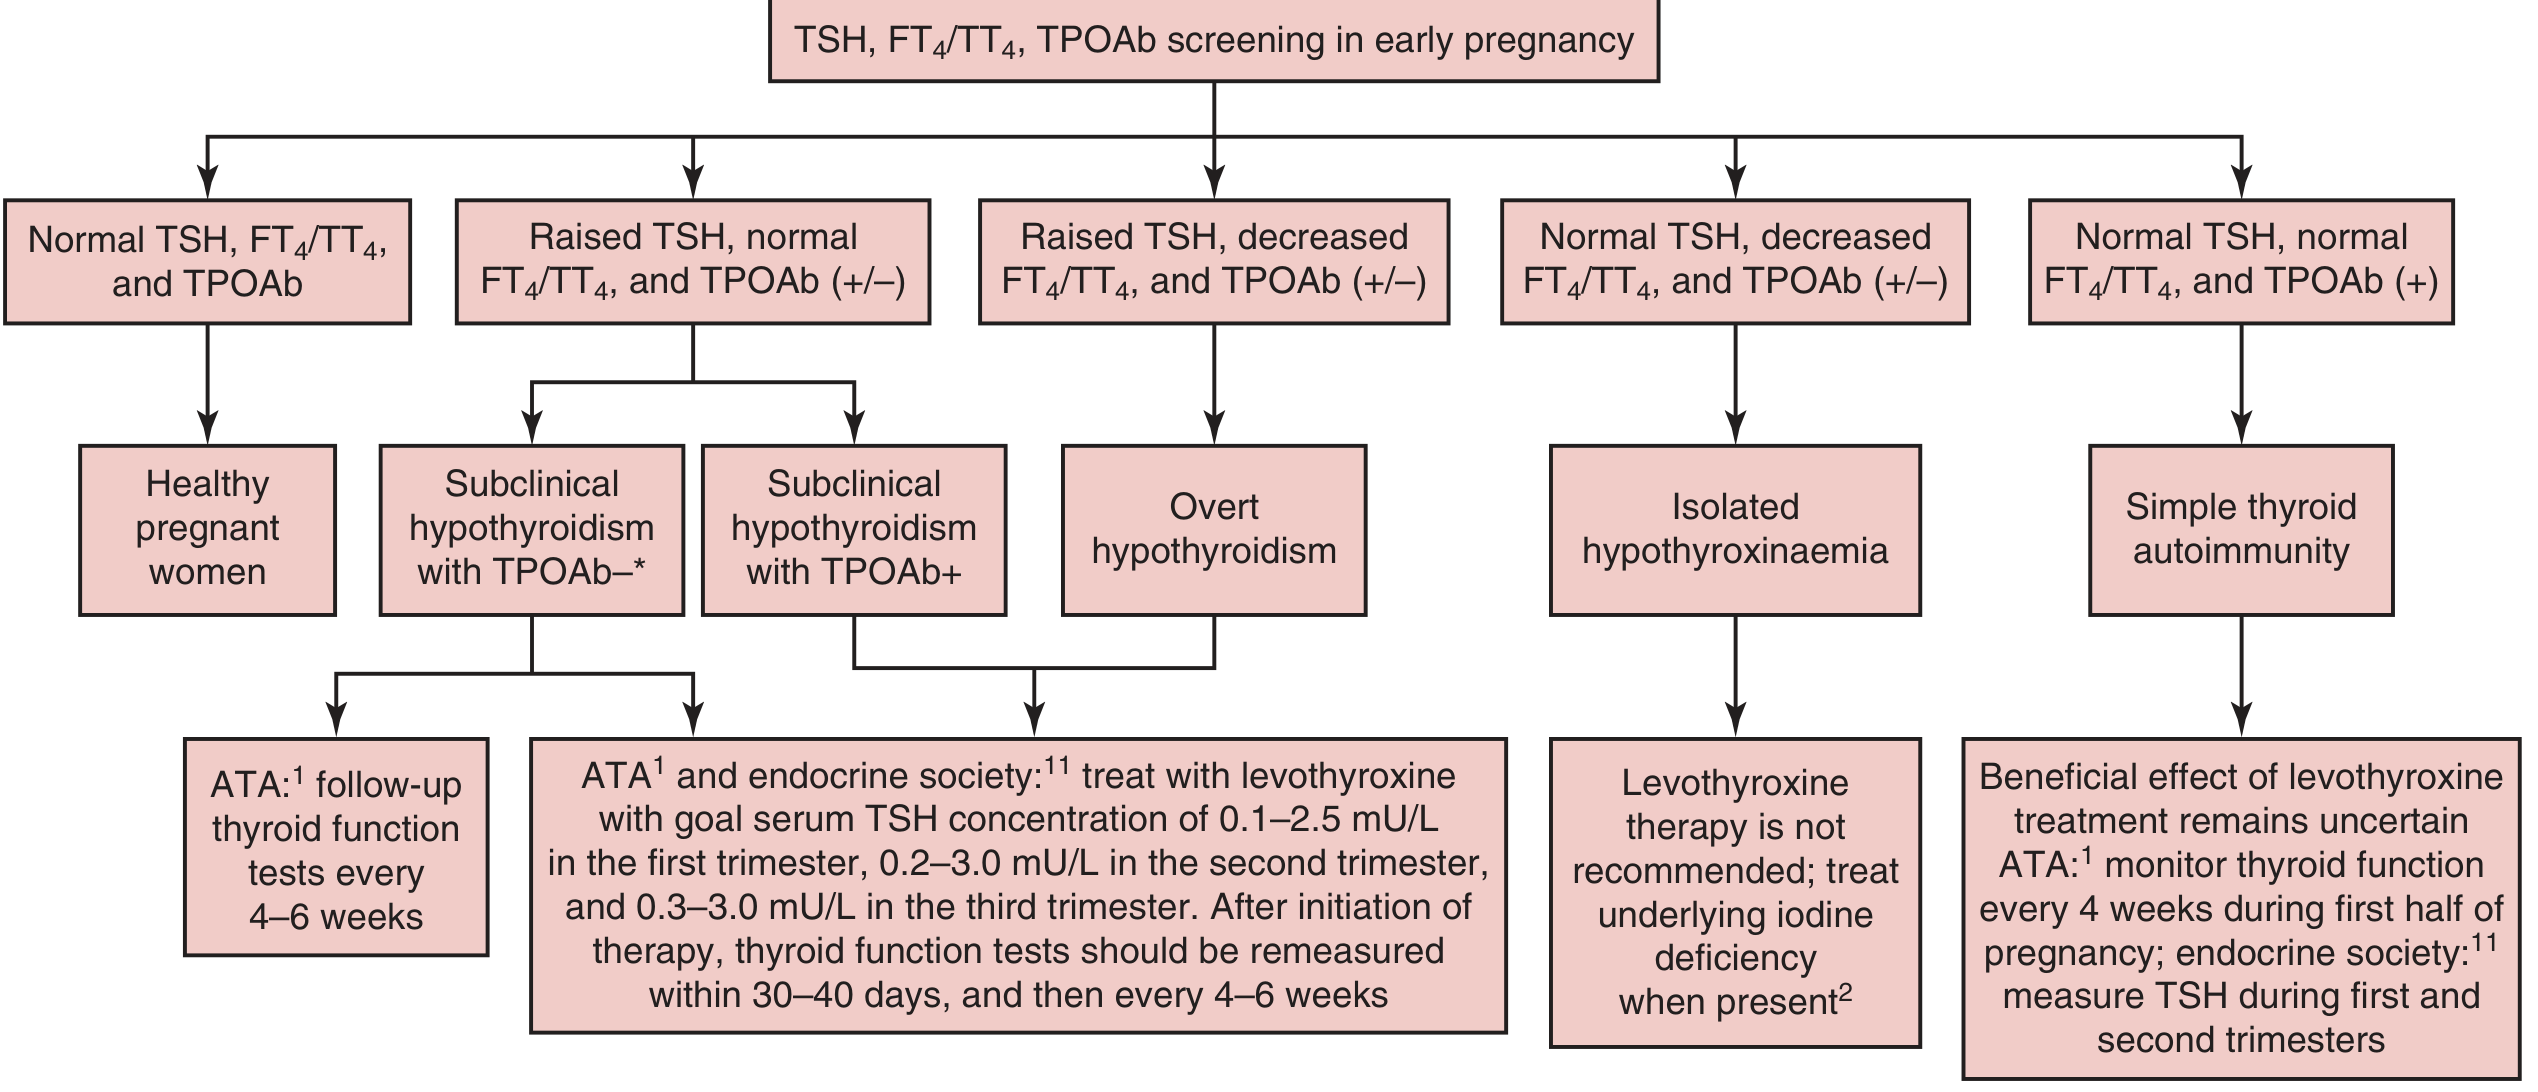
4. Screening Algorithm
5. Trimester-Specific TSH Reference Ranges
| Trimester | TSH Upper Limit | Note |
|---|---|---|
| First trimester | ~2.5 mIU/L | hCG-driven TSH suppression |
| Second trimester | ~3.0-3.1 mIU/L | Rising from first trimester nadir |
| Third trimester | ~3.0-3.5 mIU/L | Approaches nonpregnant range |
-
TSH is lower than normal in the first trimester due to hCG cross-reactivity with the TSH receptor
-
Total T4 and T3 are ~1.5x higher throughout pregnancy (estrogen increases TBG)
-
Free T4 progressively decreases into the third trimester, often falling below the nonpregnant lower reference cutoff
-
Harrison's Principles of Internal Medicine 22E, Thyroid Function in Pregnancy
6. Diagnosis Subtypes and Their Criteria in Pregnancy
| Diagnosis | TSH | FT4 |
|---|---|---|
| Overt primary hypothyroidism | ≥10 mIU/L | Low |
| Subclinical hypothyroidism | Elevated (<10 mIU/L), trimester-adjusted | Normal |
| Central/pituitary hypothyroidism | Low or low-normal | Low |
| Isolated hypothyroxinaemia | Normal | Low (2.5-5th percentile) |
| Simple thyroid autoimmunity | Normal | Normal (TPO-Ab positive) |
7. Treatment Thresholds Based on Screening Results
| Finding | Recommendation |
|---|---|
| Overt hypothyroidism (raised TSH + low FT4) | Treat immediately with levothyroxine; normalize as rapidly as possible; TSH target <2.5 mIU/L |
| SCH + TPO-Ab positive | Treat with levothyroxine (ATA and Endocrine Society) |
| SCH + TPO-Ab negative, TSH >4 mIU/L | Treat (ATA recommendation) |
| SCH + TPO-Ab negative, TSH <4 mIU/L | Do not treat (ATA); follow thyroid function every 4-6 weeks |
| Isolated hypothyroxinaemia | LT4 not recommended; treat underlying iodine deficiency if present |
| Simple thyroid autoimmunity (normal TSH + TPO-Ab+) | Benefit of LT4 remains uncertain; monitor TSH every 4 weeks in first half of pregnancy |
- Berek & Novak's Gynecology, p. 1982
8. Monitoring Frequency After Screening
- Euthyroid women with TPO antibodies: TSH each trimester
- Women started on LT4 during pregnancy: recheck thyroid function within 30-40 days, then every 4-6 weeks
- Known hypothyroid women on LT4 before pregnancy: increase dose by 25-50% at conception (add two extra tablets per week); recheck TSH at 3 weeks; monitor every 4 weeks until mid-gestation
- TSH target throughout gestation: <2.5 mIU/L
- After delivery: reduce LT4 dose back to pre-pregnancy level
9. Preconception Counselling
- Women with known hypothyroidism should have TSH <2.5 mIU/L before conception
- Dose escalation of 30-60% is anticipated in the first trimester for those with no residual thyroid reserve (e.g., post-thyroidectomy)
- Undetected hypothyroidism in early pregnancy is linked to impaired fetal neurological development - hence the urgency of increasing LT4 as soon as pregnancy is confirmed
Summary: Who to Screen and How
All pregnant women / women planning pregnancy
        ↓
Verbal risk factor assessment
        ↓
1+ risk factor present?
   YES → Serum TSH (first prenatal visit / preconception)
    NO → No routine screening (ATA/ACOG)
           (European societies may argue for universal screening)
        ↓
TSH elevated (above trimester-specific upper limit)?
   YES → Check FT4 + TPO antibodies
       → Classify (overt / subclinical / isolated / autoimmunity)
       → Treat or monitor per thresholds above
    NO → Reassure; recheck if new risk factors develop