
Metformin in 6 months gestational period
metformin gestational diabetes pregnancy second trimester
metformin 6 months pregnancy gestational diabetes safety efficacy 2024
metformin gestational diabetes mellitus maternal fetal outcomes
PMID: 38124287
PMID: 40116347
Metformin in the 6th Month of Pregnancy (Second Trimester - ~24-28 Weeks)
Why Metformin Comes Up at 6 Months
Indication and Role
- GDM diagnosed at 24-28 weeks: When glucose targets are exceeded (fasting ≥95 mg/dL, 1-hr postprandial ≥130 mg/dL, or 2-hr postprandial ≥120 mg/dL per ACOG), pharmacologic therapy is started.
- Metformin is an oral biguanide that works by reducing hepatic glucose production and improving peripheral insulin sensitivity.
- It is not FDA-approved specifically for GDM, but is increasingly used off-label alongside insulin.
- The only FDA-approved types of insulin for GDM are lispro, aspart, regular, NPH, and insulin detemir - Swanson's Family Medicine Review
Efficacy vs. Insulin
| Outcome | Risk Ratio (RR) | p-value |
|---|---|---|
| Preeclampsia | 0.61 (95% CI 0.48-0.78) | <0.0001 |
| Cesarean delivery | 0.91 (95% CI 0.85-0.98) | 0.01 |
| Macrosomia | 0.67 (95% CI 0.53-0.83) | 0.0004 |
| Neonatal hypoglycemia | 0.55 (95% CI 0.48-0.63) | <0.00001 |
| NICU admission | 0.75 (95% CI 0.66-0.86) | <0.0001 |
| Large for gestational age (LGA) | 0.80 (95% CI 0.68-0.94) | 0.007 |
- Metformin also causes less maternal weight gain than insulin, a consistent finding across multiple systematic reviews.
- Glycemic control is comparable to insulin.
Safety Profile for Mother
- Generally well tolerated in pregnancy.
- Rare serious adverse effects include metabolic acidosis and hepatitis (as with non-pregnant use).
- Less risk of maternal hypoglycemia compared to insulin - an important safety advantage.
- Not associated with fetal malformations in either animal or human studies.
- Compatible with breastfeeding (excreted in breast milk; monitoring advised) - Rosen's Emergency Medicine
The Key Concern: Placental Transfer
- The ADA 2024 Standards of Care note that in the MiG TOFU study, 9-year-old children born to GDM mothers treated with metformin (Auckland cohort) were heavier with a higher waist-to-height ratio than those exposed to insulin. This difference was not replicated in the Adelaide cohort.
- A 2026 meta-analysis and Mendelian randomization study [PMID: 41628713] assessed congenital malformations across 11 organ systems - results are awaited for definitive conclusions on structural teratogenicity.
- Long-term data presented at ENDO 2024 showed no adverse effects on children or mothers for at least 11 years post-delivery.
Guideline Positions (2024-2026)
| Organization | Recommendation |
|---|---|
| ADA 2024 | Insulin is first-line for GDM in the US; metformin/glyburide not recommended as first-line agents, but RCTs support limited efficacy |
| ACOG | Insulin preferred; oral agents (metformin, glyburide) acceptable alternatives in certain cases |
| NICE (UK) / FIGO | Metformin is accepted as a first-line option after 20 weeks gestation |
| International (various) | Guidelines vary; many accept metformin when insulin is not feasible or refused |
Practical Use at 6 Months
- Starting dose: 500 mg once or twice daily with meals, titrated up to 2500 mg/day as tolerated.
- Side effects: Nausea, diarrhea, GI upset - improved by taking with food and gradual titration.
- Supplement failure rate: 20-50% of patients on metformin alone will eventually require supplemental insulin for adequate glycemic control.
- Antenatal surveillance when GDM requires medication: twice-weekly NST or weekly BPP beginning at 32 weeks; fetal growth ultrasound every 3-4 weeks.
- Delivery timing: Well-controlled GDM on medication - by 39-40 weeks; poorly controlled - by 38-39 weeks.
Summary
Clinical note: Always individualize therapy. If a patient has pre-existing renal impairment or is at risk of lactic acidosis, metformin should be used with caution or avoided even during pregnancy.
Gestational diabetes insipidus: clinical features and management
gestational diabetes insipidus clinical features management
gestational diabetes insipidus vasopressinase desmopressin clinical features management 2024
"diabetes insipidus" pregnancy vasopressinase desmopressin
gestational diabetes insipidus vasopressin vasopressinase pathogenesis pregnancy
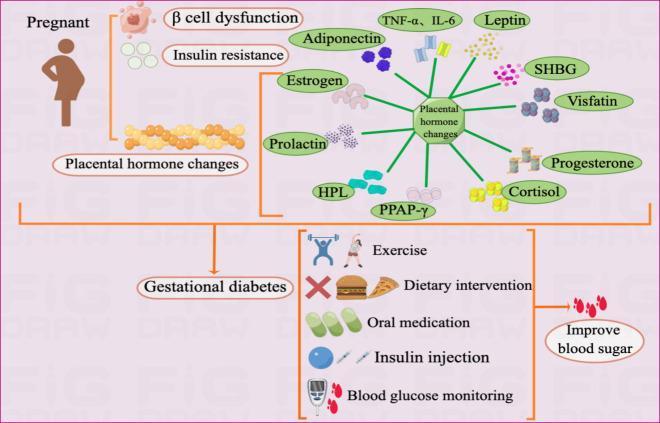
Educational infographic illustrating the pathogenesis and management of Gestational Diabetes Mellitus (GDM). The diagram is divided into sections showing contributing factors, hormonal changes, and therapeutic interventions. Pathogenesis factors listed include ̢ cell dysfunction, insulin resistance, and placental hormone changes. A central hub detailing placental dysfunction connects to various hormonal and inflammatory mediators such as TNF-̑, IL-6, Leptin, SHBG, Visfatin, Progesterone, Cortisol, PPAR-̣, HPL, Prolactin, Estrogen, and Adiponectin. The lower section of the diagram outlines management strategies categorized into non-pharmacological interventions (exercise, dietary intervention, and self-monitoring of blood glucose) and pharmacological treatments (oral medication and insulin injection). The visual workflow culminates in the educational goal of improving blood sugar levels. This schematic serves as a comprehensive overview of endocrine dysfunction during pregnancy and the multidisciplinary approach required for GDM glycemic control.
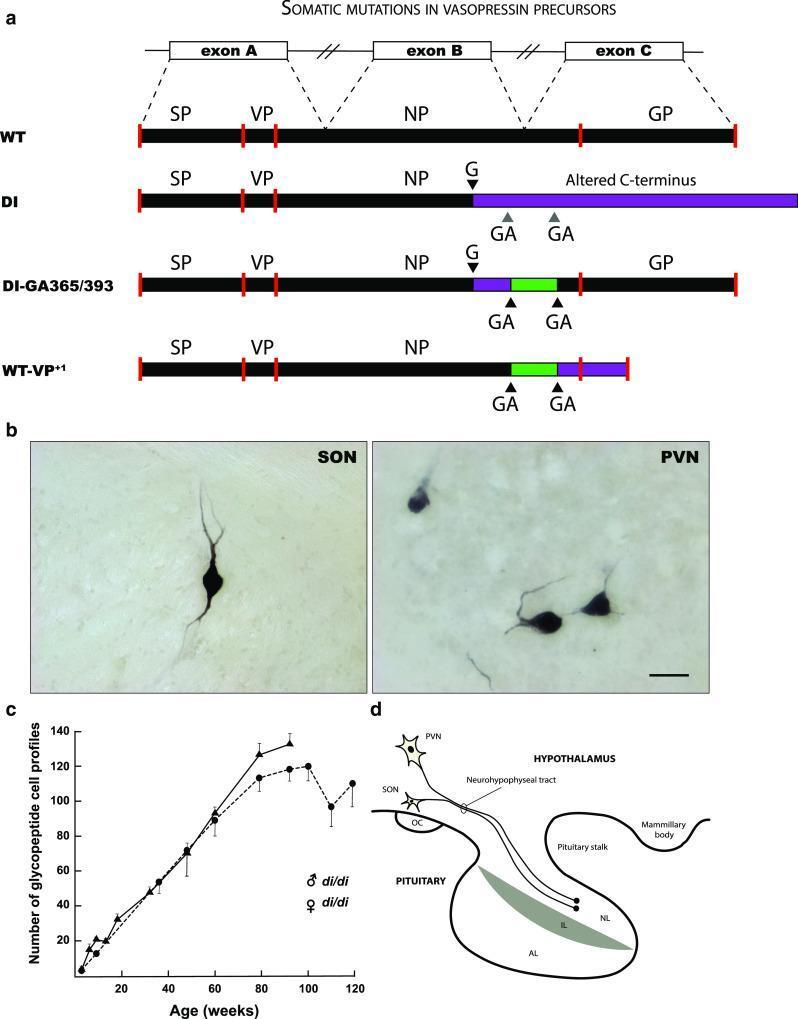
This composite educational image illustrates somatic mutations in vasopressin (VP) precursors, focusing on the homozygous Brattleboro rat model of diabetes insipidus. Panel (a) presents a molecular genetics schematic comparing wild-type (WT) VP gene structure (exons A, B, and C) with mutant forms (DI, DI-GA365/393, and WT-VP+1). It highlights a single base deletion (G) in the DI mutant causing an altered C-terminus, and secondary GA deletions that restore the reading frame in the DI-GA365/393 variant. Panel (b) features immunohistochemistry of the rat hypothalamus, showing VP-immunoreactive neurons in the supraoptic nucleus (SON) and paraventricular nucleus (PVN), demonstrating the visual result of frame-restoring somatic mutations. Panel (c) is a line graph depicting the age-dependent increase of glycopeptide-positive cell profiles in both male and female rats, indicating a steady rate of post-mitotic mutation. Panel (d) provides an anatomical diagram of the hypothalamus-pituitary axis, illustrating the axonal transport of neurosecretory granules from SON and PVN neurons through the neurohypophyseal tract to the neural lobe (NL) of the pituitary gland.
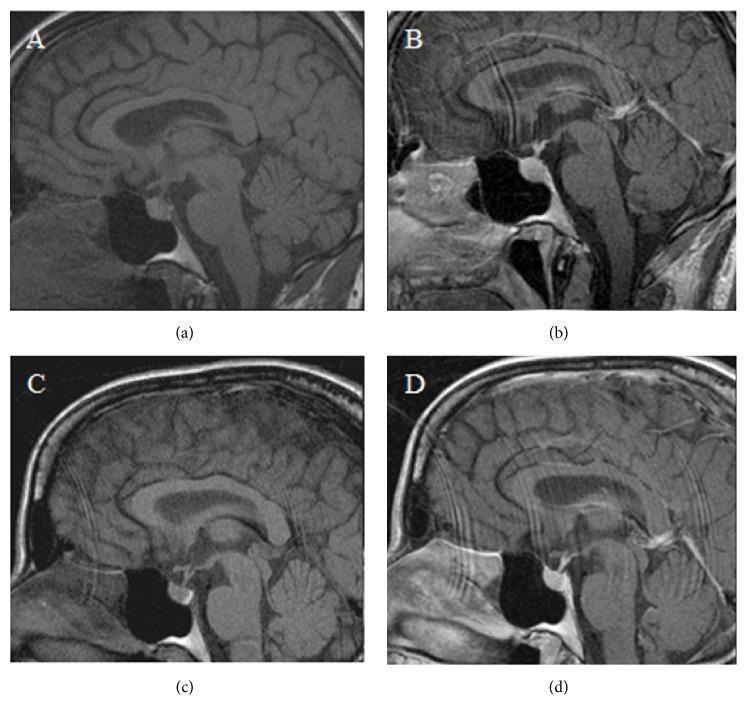
This set of four sagittal brain MRI images illustrates diagnostic findings in the pituitary region across two timepoints: immediate postpartum (a, b) and four months postpartum (c, d). Images (a) and (c) are pre-contrast T1-weighted sequences, while (b) and (d) are post-contrast sequences. The primary anatomical focus is the sella turcica containing the pituitary gland, positioned inferior to the optic chiasm and hypothalamus. In the initial postpartum scans (a, b), there is a notable absence of the normal hyperintense 'bright spot' in the posterior pituitary on T1-weighted imaging, a finding clinically associated with arginine vasopressin (AVP) depletion and transient diabetes insipidus. In contrast, the follow-up images at four months (c, d) demonstrate the reappearance of this physiological T1 hyperintensity in the posterior pituitary, signifying AVP repletion and recovery. Other midline structures, including the corpus callosum, brainstem, and cerebellum, appear morphologically normal across all frames. These images serve as an educational example of neurohypophyseal signal changes related to transient gestational or postpartum diabetes insipidus.
Gestational Diabetes Insipidus (Gestational DI): Clinical Features and Management
Pathophysiology
- Vasopressinase production by the placenta begins at 7 weeks gestation
- Peaks at 22-24 weeks, correlating with placental weight (higher in multiple pregnancies)
- Results in a marked increase in metabolic clearance of vasopressin between week 10 and midpregnancy
| Type | Mechanism | Associated Conditions |
|---|---|---|
| Type 1 (primary) | Abnormally excessive vasopressinase activity | Preeclampsia, acute fatty liver of pregnancy, HELLP syndrome - all impair hepatic vasopressinase clearance |
| Type 2 (unmasking) | Normal vasopressinase accelerates clearance in a patient with borderline vasopressin reserve | Partial central DI, compensated nephrogenic DI, histiocytosis X, Sheehan syndrome |
The liver normally clears vasopressinase isoenzymes. In acute fatty liver of pregnancy or HELLP syndrome, impaired liver function causes vasopressinase to accumulate to even higher levels, dramatically worsening AVP degradation. As the liver recovers postpartum, the transient DI resolves within 4-6 weeks. - Creasy & Resnik's Maternal-Fetal Medicine
Clinical Features
- Polyuria - the cardinal feature; >2.5 L/24 hours, with urine output >250-300 mL/hour
- Polydipsia - intense thirst secondary to polyuria (intact thirst mechanism is protective)
- Nocturia - often prominent
- Symptoms typically emerge in the latter part of gestation (peak vasopressinase around 22-24 weeks) and worsen through the third trimester
- If thirst is intact and the patient drinks adequately, she may be eunatremic - appearing relatively well despite massive polyuria
- In a pregnant woman, serum sodium ≥140 mEq/L should be considered hypernatremia (given the expected physiological drop of ~5 mmol/L)
- Severe dehydration and hypernatremia can occur if DI goes unrecognized, posing risk to both mother and fetus
- Labour and parturition are usually normal in most patients with DI; fertility and lactation are generally unaffected
- May co-occur with preeclampsia, acute fatty liver of pregnancy, HELLP syndrome
- Paradoxically, if preeclampsia develops in a patient with known DI, the DI may improve temporarily (reduced placental contribution to vasopressinase)
Diagnosis
- Confirm DI is present (hypotonic polyuria)
- Identify likely etiology
- Look for associated conditions
| Laboratory Test | Value Suggesting DI |
|---|---|
| Serum sodium | ≥140 mEq/L (hypernatremia in pregnancy) |
| Serum osmolality | ≥280 mOsm/kg |
| Urine osmolality | <300 mOsm/L |
| Urine specific gravity | <1.005 |
| 24-hour urine volume | >2.5 L |
- Hyperglycemia (gestational DM - osmotic diuresis)
- Hypercalcemia, hypokalaemia
- Diuretic use
- Primary polydipsia (psychiatric origin - serum uric acid <5 mg/dL may suggest primary polydipsia)
- Central DI and gestational DI: respond to desmopressin
- Nephrogenic DI: does NOT respond to desmopressin or AVP
Management
Drug of Choice: Desmopressin (dDAVP)
- Desmopressin is a synthetic AVP analogue that acts on V2 receptors of the renal collecting duct
- It is resistant to degradation by placental vasopressinase/cysteine aminopeptidase
- It does NOT have V1a vasopressor activity (safer cardiovascular profile)
- Has been shown to be safe for mother and fetus with growing clinical experience
- Intranasal
- Oral
- Subcutaneous (if intranasal route impaired by rhinitis of pregnancy)
Management of Associated Conditions
- In HELLP / acute fatty liver: treat the underlying liver condition; DI will resolve as liver function recovers
- In pre-existing DI entering pregnancy: doses may need adjustment; 58% deteriorate, 20% improve, 15% remain unchanged during pregnancy (Hime and Richardson review, cited in Creasy & Resnik)
Postpartum
- For new-onset gestational DI: withdraw dDAVP 4-6 weeks postpartum with close monitoring of urine output and serum sodium
- If DI persists beyond 6 weeks postpartum, investigate for an underlying hypothalamic-pituitary disorder (neoplasm, lymphocytic hypophysitis, Sheehan syndrome, histiocytosis X)
- De novo DI in the first trimester, not associated with liver dysfunction and not resolving postpartum, is most likely due to unmasking of a hypothalamic-pituitary disorder and warrants full workup
Breastfeeding
- Desmopressin is compatible with breastfeeding
- Only minimal amounts pass into breast milk; monitoring of the infant is advised
Key Summary Table
| Feature | Gestational DI | Central DI in Pregnancy | Nephrogenic DI in Pregnancy |
|---|---|---|---|
| Mechanism | Excess vasopressinase | AVP secretion defect | Renal AVP resistance |
| Timing | Mid to late pregnancy | Any time | Any time (may worsen) |
| Response to exogenous AVP | No (rapidly degraded) | Yes | No |
| Response to desmopressin | Yes | Yes | No |
| Resolution postpartum | 4-6 weeks | Persists | Variable |
| Associated conditions | HELLP, acute fatty liver, preeclampsia | Tumors, surgery, autoimmune | Lithium, congenital mutations |
| Treatment | Desmopressin | Desmopressin | Thiazides + amiloride; treat cause |
Gestational diabetes millitus : clinical features and management
"gestational diabetes mellitus" management treatment outcomes
gestational diabetes mellitus clinical features management ADA ACOG guidelines 2024 2025
gestational diabetes mellitus screening glucose tolerance test fetal macrosomia complications
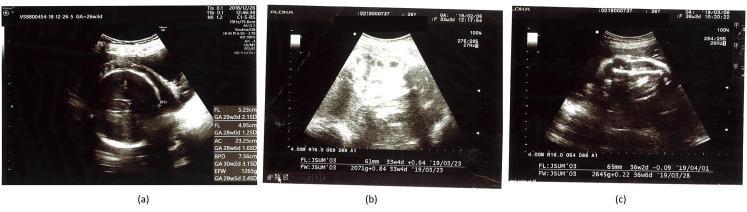
This composite diagnostic image consists of three panels (a, b, and c) showing obstetric ultrasound scans used for fetal biometry and growth monitoring in the context of Gestational Diabetes Mellitus (GDM). Panel (a) displays a transverse section of the fetal head and abdomen at 26 weeks gestation, with caliper measurements showing significantly accelerated growth. Visible biometry includes a biparietal diameter (BPD) of 7.66 cm (30w2d), femur length (FL) of 4.95 cm (28w0d), and abdominal circumference (AC) of 23.25 cm (28w6d), indicating macrosomia or large-for-gestational-age (LGA) status due to maternal hyperglycemia. Panels (b) and (c) track subsequent fetal development at 33w4d and 36w2d respectively, showing estimated fetal weights (EFW) of 2071g and 2645g. These longitudinal scans illustrate the impact of clinical interventions, such as dietary modifications and caloric restriction, on slowing excessive fetal weight gain to achieve a growth trajectory closer to the normal range. The clinical significance focuses on ultrasound's role in monitoring metabolic complications and the efficacy of glycemic control in pregnancy.
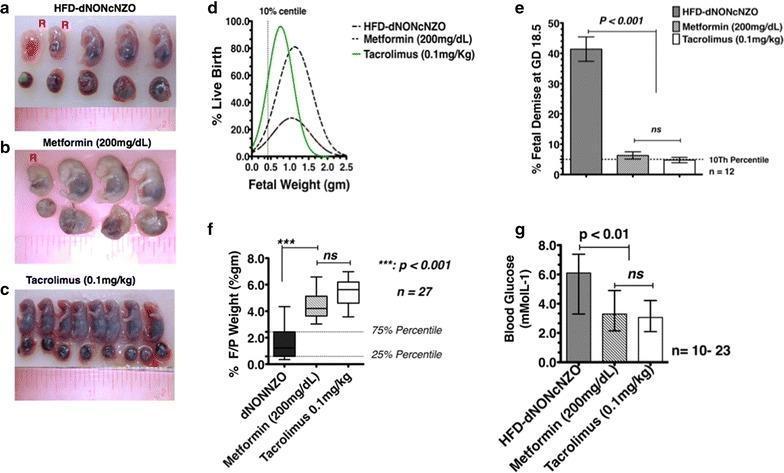
This composite educational graphic details fetal outcomes in a mouse model of gestational diabetes mellitus (GDM), comparing untreated High-Fat Diet (HFD-dNONcNZO) dams to those treated with Metformin or Tacrolimus. Panels (a-c) provide clinical photographs of fetuses at gestational day 18.5; untreated dams (a) show significantly higher rates of fetal resorption (labeled 'R') and smaller, poorly preserved fetuses compared to the larger, more numerous, and intact fetuses in the Metformin (b) and Tacrolimus (c) groups. Panels (d-g) present quantitative data confirming these findings. Graph (e) shows a statistically significant increase in percentage of fetal demise in the untreated group (p < 0.001). Panel (f) illustrates a lower fetal-to-placental (F/P) weight ratio in untreated dams, indicating impaired placental efficiency. Panel (g) records significantly elevated blood glucose levels in untreated offspring (p < 0.01) compared to the normalized levels in treated groups. The content demonstrates the therapeutic potential of Tacrolimus and Metformin in reducing hyperglycemia-induced fetal morbidity and mortality.
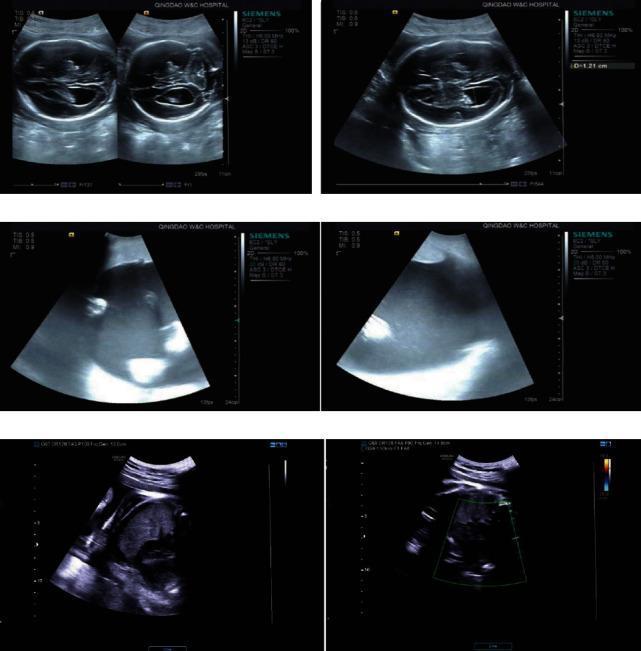
This composite image consists of six B-mode obstetric ultrasound frames arranged in a 3x2 grid, monitoring fetal health in patients with pregestational diabetes mellitus (PGDM) and gestational diabetes mellitus (GDM). The top row features transverse axial views of the fetal head, demonstrating the calvarium, midline falx, and intracranial structures such as the choroid plexus within the lateral ventricles. These views are typically used to measure the biparietal diameter (BPD) and head circumference (HC). The middle and bottom rows display sagittal and cross-sectional views of the fetal trunk, including the abdomen and thorax. Visible features include the echogenic spinal column, the hypoechoic region of the fetal stomach, and the umbilical cord insertion site. The rightmost bottom frame includes a color Doppler overlay box for assessing blood flow. The images illustrate routine morphological and biostatistical assessment in the second and third trimesters to evaluate fetal growth and potential macrosomia or anomalies associated with diabetic pregnancies.
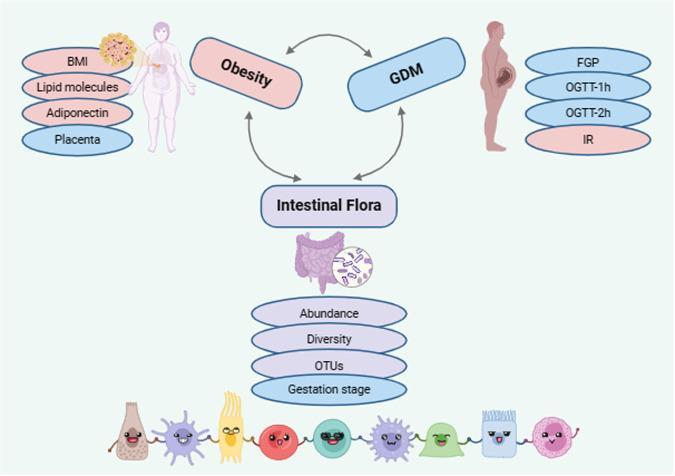
A medical conceptual diagram illustrating the tripartite relationship between Intestinal Flora, Obesity, and Gestational Diabetes Mellitus (GDM). The diagram uses a triangular configuration with bidirectional arrows to signify the mutual influence among these three metabolic states. The 'Intestinal Flora' component is associated with microbial metrics including abundance, diversity, Operational Taxonomic Units (OTUs), and the gestation stage. 'Obesity' is visually represented by an overweight silhouette and linked to physiological markers: Body Mass Index (BMI), lipid molecules, adiponectin, and the placenta. 'GDM' is represented by a silhouette of a pregnant individual and associated with diagnostic clinical indicators: Fasting Plasma Glucose (FGP), 1-hour Oral Glucose Tolerance Test (OGTT-1h), 2-hour OGTT (OGTT-2h), and Insulin Resistance (IR). The educational focus of the illustration is the role of the gut microbiome in the pathophysiology of metabolic diseases during pregnancy, highlighting how changes in gut bacteria can correlate with and potentially influence maternal adiposity and glucose regulation.
Gestational Diabetes Mellitus (GDM): Clinical Features and Management
Definition
Epidemiology
- Affects approximately 5-16% of pregnancies worldwide (IDF 2021: 16% affected by GDM or pre-existing DM)
- Prevalence is rising in parallel with global obesity rates
- In the US, about 1-2% of pregnancies are complicated by diabetes overall
- GDM is the most common medical complication of pregnancy - Goldman-Cecil Medicine
Pathophysiology
- Placental hormones - human placental lactogen (hPL), progesterone, cortisol, prolactin, and estrogen - all antagonize insulin action and cause progressive insulin resistance, peaking in the late second and third trimesters
- In normal pregnancies, the pancreatic beta cells compensate by increasing insulin secretion (up to 2-3x baseline)
- GDM occurs when beta-cell function is insufficient to overcome this insulin resistance
- There is also accelerated fasting hypoglycaemia and accelerated starvation due to enhanced glucose utilisation by the feto-placental unit
Risk Factors
| Category | Risk Factors |
|---|---|
| Constitutional | Obesity (BMI ≥25, or ≥23 in Asian women), advanced maternal age |
| Metabolic | Pre-diabetes, PCOS, metabolic syndrome |
| Obstetric history | Previous GDM, previous macrosomic baby (>4 kg), unexplained stillbirth, previous congenital anomaly |
| Family history | First-degree relative with type 2 DM |
| Other | Glycosuria on urinalysis, multiple pregnancy, certain ethnicities (South Asian, East Asian, Hispanic, African) |
Clinical Features
- Increased thirst (polydipsia)
- Increased urination (polyuria)
- Fatigue
- Recurrent vaginal candidiasis
- Glycosuria on routine urinalysis
- Polyhydramnios on ultrasound (excess liquor due to fetal osmotic diuresis)
- Large-for-dates fundal height
- Fetal macrosomia on ultrasound
Complications
Maternal Complications
- Preeclampsia and pregnancy-induced hypertension
- Diabetic ketoacidosis (rare, occurs at lower blood glucose levels than in non-pregnant adults - at ~200 mg/dL rather than >300)
- Increased risk of operative delivery (caesarean section)
- Long-term: ~50% risk of developing type 2 diabetes within 10 years; 7x higher lifetime diabetes risk vs. women without GDM - Creasy & Resnik; 35-60% risk over 10-20 years - Harrison's 22E
Fetal/Neonatal Complications
| Complication | Mechanism |
|---|---|
| Macrosomia (birth weight >4000 g) | Fetal hyperinsulinaemia in response to maternal hyperglycaemia → excess fat deposition, especially trunk/shoulders |
| Shoulder dystocia | Disproportionate fetal body weight distribution (shoulders/chest) regardless of total weight |
| Birth trauma | Brachial plexus injury, clavicle fracture from difficult delivery |
| Neonatal hypoglycaemia | Fetal hyperinsulinaemia persists after birth when maternal glucose supply stops |
| Polycythaemia and hyperbilirubinaemia | Fetal hypoxia triggers erythropoiesis |
| Respiratory distress syndrome | Fetal hyperinsulinaemia delays lung maturation (inhibits surfactant) |
| Stillbirth | Primarily in poorly controlled or late-detected GDM |
| Polyhydramnios | Fetal osmotic diuresis |
| Long-term in offspring | Increased risk of obesity, metabolic syndrome, and type 2 DM in childhood/adulthood |
Screening and Diagnosis
Who to Screen and When
| Timing | Population |
|---|---|
| First antenatal visit | Women with risk factors for type 2 DM (obesity + ≥1 risk factor) - screen using standard diabetes criteria (FPG, HbA1c, or random glucose) |
| 24-28 weeks | All pregnant women not previously diagnosed with diabetes |
Two Approaches to Screening/Diagnosis
Fasting overnight → 75 g oral glucose → measure at 0, 1, and 2 hours GDM diagnosed if any one value meets or exceeds:
| Timepoint | Threshold |
|---|---|
| Fasting | ≥92 mg/dL (5.1 mmol/L) |
| 1 hour | ≥180 mg/dL (10.0 mmol/L) |
| 2 hours | ≥153 mg/dL (8.5 mmol/L) |
- Plasma glucose at 1 hour
- If ≥130-140 mg/dL → proceed to Step 2
GDM diagnosed if ≥2 values meet or exceed (Carpenter-Coustan criteria):
| Timepoint | Carpenter-Coustan | NDDG |
|---|---|---|
| Fasting | 95 mg/dL | 105 mg/dL |
| 1 hour | 180 mg/dL | 190 mg/dL |
| 2 hours | 155 mg/dL | 165 mg/dL |
| 3 hours | 140 mg/dL | 145 mg/dL |
One abnormal value = "gestational glucose intolerance" (not GDM) but still carries increased risk of macrosomia.
GDM Classification (ACOG)
- Class A1GDM: Controlled by diet and lifestyle alone
- Class A2GDM: Requires pharmacologic therapy
Management
Step 1: Diet and Exercise (First-Line for All)
- Carbohydrates: Limit to 35-40% of total calories; emphasise complex over refined carbohydrates
- Protein: ~20% of calories
- Fat: ~40% of calories (predominantly unsaturated)
- Meal pattern: 3 meals + 2-3 snacks daily to distribute glucose load and minimise postprandial spikes
- Total calories: individualised (generally 1800-2400 kcal/day based on pre-pregnancy BMI); weight loss and severe caloric restriction are not recommended
- Fasting or failure to gain physiological weight is not recommended
- Most pre-pregnancy exercise can be safely continued
- For sedentary women: brisk walking 20-30 minutes, 3-5 times per week
- Exercise improves insulin sensitivity and reduces postprandial glucose excursions
Step 2: Home Glucose Monitoring
- Fasting morning glucose
- 1 or 2 hours after each meal begins
| Measurement | Target |
|---|---|
| Fasting | <95 mg/dL (range 70-95) |
| 1-hour postprandial | <140 mg/dL (range 110-140) |
| 2-hour postprandial | <120 mg/dL (range 100-120) |
| CGM target range | 63-140 mg/dL |
| Time above range (CGM) | <25% |
| HbA1c goal | <6% (pregnancy-adjusted due to increased RBC turnover) |
Step 3: Pharmacologic Therapy (Class A2GDM)
- Rapid-acting: lispro (Humalog), aspart (NovoLog)
- Short-acting: regular insulin
- Intermediate: NPH (Humulin, Novolin)
- Long-acting: insulin detemir (Levemir)
- Note: glargine (Lantus) is not FDA-approved for GDM
- Total dose: 0.7-1.0 units/kg/day in divided doses
- Morning (2/3 of total dose): 1/3 regular + 2/3 NPH before breakfast
- Evening (1/3 of total dose): 1/2 regular + 1/2 NPH before dinner
- Titrate based on 4x/day capillary glucose (fasting + 2h after each meal)
- Insulin requirements increase with advancing gestation as placenta grows
- Metformin and glyburide are widely used off-label when insulin is not feasible/refused
- Both are not FDA-approved for GDM
- Metformin: comparable glycaemic control to insulin; less maternal weight gain; lower neonatal hypoglycaemia; crosses the placenta (long-term offspring effects under study)
- Glyburide: does NOT cross the placenta; stop ~2 weeks before delivery to prevent neonatal hypoglycaemia
- ADA 2025 still formally recommends insulin as first-line for GDM in the US; UK (NICE) and many international guidelines accept metformin as first-line after 20 weeks
Antenatal Surveillance
| GDM Class | Surveillance |
|---|---|
| A1GDM (diet-controlled) | Managed like a normal pregnancy; NST/BPP generally unnecessary; fundal height at every visit; induction by 40-41 weeks |
| A2GDM (on medication) | Twice-weekly NST or weekly BPP beginning at 32 weeks; fetal growth ultrasound every 3-4 weeks |
| Poorly controlled GDM | Delivery by 38-39 weeks |
| Well-controlled A2GDM | Delivery by 39-40 weeks |
Postpartum Management
- Discontinue anti-diabetic medications immediately after delivery (GDM resolves with delivery of the placenta)
- Screen at 4-12 weeks postpartum using standard non-pregnant OGTT criteria (not HbA1c alone)
- If normal postpartum: lifelong screening for diabetes or pre-diabetes every 3 years (ADA)
- Lifestyle intervention and metformin both reduce progression to T2DM by 35-40% over 10 years in women with prediabetes and a history of GDM
- Breastfeeding is encouraged (improves maternal insulin sensitivity; does not require cessation of metformin)
- GDM is a marker of significantly increased long-term cardiovascular risk (50-85% higher CVD risk), independent of subsequent T2DM development - Creasy & Resnik
Summary Flow
24-28 weeks → Screening OGTT
       ↓
   GDM Diagnosed
       ↓
Diet + Exercise (2 weeks)
       ↓
Monitor blood glucose (fasting + 1-2h postprandial)
       ↓
Targets not met → Add Insulin (or metformin/glyburide)
       ↓
Antenatal surveillance (NST, fetal growth scans)
       ↓
Delivery at 39-40 weeks (well-controlled A2) or 40-41 weeks (A1)
       ↓
Postpartum OGTT at 4-12 weeks → 3-yearly lifelong screening
Recent evidence note: A 2024 Cochrane systematic review [PMID: 37815094] found no clear optimal intensity of glycaemic control targets for GDM - stricter control reduces macrosomia but increases small-for-gestational-age births and caesarean rates. A 2024 systematic review [PMID: 39421534] confirmed that structured exercise therapy significantly improves glycaemic outcomes in GDM.The comprehensive answer has been provided above. Here is a brief recap of what was covered:
- 1-step: 75-g OGTT - positive if any value ≥92/180/153 mg/dL (fasting/1h/2h)
- 2-step: 50-g GCT screen → 100-g 3-hour GTT if positive (≥2 abnormal values = GDM by Carpenter-Coustan: 95/180/155/140 mg/dL)
- Diet (35-40% carbs) + exercise
- Glucose monitoring (fasting + 1-2h postprandial)
- Insulin if targets not met (first-line, FDA-approved); metformin/glyburide as alternatives
- Antenatal surveillance: A1GDM = minimal; A2GDM = NST/BPP from 32 weeks, growth scans
- Delivery by 39-40 weeks (A2) or 40-41 weeks (A1)
- Postpartum OGTT at 4-12 weeks; 3-yearly lifelong screening