
Open angle Glaucoma
"open-angle glaucoma"[MeSH Terms] AND treatment
open angle glaucoma optic disc cupping visual field defect
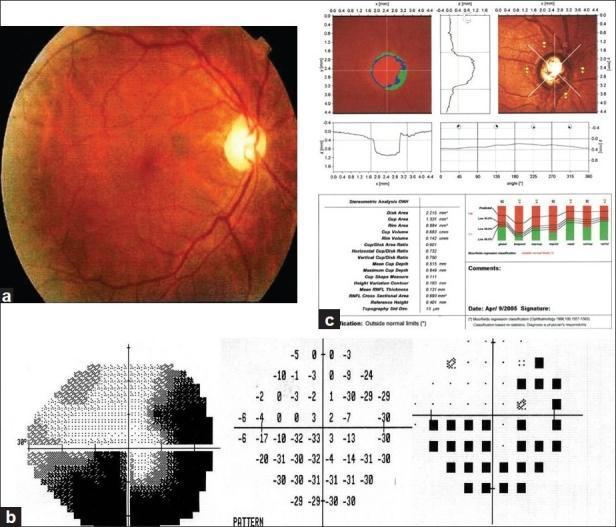
This composite ophthalmological diagnostic image illustrates clinical findings in Primary Open Angle Glaucoma (POAG). Panel A shows a color fundus photograph of the right eye with a prominent reddish-orange background and a centrally located optic disc exhibiting pathologic cupping, with a cup-to-disc ratio of 0.7. Panel B presents Automated Static Perimetry (visual field test) results, demonstrating a significant inferior altitudinal defect and a superior temporal arcuate scotoma, visualized through grayscale maps and numerical sensitivity data. Panel C displays Heidelberg Retina Tomograph (HRT) data, providing topographic analysis of the optic nerve head. The HRT report includes stereometric analysis, cross-sectional profiles of the optic cup, and a Moorfields regression classification indicating findings 'outside normal limits.' The educational focus is on the clinical correlation between anatomical optic nerve changes and functional visual field loss in glaucomatous neuropathy.
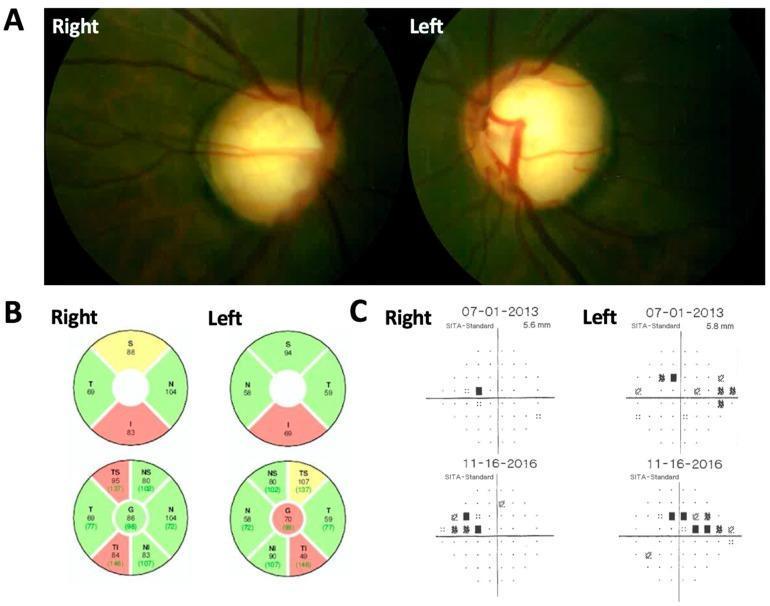
This composite ophthalmological image presents clinical assessments for juvenile open-angle glaucoma (JOAG). Panel A displays bilateral fundus photographs showing advanced glaucomatous optic neuropathy, characterized by severe optic disc cupping with a cup-to-disc ratio of approximately 0.9 and marked pallor in both the right and left eyes. Panel B presents Optical Coherence Tomography (OCT) Retinal Nerve Fiber Layer (RNFL) thickness maps. These circular charts utilize color-coding (green for normal, yellow for borderline, and red for thinning) to demonstrate significant thinning in the superior and inferior quadrants bilaterally. Panel C shows Humphrey Visual Field (HFA) SITA-Standard tests over a three-year progression (2013 to 2016). The right eye displays a developing superior nasal step defect, while the left eye shows more advanced progression of both superior and inferior nasal field loss. The combination of high cup-to-disc ratios, structural RNFL loss on OCT, and corresponding functional visual field defects illustrates the diagnostic triad of advanced glaucoma progression.
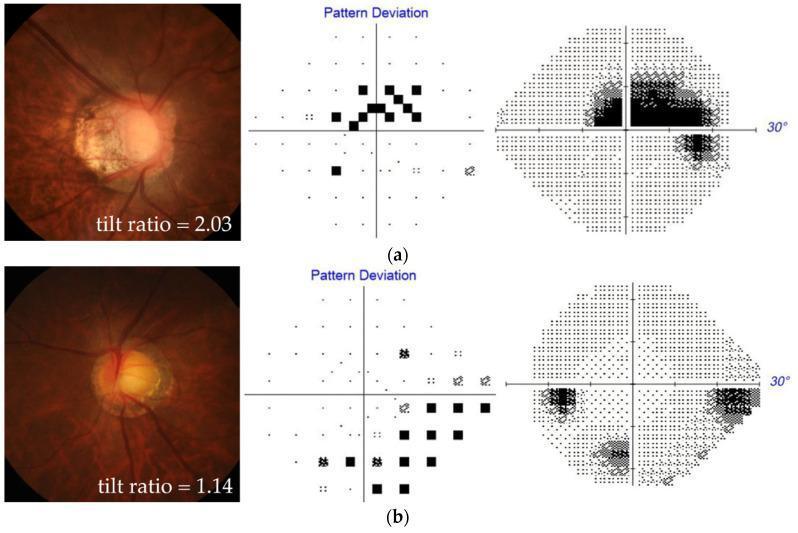
A comparison of optic disc morphology and visual field defects in two patients with myopia and open-angle glaucoma (OAG). The image is organized into two rows, (a) and (b), each featuring three components: stereo disc photography, a Humphrey perimetry pattern deviation plot, and a grayscale visual field map. Patient (a) displays high optic disc tilt (tilt ratio 2.03) with significant elongation and a shifted central retinal vessel trunk. This correlates with a paracentral scotoma, visible as a cluster of significant defects within the central 10 degrees on the pattern deviation plot and a dense superior/central defect on the grayscale map. Patient (b) shows a less tilted, more circular optic disc (tilt ratio 1.14) associated with peripheral scotoma. The perimetry for patient (b) illustrates defects primarily in the inferior and superior peripheral regions, with relative sparing of the central field. This comparison illustrates the relationship between myopic optic disc deformation (tilt) and the localization of glaucomatous visual field loss, highlighting the difference between paracentral and peripheral scotoma patterns in highly myopic eyes.
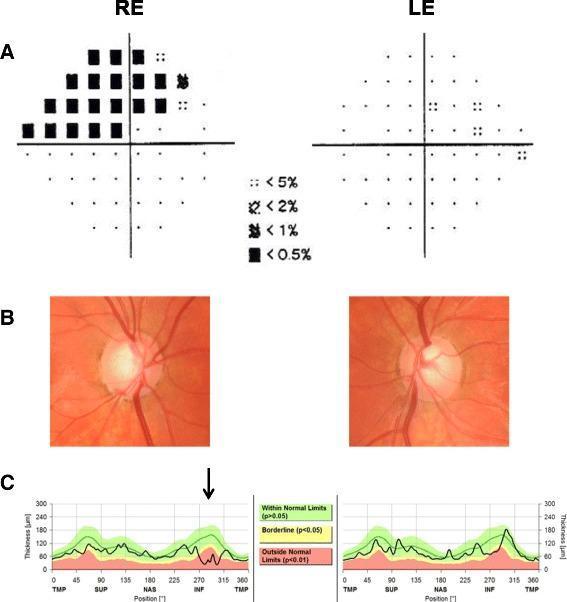
This composite ophthalmological diagnostic image presents the clinical findings of Juvenile Open-Angle Glaucoma (JOAG) in a comparison of the right eye (RE) and left eye (LE). Panel A displays Humphrey visual field pattern deviation maps, showing a dense superior arcuate defect involving fixation in the right eye, while the left eye remains relatively clear. Panel B contains color fundus photographs of the optic discs; the right disc shows an inferotemporal notch and a subtle disc hemorrhage, with both eyes exhibiting significant glaucomatous cupping. Panel C illustrates Optical Coherence Tomography (OCT) retinal nerve fiber layer (RNFL) thickness profiles. The right eye demonstrates significant thinning in the inferior quadrant (indicated by a black arrow), with the profile falling into the red 'Outside Normal Limits' (p < 0.01) zone. The left eye shows better preservation of the RNFL, though some thinning is present. Collectively, these images illustrate asymmetric glaucomatous optic neuropathy and the correlation between structural nerve fiber loss and functional visual field defects.
Primary Open-Angle Glaucoma (POAG)
Definition
- Retinal nerve fibre layer (RNFL) thinning
- Glaucomatous optic nerve damage
- Characteristic visual field loss as damage progresses
- An open anterior chamber angle on gonioscopy
- Absence of secondary glaucoma signs
- IOP as the key modifiable risk factor
Epidemiology
- Most prevalent glaucoma type in people of European and African ethnic origin
- Prevalence in those >70 years: ~6% in White, 16% in Black, ~3% in Asian populations
- Affects both genders equally
- Risk to siblings of POAG patients: ~4x normal; to offspring: ~2x normal
Risk Factors
| Risk Factor | Notes |
|---|---|
| Elevated IOP | Higher IOP = greater risk; asymmetry ≥4 mmHg is significant |
| Age | More common with advancing age |
| Race | ~4x more common in Black patients; earlier onset, harder to control |
| Family history | First-degree relatives at significantly increased risk |
| Myopia | Associated with increased incidence; eyes may be more susceptible to damage |
| Thin central cornea | Independent risk factor for progression |
| Anti-VEGF therapy | Repeated intravitreal injections (esp. bevacizumab) can cause sustained IOP elevation |
Pathophysiology
Clinical Features
Symptoms
- Usually asymptomatic until late stages - this is the key danger of POAG
- Visual field defects (peripheral first, then central)
- Bilateral, but often asymmetric presentation
- Central fixation loss only in advanced disease
Signs
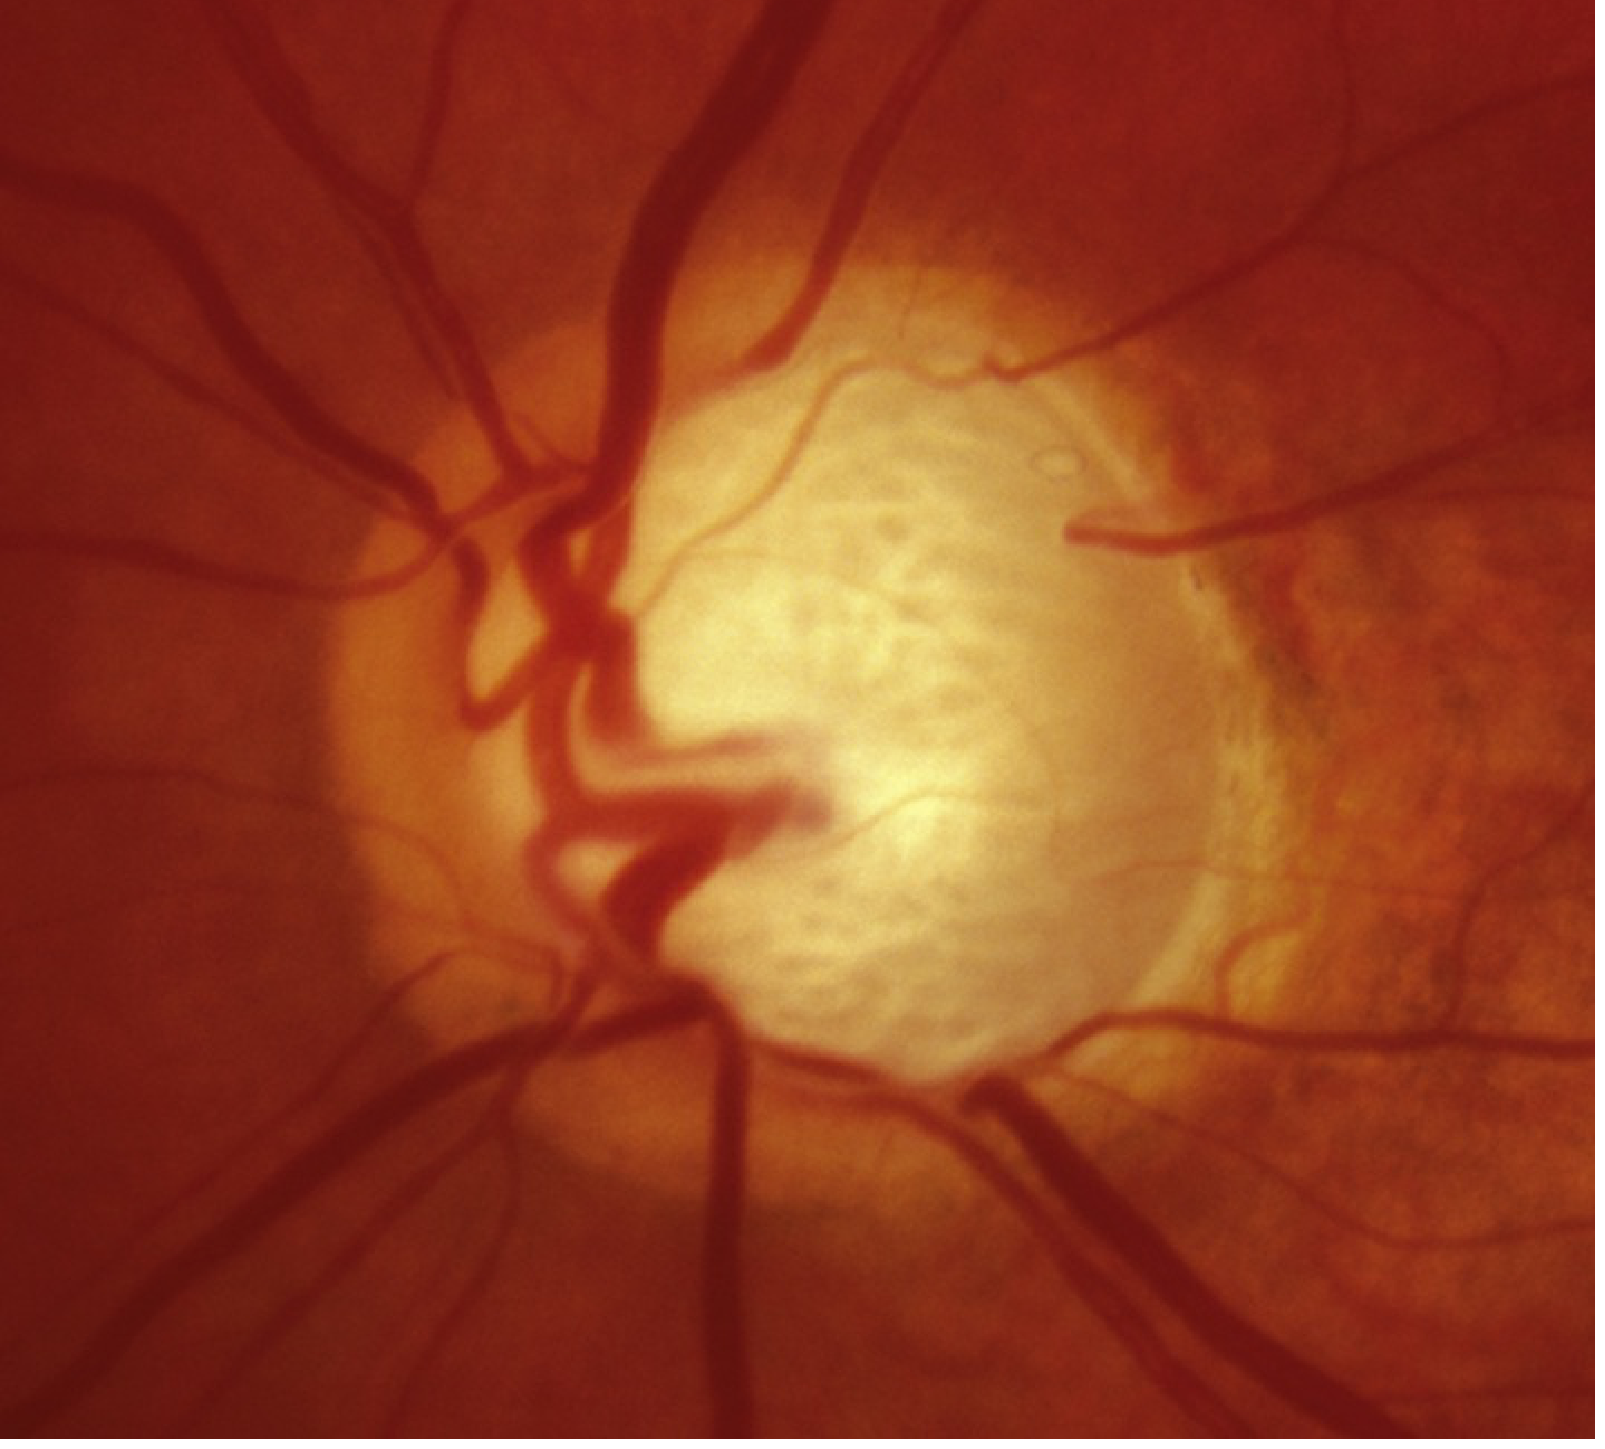
- Increased cup-to-disc (C:D) ratio - C:D >0.5 is suspicious; >0.65 is likely pathological
- Neuroretinal rim (NRR) loss - follows the ISNT rule (inferior > superior > nasal > temporal); loss of this rule suggests glaucoma
- Bayonetting of vessels - vessels appear to disappear at cup rim and re-emerge
- Disc hemorrhages - more common in NTG; a risk factor for progression
- RNFL defects - wedge-shaped defects, best seen in red-free illumination
- Asymmetry of C:D ratio between eyes (>0.2 difference) is significant
| DDLS Stage | Narrowest rim width (rim/disc ratio) |
|---|---|
| 1-5 | "At Risk" - 0.1 to ≥0.4 |
| 6-10 | "Glaucoma Damage" - 0 (absent rim) in varying arc extents |
Visual Field Defects
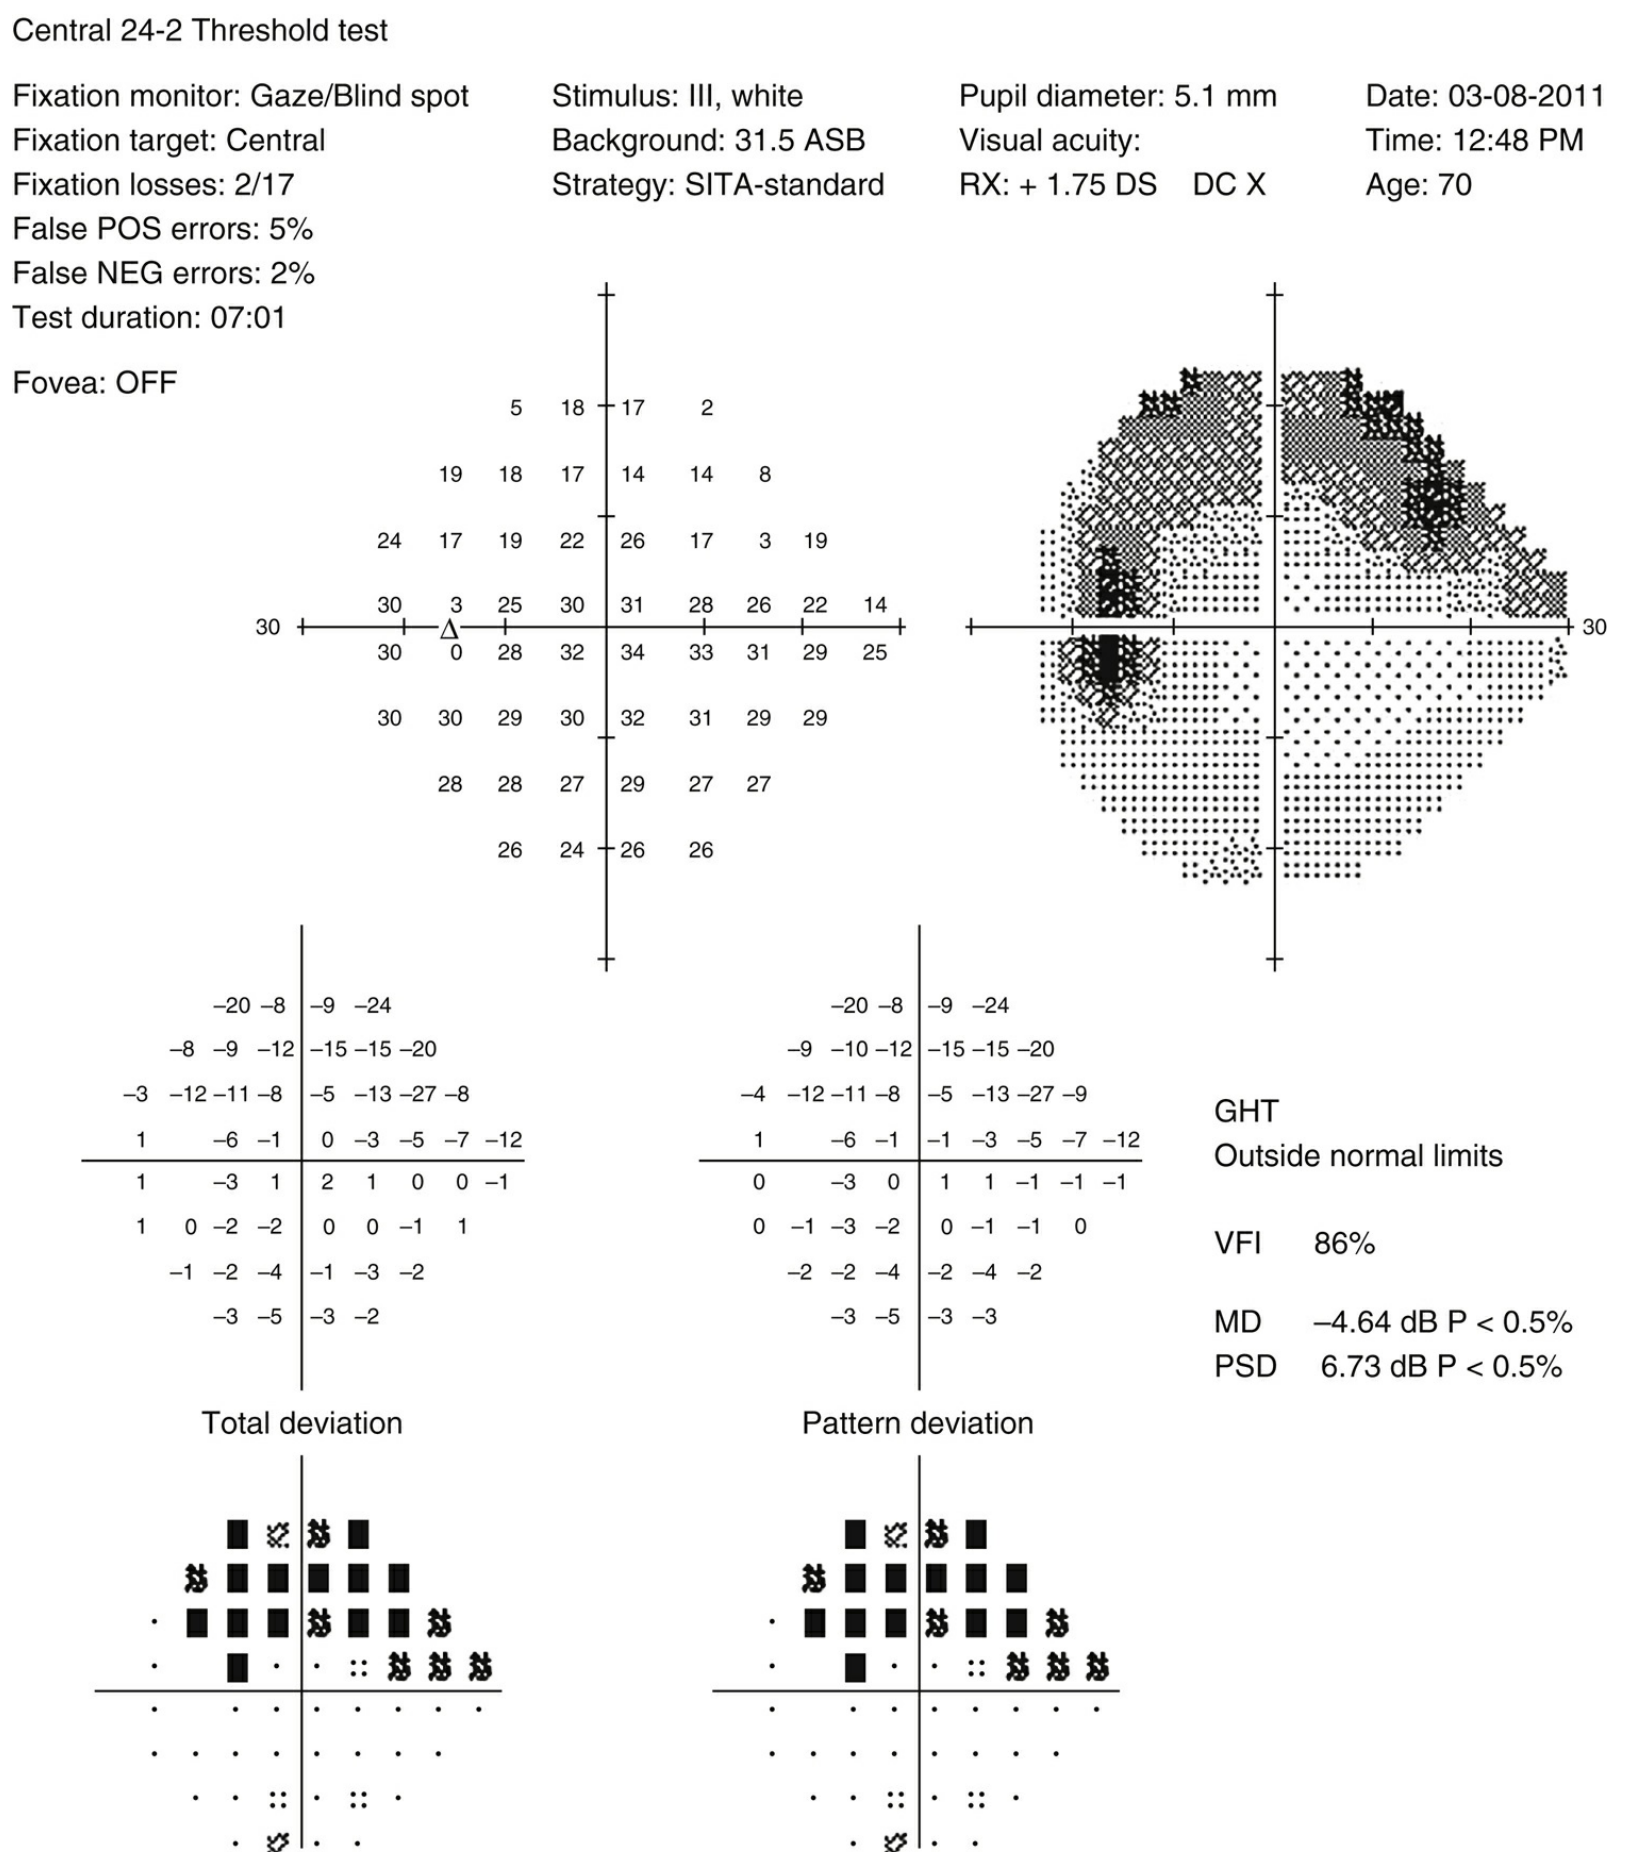
- Nasal step - early sign; asymmetric loss across horizontal midline nasally
- Paracentral scotoma - within 10-20° of fixation
- Arcuate (Bjerrum) scotoma - arcs from blind spot to nasal horizontal raphe
- Ring scotoma - coalescence of superior and inferior arcuate defects
- Advanced loss - temporal island + central island remaining, then complete loss
Investigations
| Investigation | Finding |
|---|---|
| Tonometry | IOP >21 mmHg (but normal IOP doesn't exclude diagnosis) |
| Gonioscopy | Open angle; no PAS; identifies secondary causes |
| Optic disc assessment | C:D ratio, rim loss, hemorrhages |
| Visual field testing (Perimetry) | Arcuate defects, nasal steps, paracentral scotomas |
| OCT (RNFL thickness) | Thinning in superior and/or inferior quadrants |
| Central corneal thickness (CCT) | Thin CCT = independent risk factor; affects IOP readings |
| HRT (Heidelberg Retina Tomograph) | Optic nerve head topography - "outside normal limits" in glaucoma |
Diagnosis
- Glaucomatous optic neuropathy (disc changes + RNFL loss)
- Corresponding visual field defects
- Open angle on gonioscopy (with no secondary cause)
Natural History
- High-tension glaucoma (HTG): -1.31 dB/year
- Normal-tension glaucoma (NTG): -0.36 dB/year
- Pseudoexfoliation glaucoma: -3.13 dB/year (fastest progression)
Management
Target IOP
Step 1 - Topical Medical Therapy
| Drug Class | Examples | Mechanism | Key Considerations |
|---|---|---|---|
| Prostaglandin analogues (1st line) | Latanoprost, bimatoprost, travoprost, tafluprost | ↑ uveoscleral outflow | Once-daily dosing; few systemic effects; may cause iris color change, lash growth |
| Beta-blockers | Timolol, betaxolol, levobunolol | ↓ aqueous secretion | Avoid in asthma, bradycardia, heart block, heart failure |
| Alpha-2 agonists | Brimonidine, apraclonidine | ↓ aqueous secretion + ↑ outflow | Avoid in patients on MAOIs; allergy common |
| Carbonic anhydrase inhibitors (CAI) - topical | Dorzolamide, brinzolamide | ↓ aqueous secretion | Less effective than PGs/BBs; added as adjunct |
| Rho kinase inhibitors | Netarsudil | ↑ trabecular outflow | Newer agent; conjunctival hyperemia common |
| Cholinomimetics (miotics) | Pilocarpine, carbachol | Ciliary muscle contraction → opens TM | Higher topical side effects; miosis causes dim vision |
Nasolacrimal occlusion tip: Patients should press a fingertip into the inner canthus to occlude the punctum for 10 seconds after instilling drops (or keep eyelids closed 1-2 minutes) to reduce systemic absorption. - Wills Eye Manual
Step 2 - Laser Therapy
- Selective Laser Trabeculoplasty (SLT): Can be used as first-line therapy or adjunct; equivalent IOP-lowering to ALT; uses lower energy, causes less tissue damage - can be repeated
- Argon Laser Trabeculoplasty (ALT): Initial success ~70-80%, drops to ~50% at 2-5 years; not repeatable
Step 3 - Surgery
- Trabeculectomy (guarded filtration surgery): Creates a drainage bleb; adjunctive antimetabolites (mitomycin C, 5-fluorouracil) improve efficacy but increase risk of bleb leaks and hypotony
- Tube-shunt (glaucoma drainage devices): Ahmed, Baerveldt valves for refractory cases
- MIGS (Minimally Invasive Glaucoma Surgery): Newer category (iStent, Kahook blade, XEN gel stent) - lower risk profile, moderate IOP reduction
Systemic CAI (acute/refractory)
- Acetazolamide (125-500 mg PO/IV), methazolamide
- Avoid in renal failure; monitor potassium; common side effects: fatigue, nausea, paresthesias; rare: aplastic anemia, Stevens-Johnson syndrome
Follow-Up
- Recheck 4-6 weeks after starting a new beta-blocker or prostaglandin, or after SLT/ALT
- Topical CAIs and alpha-agonists reach steady state faster; can be re-examined sooner
- Regular visual field testing and OCT to monitor for progression
Normal-Tension Glaucoma (NTG)
- More common in Japanese populations and women
- More common disc hemorrhages
- Greater emphasis on vascular risk factors (vasospasm, nocturnal hypotension, sleep apnea)
- Treatment still targets IOP reduction (even normal IOP); systemic vascular optimization important
Diagnostic Images
Key Takeaway Points
- Silent thief of sight - asymptomatic until late; mass screening is important
- Open angle + optic nerve damage + visual field loss = POAG (distinguish from angle-closure!)
- IOP is the only modifiable risk factor proven by treatment trials
- Prostaglandin analogues are first-line monotherapy
- SLT can be considered first-line, especially when adherence to drops is a concern
- Regular monitoring of optic disc structure (OCT-RNFL) AND function (perimetry) is essential
- Pseudoexfoliation glaucoma has the fastest progression rate among open-angle subtypes