
Give me a best image/diagram for visual tract lesion with associated field defect for exam
visual pathway tract lesion visual field defect diagram
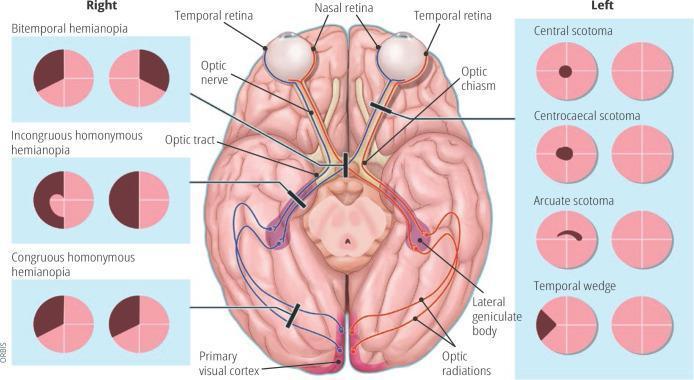
Anatomical diagram and educational infographic detailing the human visual pathway and associated visual field defects. The central illustration shows a superior (dorsal) view of the brain, highlighting the optic nerve, optic chiasm (decussation point), optic tract, lateral geniculate body, optic radiations, and the primary visual cortex in the occipital lobes. Pathways are color-coded (red and blue) to demonstrate the transition from nasal and temporal retinal fibers to the contralateral and ipsilateral hemispheres. Black lesion bars indicate specific sites of damage along this pathway. Flanking the central diagram are clinical representations of visual field loss patterns. The 'Right' panel displays bilateral defects including bitemporal hemianopia, incongruous homonymous hemianopia, and congruous homonymous hemianopia. The 'Left' panel displays unilateral or localized defects including central scotoma, centrocaecal scotoma, arcuate scotoma, and temporal wedge. This diagram serves as a neuro-ophthalmological guide for localizing lesions within the central nervous system based on perimetry findings.
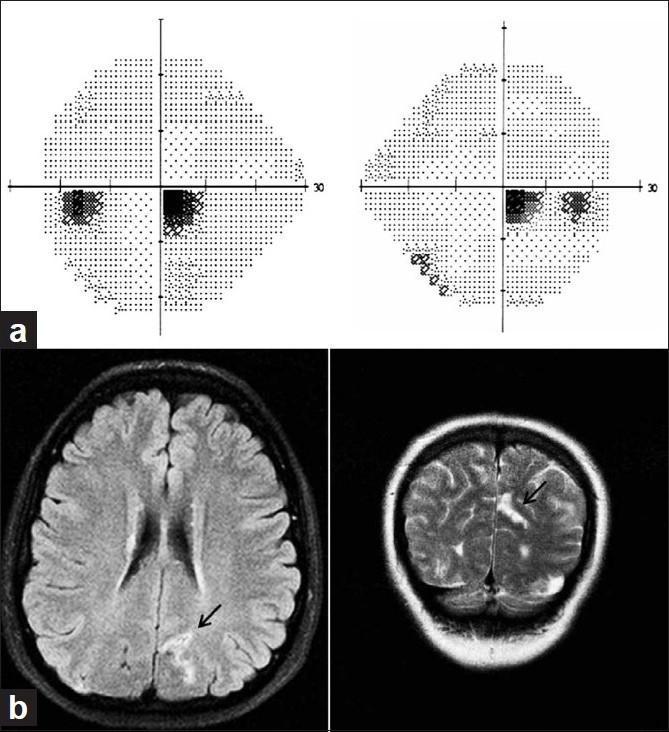
This composite educational image illustrates the correlation between clinical visual field testing and neuroimaging. Panel (a) displays a Standard Automated Perimetry (SAP) gray-scale plot showing a right inferior homonymous scotoma. The visual field defects are characterized by clusters of dark points primarily localized in the inferior-right quadrant of both eyes, signifying localized paracentral vision loss. Panel (b) contains two MRI brain scans: an axial FLAIR (Fluid-Attenuated Inversion Recovery) sequence on the left and a coronal T2-weighted sequence on the right. Both images feature an arrow pointing to a hyperintense lesion located in the superior bank of the left calcarine cortex (primary visual cortex). The visual field defect (inferior scotoma) correlates neuroanatomically with this superior bank lesion due to the retinotopic organization of the occipital lobe, where the superior calcarine cortex represents the inferior visual field. This material is designed for teaching neuro-ophthalmology and the localization of lesions along the visual pathway.
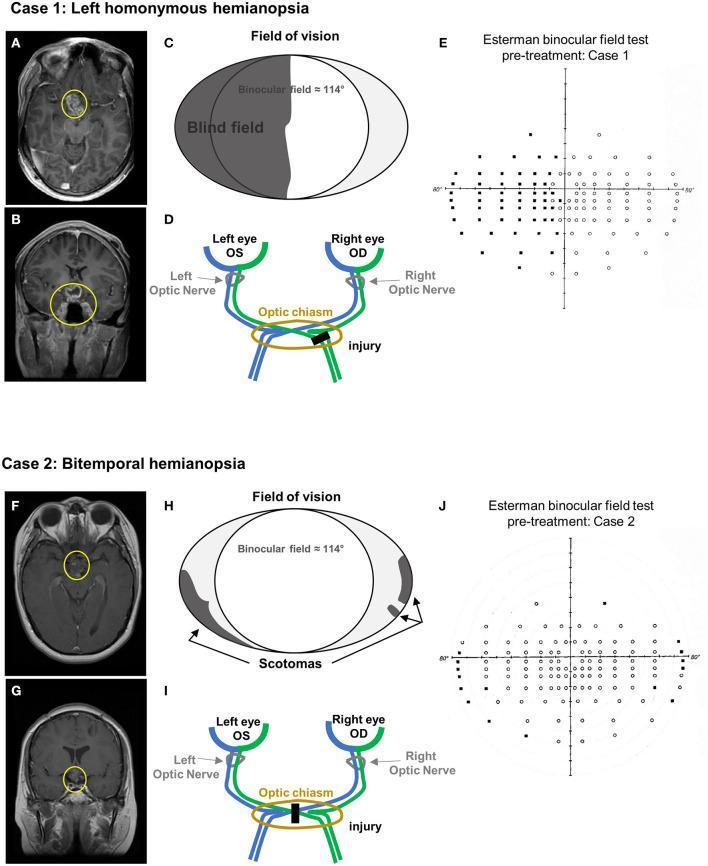
This composite educational image presents two clinical cases correlating neuroimaging findings with visual field defects. Case 1 (A-E) depicts left homonymous hemianopia. T1-weighted contrast-enhanced MRI in axial (A) and coronal (B) planes shows a heterogeneously enhancing mass in the suprasellar region (yellow circles), involving the optic chiasm and third ventricle floor. Schematic (C) and anatomical diagram (D) illustrate the corresponding lesion in the right optic tract and the resulting left hemifield blindness. The Esterman binocular field test (E) confirms significant unseen points (black dots) in the left visual field. Case 2 (F-J) depicts bitemporal hemianopia. MRI scans (F, G) reveal a residual suprasellar mass (yellow circles) inseparable from the hypothalamus and optic chiasm. The schematic (H) and optic pathway diagram (I) show a midline chiasmal injury, leading to peripheral scotomas. The Esterman test (J) demonstrates peripheral blind spots consistent with bitemporal vision loss. This comparison illustrates how specific anatomical injuries along the optic pathway correlate with distinct patterns of binocular visual impairment.
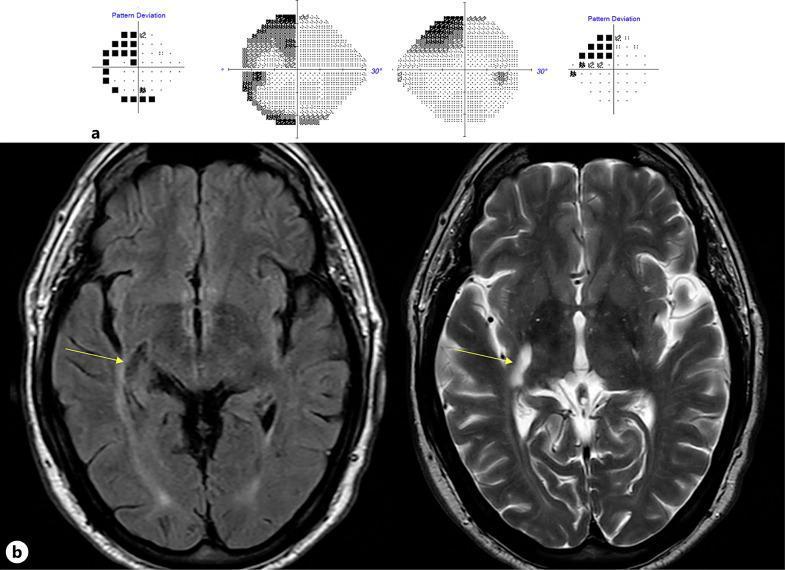
This composite educational image illustrates the correlation between diagnostic neuroimaging and visual field deficits. Panel (a) presents Humphrey 24-2 SITA-Fast perimetry results, displaying a clear left superior homonymous quadrantanopia (pie-in-the-sky defect) affecting the left upper quadrants of both eyes. Panel (b) features axial MRI brain scans in FLAIR (left) and T2-weighted (right) sequences. The MRI identifies an oblong, 2.0 × 0.5 cm cystic lesion posterior to the right basal ganglia, indicated by yellow arrows. The lesion is follows CSF signal intensity (hypointense on FLAIR, hyperintense on T2) and exhibits a thin hyperintense rim on the FLAIR sequence. Anatomically, the lesion is situated above the temporal horn of the lateral ventricle near the lateral geniculate body and Meyer's loop of the optic radiations. These findings are characteristic of a giant Virchow-Robin space (dilated perivascular space) causing mechanical disruption of the visual pathway. This material is essential for understanding neuro-ophthalmology, radiological anatomy of the optic radiations, and the clinical presentation of intracranial cystic lesions.
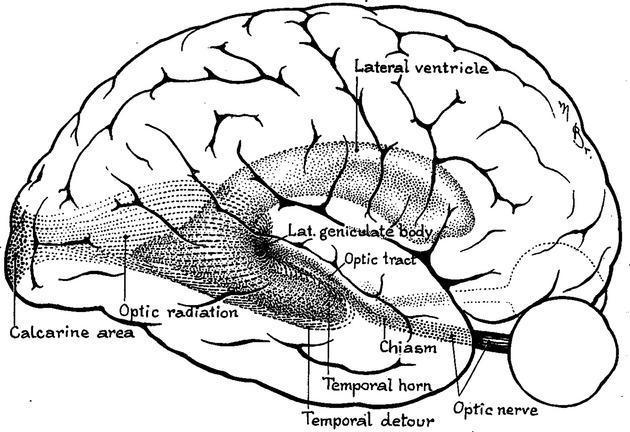
This anatomical diagram provides a lateral view of the human brain, specifically illustrating the visual pathway and the spatial distribution of the optic radiation. Based on Harvey Cushing's 1921 drawing, the illustration highlights the geniculocalcarine tract from its origin at the lateral geniculate body (LGB) to its termination in the primary visual cortex (calcarine area). A key educational focus is the 'temporal detour' or Meyer’s loop, where the ventral fibers of the optic radiation arc anteriorly around the temporal horn of the lateral ventricle before heading posteriorly toward the occipital lobe. Other labeled anatomical landmarks include the optic nerve, optic chiasm, optic tract, and the main body of the lateral ventricle. This diagram is significant for understanding neuroanatomy related to visual field deficits (e.g., quadrantanopia) that may arise from lesions or neurosurgical procedures in the temporal lobe, such as epilepsy surgery or tumor resection.
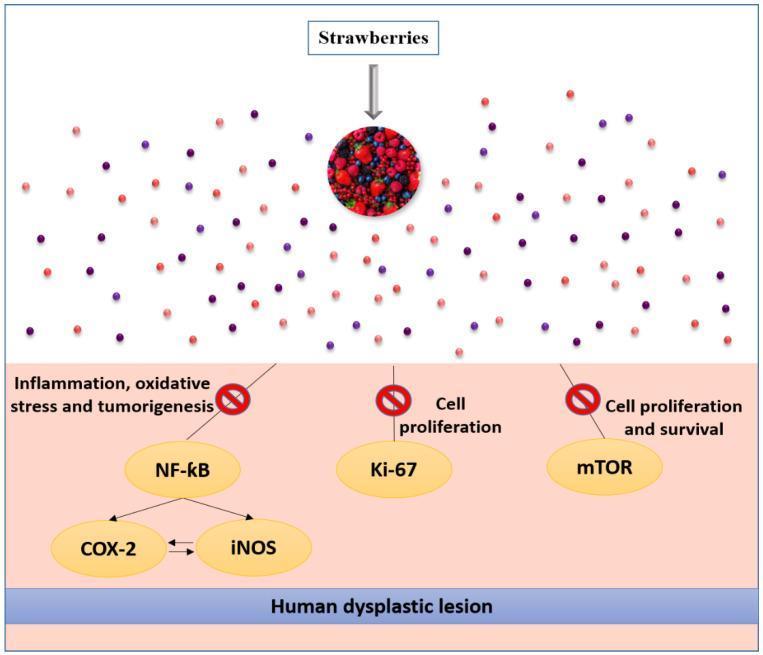
This pathophysiology diagram illustrates the chemopreventive mechanisms of strawberries in inhibiting the progression of human esophageal dysplastic lesions. The visual flow begins at the top with 'Strawberries' and a circular collage of berries, which release small red and purple spheres representing bioactive compounds like anthocyanins and phenolic acids. These components act on a biological field representing esophageal tissue. The diagram highlights three specific pathways inhibited by these compounds, each marked with a red 'prohibited' (null) sign to signify downregulation or suppression: 1) Inflammation, oxidative stress, and tumorigenesis, which involves the NF-kB signaling pathway and its downstream mediators COX-2 and iNOS; 2) Cell proliferation, specifically targeting the marker Ki-67; and 3) Cell proliferation and survival, mediated through the mTOR pathway. These pathways are depicted as yellow ovals connected by arrows to show hierarchy and interaction. The bottom of the image features a blue horizontal bar labeled 'Human dysplastic lesion,' indicating the clinical target of these strawberry-derived inhibitory effects in preventing esophageal squamous cell carcinoma.
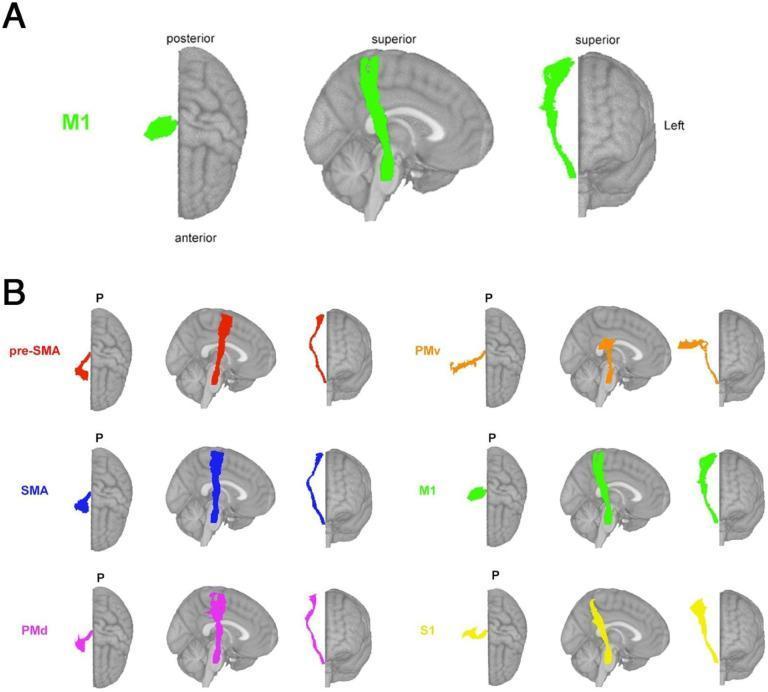
This diagnostic diagram presents theory-based biomarkers for neuroimaging research, specifically illustrating white matter fiber tracts associated with sensorimotor functions. The visual is divided into two main panels using MNI (Montreal Neurological Institute) brain templates. Panel A highlights the M1-corticospinal tract (M1-CST) in bright green across axial, sagittal, and coronal projections, showing its pathway from the primary motor cortex through the internal capsule. Panel B displays six distinct sensorimotor tract segmentations from the Sensorimotor Area Tract Template (SMATT), each color-coded for differentiation: pre-supplementary motor area (pre-SMA, red), supplementary motor area (SMA, blue), dorsal premotor cortex (PMd, magenta), ventral premotor cortex (PMv, orange), primary motor cortex (M1, green), and primary sensory cortex (S1, yellow). The sagittal views in Panel B demonstrate the anterior-to-posterior spatial arrangement, where pre-SMA is the most anterior and S1 is the most posterior. This illustration is used in clinical research to calculate lesion load on specific functional tracts, aiding in the prediction of motor recovery and chronic deficits following brain injury or stroke.
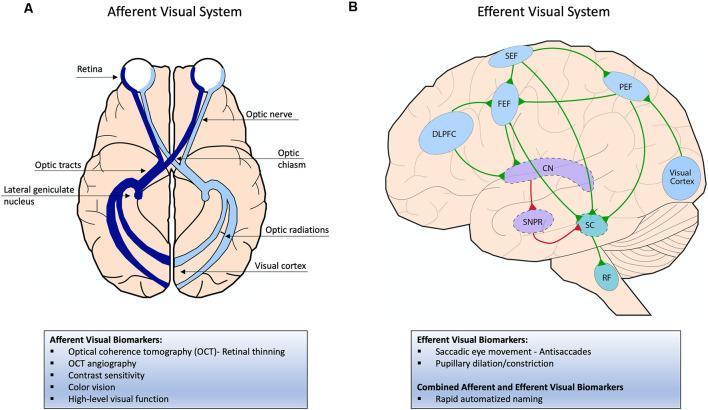
Educational diagram illustrating the neuroanatomy and functional pathways of the human visual system. Panel A depicts the Afferent Visual System in an axial brain view, showing the sensory pathway from the retina through the optic nerve, decussation at the optic chiasm, optic tracts, synapsing in the lateral geniculate nucleus (LGN) of the thalamus, and terminating in the primary visual cortex via optic radiations. Panel B illustrates the Efferent Visual System (oculomotor control) in a sagittal brain view, highlighting saccade generation. It shows excitatory connections (green) from the Frontal Eye Field (FEF), Parietal Eye Field (PEF), and Supplementary Eye Field (SEF) to the Superior Colliculus (SC) and Reticular Formation (RF). It also depicts the inhibitory indirect pathway (red) involving the Caudate Nucleus (CN) and Substantia Nigra Pars Reticulata (SNPR). Associated clinical biomarkers listed include optical coherence tomography (OCT) for the afferent system and antisaccades for the efferent system, relevant for neurodegenerative disease assessment.
How to Read This Diagram (Exam Summary)
Left panel - Unilateral/Pre-chiasmal lesions
| Lesion Site | Field Defect |
|---|---|
| Optic nerve (unilateral) | Central scotoma - central blind spot in one eye |
| Optic nerve (juxtapapillary) | Centrocaecal scotoma - defect connecting fixation to blind spot |
| Optic nerve (arcuate fibers) | Arcuate (nerve fiber bundle) scotoma |
| Optic nerve (peripheral) | Temporal wedge scotoma |
Right panel - Chiasmal and Post-chiasmal lesions
| Lesion Site | Field Defect |
|---|---|
| Optic chiasm (crossing nasal fibers) | Bitemporal hemianopia - both temporal fields lost |
| Optic tract | Incongruous homonymous hemianopia - same-side field loss, asymmetric between the two eyes |
| Lateral geniculate body / Optic radiations / Visual cortex | Congruous homonymous hemianopia - same-side field loss, symmetric/identical in both eyes |
Key exam rules to remember
- Pre-chiasmal lesions = monocular defects (one eye only)
- Chiasmal lesions = bitemporal hemianopia (classic pituitary adenoma)
- Post-chiasmal lesions = contralateral homonymous defects
- Optic tract = incongruous (asymmetric) due to incomplete mixing of fibers
- Optic radiations / cortex = congruous (symmetric) because fibers are now fully sorted
- Meyer's loop (anterior temporal loop) damage = "pie-in-the-sky" - superior quadrantanopia
- Dorsal radiation (parietal) damage = "pie-on-the-floor" - inferior quadrantanopia
- Occipital cortex lesion = most congruous of all; may spare macular vision (macular sparing) due to dual blood supply
At, central, proximal and distal to opic nerve, central chiasmal, optic tract geniculate body optic radialtion in temporal and parital lobe visual cortex sparing macular and visual cortex only macular
visual pathway lesion optic nerve chiasm tract radiation field defect complete diagram all sites
Anatomical diagram and educational infographic detailing the human visual pathway and associated visual field defects. The central illustration shows a superior (dorsal) view of the brain, highlighting the optic nerve, optic chiasm (decussation point), optic tract, lateral geniculate body, optic radiations, and the primary visual cortex in the occipital lobes. Pathways are color-coded (red and blue) to demonstrate the transition from nasal and temporal retinal fibers to the contralateral and ipsilateral hemispheres. Black lesion bars indicate specific sites of damage along this pathway. Flanking the central diagram are clinical representations of visual field loss patterns. The 'Right' panel displays bilateral defects including bitemporal hemianopia, incongruous homonymous hemianopia, and congruous homonymous hemianopia. The 'Left' panel displays unilateral or localized defects including central scotoma, centrocaecal scotoma, arcuate scotoma, and temporal wedge. This diagram serves as a neuro-ophthalmological guide for localizing lesions within the central nervous system based on perimetry findings.
This anatomical diagram provides a lateral view of the human brain, specifically illustrating the visual pathway and the spatial distribution of the optic radiation. Based on Harvey Cushing's 1921 drawing, the illustration highlights the geniculocalcarine tract from its origin at the lateral geniculate body (LGB) to its termination in the primary visual cortex (calcarine area). A key educational focus is the 'temporal detour' or Meyer’s loop, where the ventral fibers of the optic radiation arc anteriorly around the temporal horn of the lateral ventricle before heading posteriorly toward the occipital lobe. Other labeled anatomical landmarks include the optic nerve, optic chiasm, optic tract, and the main body of the lateral ventricle. This diagram is significant for understanding neuroanatomy related to visual field deficits (e.g., quadrantanopia) that may arise from lesions or neurosurgical procedures in the temporal lobe, such as epilepsy surgery or tumor resection.
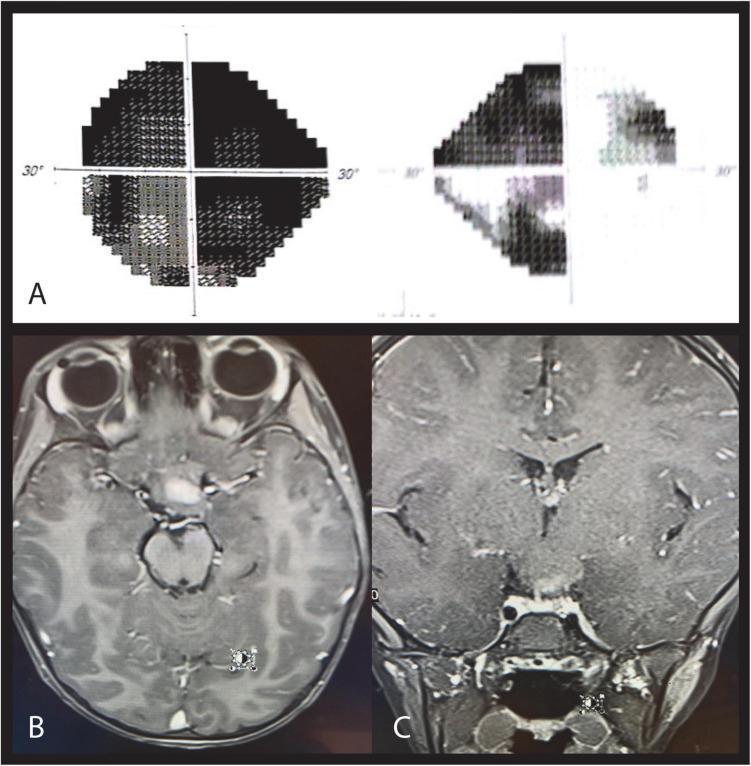
A multi-panel medical image illustrating neuro-ophthalmic pathology. Panel A displays Humphrey automated perimetry (visual field) results. The right eye (OD) shows a nasal hemianopia respecting the vertical meridian, while the left eye (OS) demonstrates near-complete field loss, indicating severe optic neuropathy. Panels B and C are T1-weighted post-contrast MRI scans in axial (B) and coronal (C) planes. They reveal a large, heterogeneously enhancing mass in the suprasellar, chiasmatic-hypothalamic region. The lesion is shown to involve the optic chiasm and extends posteriorly toward the left optic tract and anteriorly toward the left pre-chiasmatic optic nerve. The imaging and perimetry combination illustrates a left chiasmal syndrome, typically associated with optic pathway gliomas (common in patients with Neurofibromatosis type 1). This educational content demonstrates the correlation between structural brain lesions involving the visual pathway and their corresponding functional visual field defects.
This composite educational image presents two clinical cases correlating neuroimaging findings with visual field defects. Case 1 (A-E) depicts left homonymous hemianopia. T1-weighted contrast-enhanced MRI in axial (A) and coronal (B) planes shows a heterogeneously enhancing mass in the suprasellar region (yellow circles), involving the optic chiasm and third ventricle floor. Schematic (C) and anatomical diagram (D) illustrate the corresponding lesion in the right optic tract and the resulting left hemifield blindness. The Esterman binocular field test (E) confirms significant unseen points (black dots) in the left visual field. Case 2 (F-J) depicts bitemporal hemianopia. MRI scans (F, G) reveal a residual suprasellar mass (yellow circles) inseparable from the hypothalamus and optic chiasm. The schematic (H) and optic pathway diagram (I) show a midline chiasmal injury, leading to peripheral scotomas. The Esterman test (J) demonstrates peripheral blind spots consistent with bitemporal vision loss. This comparison illustrates how specific anatomical injuries along the optic pathway correlate with distinct patterns of binocular visual impairment.
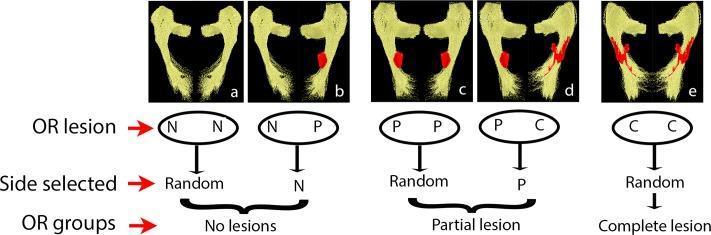
This figure is a diagnostic neuroimaging diagram illustrating the selection criteria for analyzing the optic radiation (OR) based on lesional involvement. The visual content consists of five axial diffusion tensor imaging (DTI) reconstructions of the optic radiations (labeled a-e) and a corresponding decision flowchart. In the DTI frames, the OR is rendered in yellow, while focal lesions are highlighted in red. The flowchart categorizes cases into three study groups: 'No lesions', 'Partial lesion', and 'Complete lesion'. In the 'No lesions' group (a-b), the selection prioritizes non-lesional (N) sides. The 'Partial lesion' group (c-d) focuses on tracks with partial (P) involvement over complete (C) lesions. The 'Complete lesion' group (e) demonstrates bilateral, full cross-sectional involvement. This material is designed for advanced medical education in neurology and neuroradiology, specifically demonstrating how to standardize fiber tract analysis in patients with multiple sclerosis or other white matter pathologies affecting the visual pathways between the lateral geniculate nucleus and the primary visual cortex.
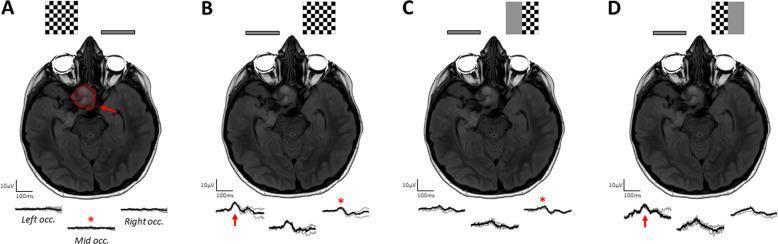
This composite educational graphic illustrates the neuro-ophthalmological findings of an optic pathway glioma in an 8-year-old patient. The image features four panels (A-D), each combining an axial brain MRI, stimulus diagrams, and Pattern Reversal Visual Evoked Potential (PR-VEP) waveforms. The MRI consistently shows a large infiltrative lesion (outlined in red in panel A) involving the left optic nerve, optic chiasm, and left optic tract. Panel A demonstrates total PR-VEP extinction during left eye stimulation, reflecting severe macular pathway dysfunction. Panels B, C, and D evaluate the right eye using full-field, right half-field, and left half-field checkerboard stimuli, respectively. The resulting transoccipital waveforms (recorded at left, middle, and right occipital locations) show asymmetric responses: panel B exhibits attenuated signals over the right occiput, and panel C shows reduced ipsilateral positivity. Panel D reveals preserved positivity, indicating that while crossing fibers are compromised, non-crossing fibers from the right eye remain functional. This case demonstrates the clinical utility of VEP distribution analysis in localizing chiasmal and retrochiasmal compressive lesions.
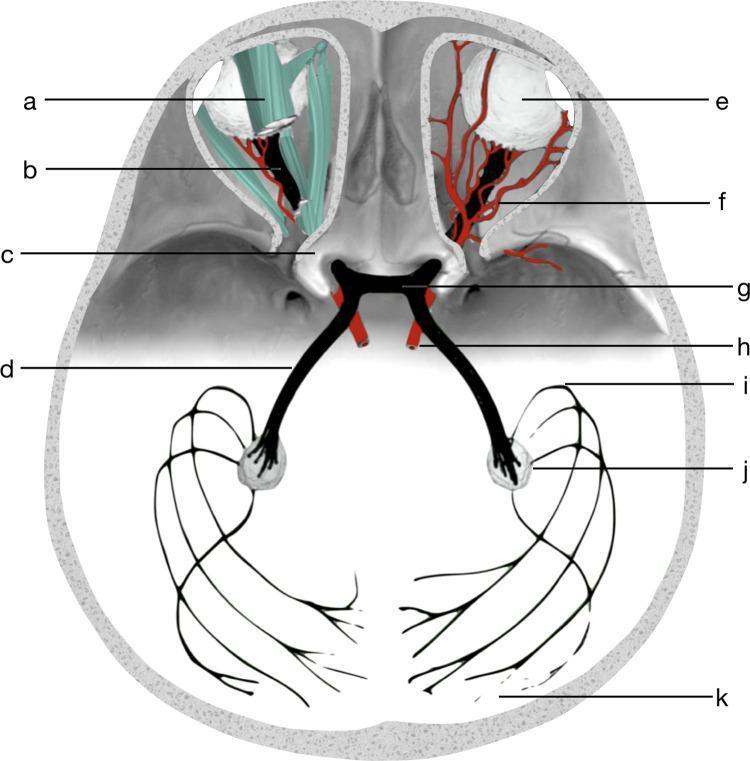
An anatomical diagram illustrating the human visual pathway and its surrounding cranial structures. The schematic highlights the progression from the anterior globes (eyeballs) to the posterior visual cortex. Key structures labeled include the optic nerves (b) extending from the eyeballs, passing through the bony optic canals (c) to converge at the central optic chiasm (g). The diagram demonstrates the decussation of fibers continuing as optic tracts (d) toward the lateral geniculate nuclei (j). The final segment depicts the optic radiation (k), including Meyer’s loop (i), projecting to the primary visual cortex. Surrounding clinical anatomy is integrated, showing the extraocular muscles and tendons (a), orbital blood vessels (f), and the ophthalmic artery (h) in close proximity to the neural structures. This visual summarizes the neuroanatomical relationships essential for understanding visual field defects and imaging diagnostics like CT and MRI tractography.
Educational diagram illustrating the neuroanatomy and functional pathways of the human visual system. Panel A depicts the Afferent Visual System in an axial brain view, showing the sensory pathway from the retina through the optic nerve, decussation at the optic chiasm, optic tracts, synapsing in the lateral geniculate nucleus (LGN) of the thalamus, and terminating in the primary visual cortex via optic radiations. Panel B illustrates the Efferent Visual System (oculomotor control) in a sagittal brain view, highlighting saccade generation. It shows excitatory connections (green) from the Frontal Eye Field (FEF), Parietal Eye Field (PEF), and Supplementary Eye Field (SEF) to the Superior Colliculus (SC) and Reticular Formation (RF). It also depicts the inhibitory indirect pathway (red) involving the Caudate Nucleus (CN) and Substantia Nigra Pars Reticulata (SNPR). Associated clinical biomarkers listed include optical coherence tomography (OCT) for the afferent system and antisaccades for the efferent system, relevant for neurodegenerative disease assessment.
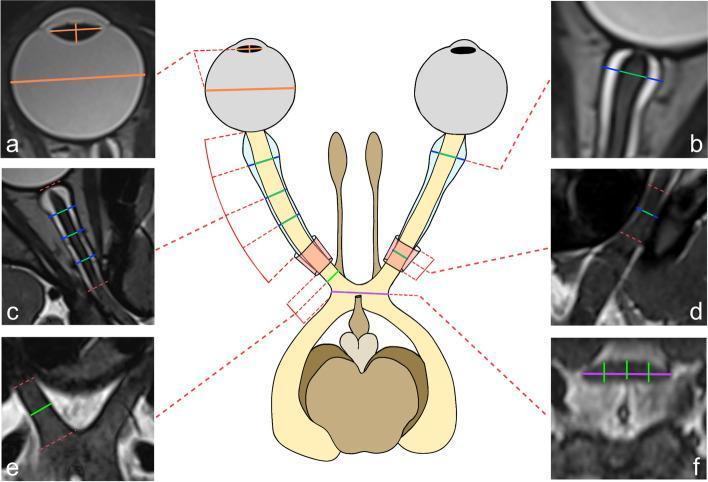
This composite educational resource consists of a central schematic diagram and six corresponding axis-corrected magnetic resonance (MR) images (labeled a-f) illustrating the anterior visual pathway anatomy and measurement protocols. The central diagram depicts the bilateral eyes, optic nerves, and optic chiasm, with dashed red lines indicating the planes of multiplanar reformation (MPR). The accompanying high-resolution T2-weighted FSE images demonstrate specific measurement sites: (a) axial plane of the globe showing the transverse diameter and lens dimensions; (b) the retrobulbar optic nerve and nerve sheath segment; (c) the intraorbital segment with triple-point diameter measurements; (d) the intracanalicular segment within the optic canal; (e) the intracranial optic nerve segment; and (f) a coronal reformation of the optic chiasm showing transverse and superoinferior diameter markings. Clinical relevance focuses on pediatric neuroimaging for establishing normative reference values for visual pathway structures, useful in monitoring intracranial pressure (via optic nerve sheath diameter) and assessing congenital or developmental optic pathway abnormalities.
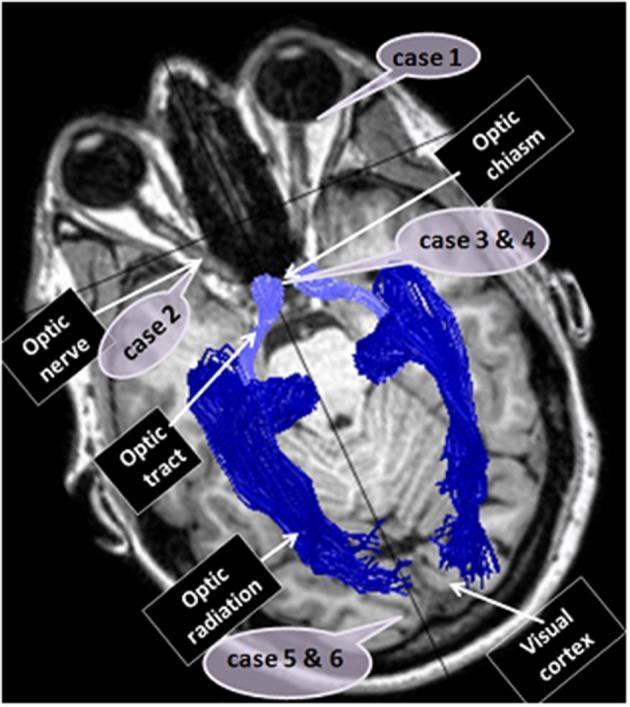
This diagnostic image features an axial T1-weighted Magnetic Resonance Imaging (MRI) scan of the human brain, integrated with blue Diffusion Tensor Imaging (DTI) fiber tractography to visualize the visual pathway. The illustration maps the neuroanatomical trajectory from the orbits to the occipital lobe. Key structures are labeled: the optic nerve (extending from the posterior eye), the optic chiasm (central decussation), the optic tract (posterior to the chiasm), and the optic radiation (projecting to the visual cortex). Additionally, the image serves as a clinical localization map for six case reports, identifying specific sites of dysfunction: Case 1 (eye), Case 2 (optic nerve), Cases 3 and 4 (optic chiasm), and Cases 5 and 6 (visual cortex). This combination of structural MRI and DTI tractography demonstrates the spatial relationship between clinical pathology and white matter pathways, supporting advanced neuro-ophthalmological education and radiological diagnosis.
macular sparing visual cortex occipital lobe lesion field defect
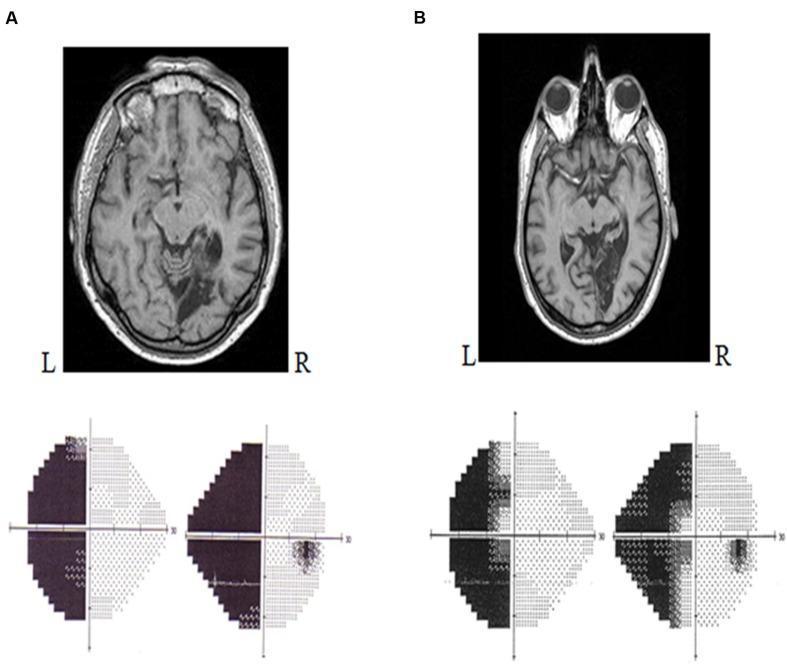
This composite educational graphic compares neuroimaging and corresponding visual field deficits in two clinical cases (A and B). The upper sections show axial T1-weighted MRI scans of the brain. In both cases, there is a large, hypointense (dark) lesion in the right posterior cerebrum, primarily involving the occipital lobe, consistent with a right-sided stroke or infarction in the territory of the posterior cerebral artery (PCA). The lower sections display Humphrey automated perimetry (SITA FAST 24-2) grayscale plots for both eyes. Case A illustrates a complete left homonymous hemianopia, characterized by dense, uniform darkening of the entire left visual field in both eyes, indicating total loss of peripheral and central vision on that side. Case B illustrates a left homonymous hemianopia with macular sparing. While the left hemi-field is largely darkened, there is a distinct preservation of visual sensitivity at the central fixation point (macula), a common clinical finding in PCA infarcts where the occipital pole receives collateral blood supply. This material is used to demonstrate the clinicopathological correlation between cerebral cortex lesions and specific patterns of visual field loss.
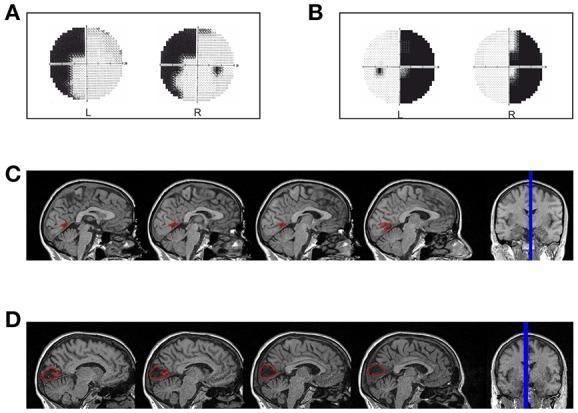
A multi-panel medical image illustrating the correlation between visual field defects and cortical lesions in two hemianopic patients. Panels A and B display Humphrey visual field perimetry results. Panel A shows a left superior quadrantanopia in patient LF, while Panel B shows a right homonymous hemianopia with foveal sparing in patient SL. Panels C and D provide diagnostic neuroimaging reconstructions via sagittal and coronal T1-weighted MRI slices. Panel C (Patient LF) highlights a focal red-labeled lesion in the anterior portion of the right calcarine fissure near the parieto-occipital fissure, consistent with the left-sided visual defect. Panel D (Patient SL) shows a larger red-labeled lesion in the left median para-sagittal occipital lobe involving the peri-calcarine cortex, corresponding to the right-sided hemianopia. The image serves as a clinical anatomical reference for mapping primary visual cortex (V1) damage to specific patterns of post-chiasmatic vision loss, such as quadrantanopia and hemianopia.
This composite educational image illustrates the correlation between clinical visual field testing and neuroimaging. Panel (a) displays a Standard Automated Perimetry (SAP) gray-scale plot showing a right inferior homonymous scotoma. The visual field defects are characterized by clusters of dark points primarily localized in the inferior-right quadrant of both eyes, signifying localized paracentral vision loss. Panel (b) contains two MRI brain scans: an axial FLAIR (Fluid-Attenuated Inversion Recovery) sequence on the left and a coronal T2-weighted sequence on the right. Both images feature an arrow pointing to a hyperintense lesion located in the superior bank of the left calcarine cortex (primary visual cortex). The visual field defect (inferior scotoma) correlates neuroanatomically with this superior bank lesion due to the retinotopic organization of the occipital lobe, where the superior calcarine cortex represents the inferior visual field. This material is designed for teaching neuro-ophthalmology and the localization of lesions along the visual pathway.
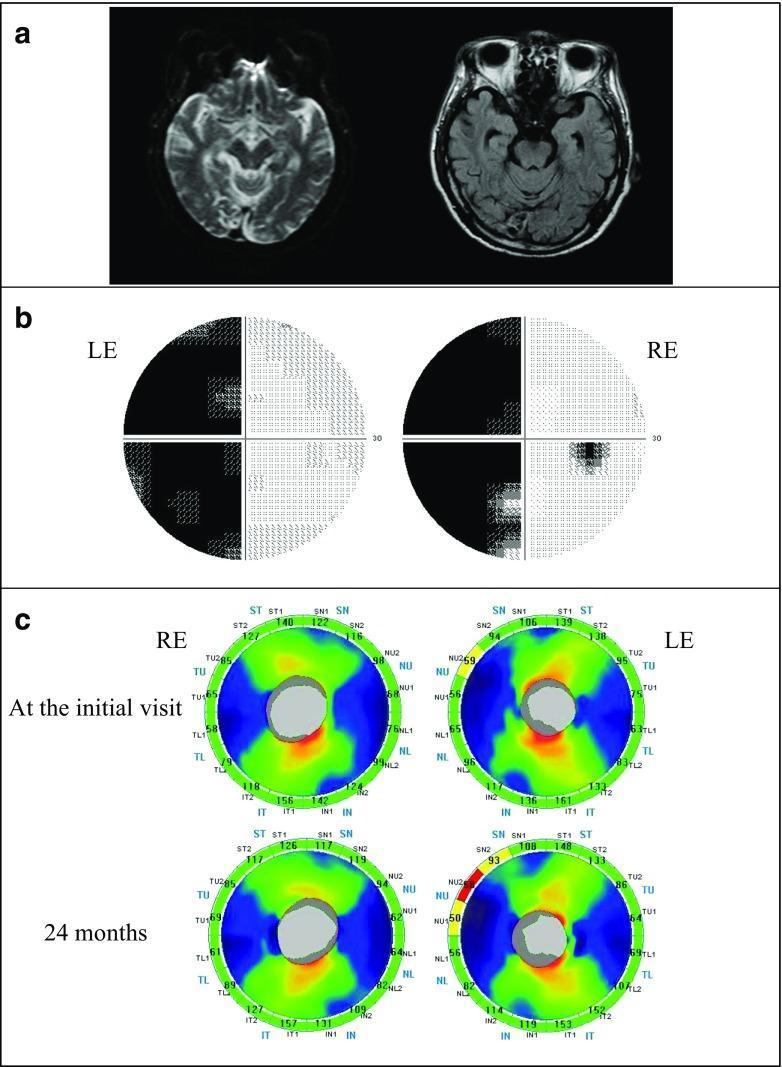
This composite educational graphic illustrates the neuro-ophthalmological findings of trans-synaptic retrograde degeneration following an occipital lobe stroke. Panel (a) displays axial MRI sequences (DWI and FLAIR) showing a hyperintense ischemic lesion in the right posterior cerebral artery territory. Panel (b) presents Humphrey visual field (HVF) plots demonstrating a dense left homonymous hemianopia with macular splitting. Panel (c) features Spectral-Domain Optical Coherence Tomography (SD-OCT) significance maps for the circumpapillary retinal nerve fiber layer (cpRNFL) thickness at the initial visit (top) and at 24-month follow-up (bottom). The OCT maps show the evolution of sectoral thinning, specifically in the nasal sectors of the left eye (contralateral to the lesion) and temporal sectors of the right eye (ipsilateral to the lesion), corresponding to the hemianopic defect. Comparison between the initial and 24-month maps highlights the longitudinal progression of thinning in the superior nasal (SN), inferior temporal (IT), and temporal upper/lower (TU/TL) sectors, a hallmark of retrograde axonal loss after primary cortical injury.
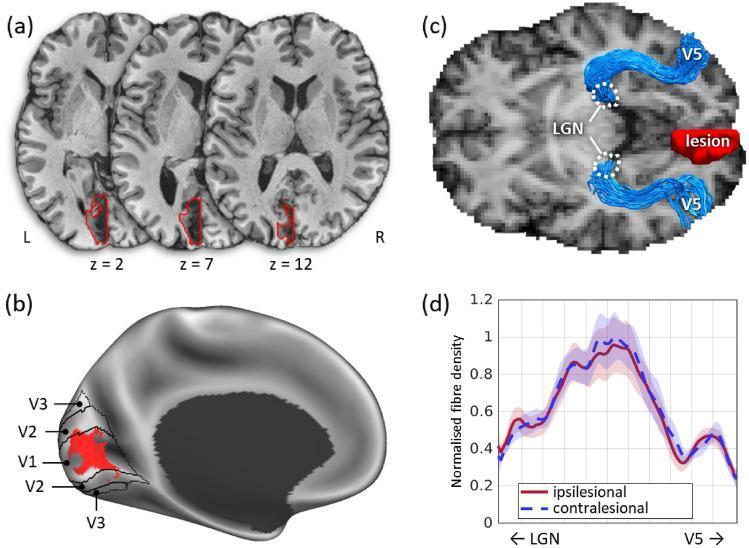
A multi-panel figure illustrating a circumscribed brain lesion and its impact on structural connectivity. (a) Sequential axial T1-weighted MRI slices (z = 2, 7, 12) show a lesion outlined in red, localized to the medial occipital lobe within the primary visual cortex (V1). (b) A 3D surface reconstruction of the medial cortex displays the lesion's extent relative to functional boundaries V1, V2, and V3, highlighting significant V1 involvement with partial sparing near the occipital pole. (c) Diffusion-based tractographic reconstruction visualizes the optic radiations (blue) connecting the lateral geniculate nucleus (LGN) to area V5 (hMT+). The red-contoured lesion is positioned medially, demonstrating that the lateral pathways to V5 remain structurally intact. (d) A line graph compares normalized fiber density along the LGN-V5 pathway between the ipsilesional (red) and contralesional (blue dashed) hemispheres. The overlapping profiles indicate no significant microstructural difference in fiber density between the damaged and healthy hemispheres, suggesting preserved subcortical-cortical connectivity for motion processing despite the V1 lesion.
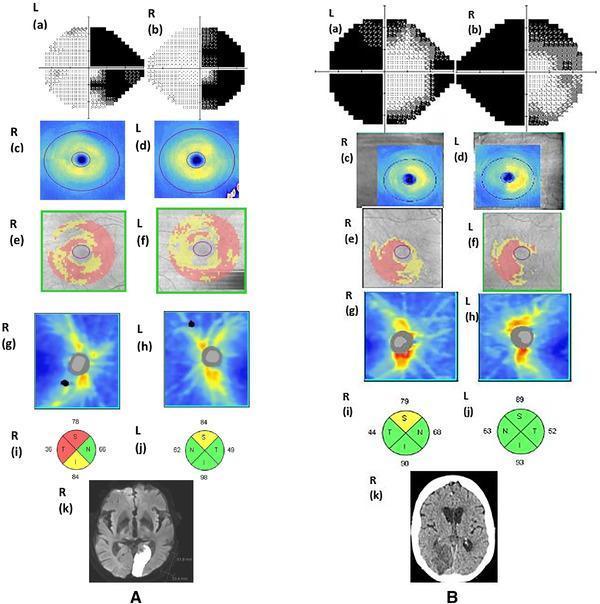
Educational comparison of neuro-ophthalmological findings in two patients (A and B) with occipital lobe infarctions and secondary retrograde trans-synaptic degeneration. Each case includes Humphrey visual field tests (a-b), Optical Coherence Tomography (OCT) ganglion cell-inner plexiform layer (GCIPL) thickness/deviation maps (c-f), Retinal Nerve Fiber Layer (RNFL) thickness/quadrant maps (g-j), and neuroimaging (k). Case A demonstrates a left occipital infarction on diffusion-weighted MRI resulting in right homonymous hemianopia with macular sparing and diffuse bilateral GCIPL thinning on OCT deviation maps. Case B shows a subacute right occipital infarction on CT associated with left homonymous hemianopia and corresponding right-sided homonymous hemi-GCIPL thinning. The RNFL quadrant analysis (i-j) utilizes standard color coding: green for within normal limits, yellow for borderline (p < 5%), and red for outside normal limits (p < 1%). This image illustrates the correlation between central nervous system lesions and retrograde retinal structural changes, highlighting the diagnostic utility of OCT in neuro-ophthalmological evaluation.
Complete Visual Pathway - Lesions & Field Defects
MASTER REFERENCE DIAGRAM
1. AT THE OPTIC NERVE (Monocular defects - one eye only)
| Sub-site | Lesion | Field Defect |
|---|---|---|
| A - At the disc (optic nerve head) | Papilledema, AION, papillitis | Central scotoma (monocular) |
| B - Central (intraorbital) | Optic neuritis, MS | Central scotoma - loss of central vision one eye |
| C - Proximal (intracanalicular/intracranial) | Meningioma, trauma | Junctional scotoma* or central scotoma |
| D - Distal (just before chiasm) | Optic nerve glioma, compression | Centrocaecal scotoma; severe = monocular blindness |
Junctional scotoma (proximal optic nerve/junction with chiasm): ipsilateral central scotoma + contralateral superior temporal defect - Wilbrand's knee is affected (fibers from opposite eye loop briefly into ipsilateral nerve)
2. OPTIC CHIASM LESIONS
| Type | Lesion | Field Defect |
|---|---|---|
| Central chiasm | Pituitary adenoma (compresses crossing nasal fibers from below) | Bitemporal hemianopia - both temporal fields lost |
| Lateral chiasm | Aneurysm of ICA/cavernous sinus (compresses uncrossed temporal fibers) | Binasal hemianopia (rare) |
| Anterior chiasm | Superior compression (craniopharyngioma) | Bitemporal superior quadrantanopia first |
| Posterior chiasm | Compression from behind | Bitemporal inferior quadrantanopia first |
3. OPTIC TRACT
| Lesion | Field Defect |
|---|---|
| Right optic tract lesion | Left incongruous homonymous hemianopia |
- Incongruous = defects in the two eyes are different in size/shape (NOT mirror images)
- Because nasal and temporal fibers are not yet perfectly segregated in the tract
- Also: ipsilateral optic atrophy (bow-tie/band atrophy) in the eye opposite the lesion
- Causes: craniopharyngioma, MS, aneurysm
4. LATERAL GENICULATE BODY (LGB)
| Lesion | Field Defect |
|---|---|
| LGB lesion (thalamic) | Congruous homonymous hemianopia or sectoranopia (wedge-shaped) |
- More congruous than tract (fibers more sorted)
- Horizontal sectoranopia possible (dual blood supply - anterior choroidal + lateral choroidal arteries)
- Causes: anterior choroidal artery infarct, thalamic tumors
5. OPTIC RADIATION
Classic diagram of Meyer's loop:

| Sub-site | Lesion | Field Defect |
|---|---|---|
| Temporal lobe (Meyer's loop - inferior fibers, carry superior visual field) | Temporal lobectomy, temporal lobe tumor, herpes encephalitis | "Pie in the sky" = Contralateral superior homonymous quadrantanopia |
| Parietal lobe (superior fibers, carry inferior visual field) | MCA infarct, parietal tumors | "Pie on the floor" = Contralateral inferior homonymous quadrantanopia |
| Complete optic radiation | Extensive MCA territory infarct | Congruous complete contralateral homonymous hemianopia |
Memory trick: Temporal lobe = inferior fibers loop = Temporal = Top field lost ("pie in the sky")
6. VISUAL CORTEX (Occipital Lobe)
A. Complete PCA infarct - Hemianopia WITH macular splitting vs. macular sparing:
| Type | Lesion | Field Defect |
|---|---|---|
| Complete PCA territory | Large occipital infarct | Contralateral homonymous hemianopia with macular splitting (no fixation spared) |
| Cortex sparing macula (occipital pole intact) | PCA infarct sparing occipital pole (gets MCA collateral supply) | Contralateral homonymous hemianopia with macular sparing - central 5-10° preserved |
| Visual cortex ONLY macula (only occipital pole) | Occipital pole lesion only | Central homonymous scotoma only (paracentral) - peripheral field intact |
| Superior calcarine cortex | Infarct of upper bank (lingual gyrus) | Contralateral inferior homonymous quadrantanopia |
| Inferior calcarine cortex | Infarct of lower bank (cuneus) | Contralateral superior homonymous quadrantanopia |
SUMMARY TABLE - Full Pathway at a Glance
| Site | Lesion | Defect | Congruity |
|---|---|---|---|
| Optic nerve (at disc) | AION, papillitis | Monocular central scotoma | N/A - one eye |
| Optic nerve (central) | Optic neuritis | Monocular central scotoma | N/A |
| Optic nerve (proximal) | Meningioma | Junctional scotoma | N/A |
| Optic nerve (distal) | Glioma | Centrocaecal/monocular blindness | N/A |
| Chiasm (central) | Pituitary adenoma | Bitemporal hemianopia | Heteronymous |
| Optic tract | Craniopharyngioma | Contralateral incongruous homonymous hemianopia | Incongruous |
| LGB | Thalamic infarct | Contralateral congruous hemianopia/sectoranopia | Congruous |
| Optic radiation - temporal | Temporal lobe Ca/infarct | Contralateral superior quadrantanopia ("pie in sky") | Congruous |
| Optic radiation - parietal | Parietal lobe lesion | Contralateral inferior quadrantanopia ("pie on floor") | Congruous |
| Occipital cortex (full) | PCA infarct | Homonymous hemianopia + macular splitting | Most congruous |
| Occipital cortex (pole spared) | PCA sparing pole | Homonymous hemianopia + macular SPARING | Most congruous |
| Occipital pole ONLY | Small polar lesion | Central homonymous scotoma only | Congruous |
KEY EXAM RULES
- Pre-chiasmal = monocular (one eye); Post-chiasmal = binocular (both eyes, same side)
- The more posterior the lesion, the more congruous the defect
- Macular sparing = cortical (PCA infarct); Macular splitting = radiation or complete cortical
- Only the visual cortex can give macular sparing (dual blood supply: PCA + MCA)
- Bitemporal = always think chiasm; Binasal = always think raised ICP or lateral chiasm compression