
Anatomy of heart and physiology
heart anatomy chambers valves diagram
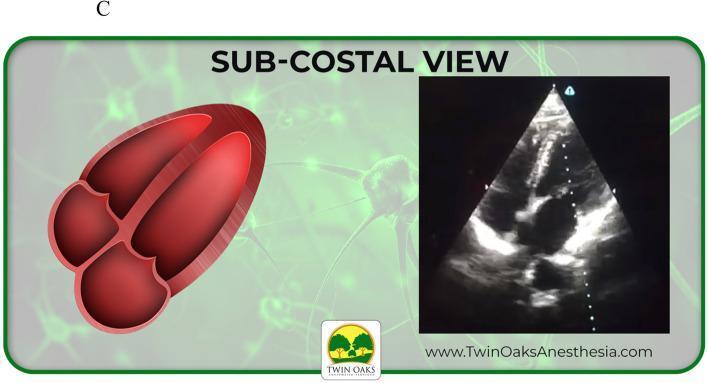
This educational graphic provides a side-by-side comparison of cardiac anatomy and sonographic representation in a subcostal transthoracic echocardiogram (TTE) view. On the left, an anatomical diagram illustrates a four-chamber view of the heart in cross-section, showing the left and right ventricles separated by the interventricular septum, along with the corresponding atria and atrioventricular valves. On the right, a corresponding grayscale echocardiogram (sonogram) in a sector scan format displays the heart from the subcostal acoustic window. The image highlights clinical landmarks including the hyperechoic (bright) ventricular walls and valves against the anechoic (dark) blood-filled chambers. This comparison is intended for medical trainees to correlate simplified anatomical models with real-time diagnostic imaging, specifically focusing on identifying cardiac chambers and orientation in the subcostal four-chamber view often used in emergency or critical care ultrasonography.
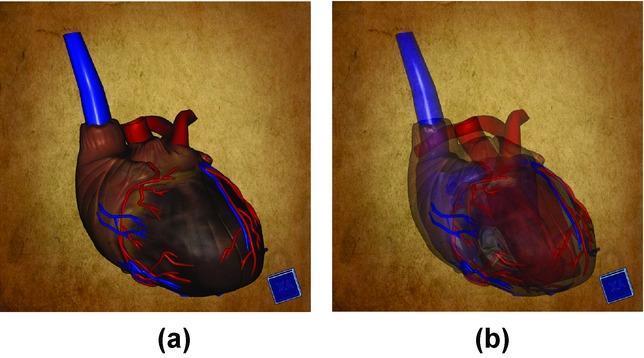
Anatomical Diagram: This image displays a side-by-side comparison of a 3D digital model of a human heart, emphasizing cardiovascular anatomy and medical visualization techniques. Figure (a) illustrates the external morphology of the heart with high opacity. It shows the muscular surface in a dark reddish-brown hue, featuring visible coronary arteries in red and cardiac veins in blue. A prominent blue cylindrical structure representing the superior vena cava or ascending aorta is visible at the base. Figure (b) demonstrates the same model with reduced opacity (semi-transparency), a technique used in diagnostic imaging and education to reveal internal cardiac structures. This view highlights the spatial relationships between internal chambers (atria and ventricles), heart valves, and the intra-cardiac pathways of major vessels. The comparison serves as an educational tool for medical students to understand the transition from external cardiac topography to internal anatomy using advanced volumetric rendering software.
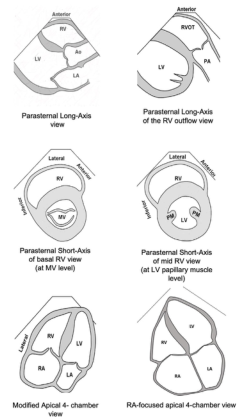
Summary : This figure presents six schematic diagrams of standard echocardiographic views used to visualize the heart chambers and valves, specifically focusing on the right ventricle (RV) and its relationship to other cardiac structures. illustration: # Views Presented : • Parasternal Long-Axis view: Shows RV, Ao (aorta), and LA (left atrium) in a longitudinal section. • Parasternal Long-Axis of the RV outflow view: Displays RVOT (right ventricular outflow tract), PA (pulmonary artery), and LV (left ventricle). • Parasternal Short-Axis of basal RV view (at MV level): Cross-sectional view at the mitral valve (MV) level, showing RV and MV. • Parasternal Short-Axis of mid RV view (at LV papillary muscle level): Cross-sectional view at the level of the LV papillary muscles, showing RV, LV, and papillary muscles (PM). • Modified Apical 4-chamber view: Displays RA (right atrium), RV, LA, and LV in a four-chamber perspective. • RA-focused apical 4-chamber view: Focuses on RA, RV, LA, and LV, emphasizing the right atrium. # Labels & Orientation : • Each diagram is labeled with anatomical structures (RV, LV, LA, RA, Ao, PA, MV, PM). • Orientation markers such as "Anterior," "Lateral," and "Septal" are provided for spatial reference. # Design Encodings : • Simple black-and-white line drawings. • Chamber walls and valves are outlined; no colour or shading. • Each view is titled below the corresponding diagram. # Analysis : • The figure systematically compares different echocardiographic views, highlighting how the right ventricle and associated structures appear in each orientation. • The progression from long-axis to short-axis and apical views demonstrates the versatility of echocardiography in assessing cardiac anatomy and function. • The inclusion of both standard and modified views allows for comprehensive visualization of the right heart.
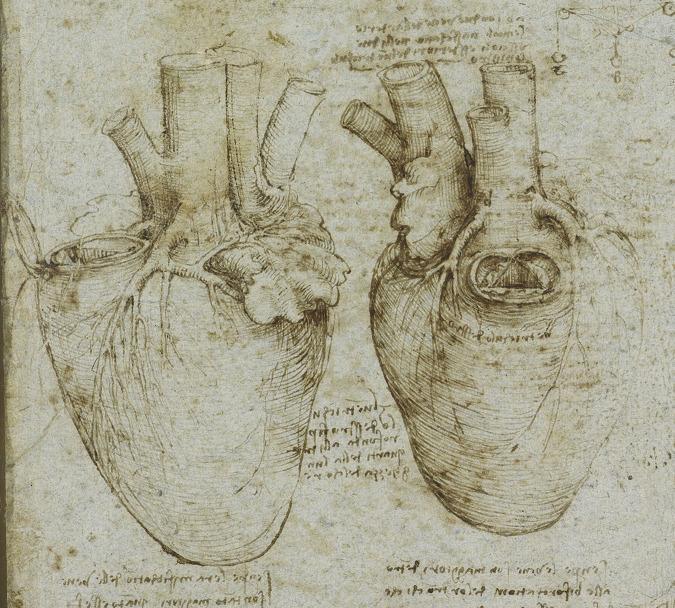
This historical anatomical diagram consists of two detailed sepia-toned ink sketches of the human heart, attributed to Leonardo da Vinci. The illustration serves as a foundational study in cardiac anatomy and pathophysiology. The heart on the left depicts the external morphology, including the ventricular surface and the branching of the coronary arteries. The heart on the right features a windowed dissection revealing an internal view of a cardiac chamber and valve-like structures. Both sketches prominently display the great vessels—specifically the ascending aorta and pulmonary trunk—arising from the superior aspect of the heart. The artist uses masterfully executed hatching and cross-hatching to represent the three-dimensional volume and muscular texture of the myocardium. The drawings are accompanied by mirror-written annotations in Italian, reflecting early scientific inquiry into cardiovascular function and the first accurate representations of cardiac valves and vessels in medical history. This visual is highly relevant for the history of medicine and understanding the evolution of anatomical illustration.
cardiac conduction system action potential
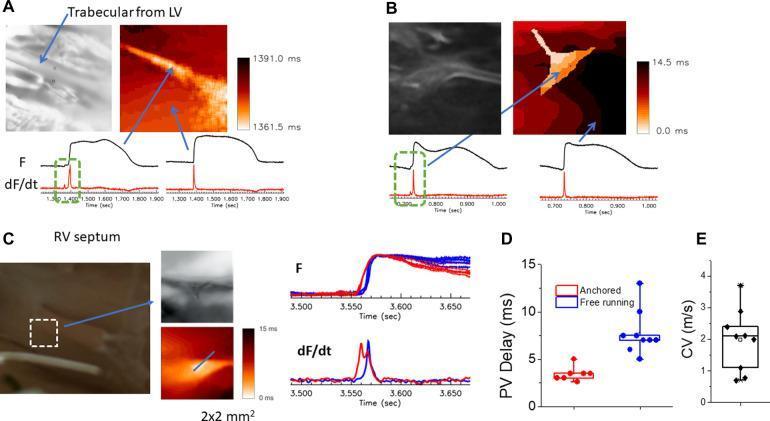
Educational panel illustrating cardiac electrophysiology and optical mapping of the Purkinje-ventricular junction (PVJ) in rabbit heart models. The figure is divided into five sections (A-E). Panels A, B, and C present side-by-side anatomical grayscale/brightfield images, color-coded activation maps, and corresponding action potential traces (F) with their first derivatives (dF/dt). These panels demonstrate conduction in the trabecular muscle of the left ventricle (A), free-running Purkinje fibers (B), and the right ventricular (RV) septum involving papillary muscle (C). A key educational feature is the visualization of 'step-delays' in the dF/dt traces—highlighted by green dotted boxes—showing dual upstrokes that represent the temporal separation between Purkinje fiber activation and ventricular muscle activation. Panel D provides a comparative dot plot of Purkinje-ventricular (PV) delay in milliseconds, distinguishing between 'anchored' (shorter delay) and 'free-running' (longer delay) fibers. Panel E is a box-and-whisker plot displaying the conduction velocity (CV) along Purkinje fibers, measured in meters per second (m/s). This resource illustrates how the specialized conduction system coordinates rapid, sequential electrical activation within the ventricular myocardium.
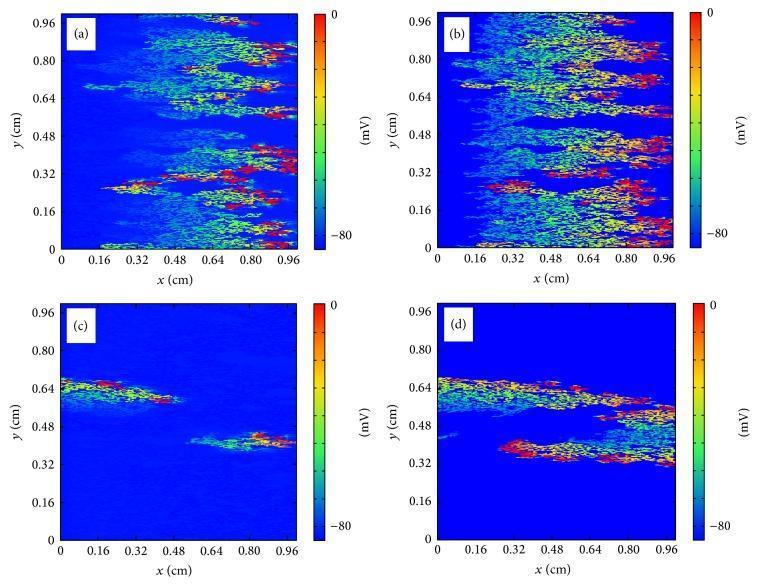
This figure presents four heat maps depicting simulated cardiac action potential wave propagation and reentry in a 1.0 cm x 1.0 cm tissue area, comparing microscopic ((a) and (c)) and discrete ((b) and (d)) models. The color scale indicates membrane potential in millivolts (mV), ranging from -80 mV (dark blue, resting state) to 0 mV (dark red, depolarization). Panels (a) and (b) show longitudinal propagation at t = 50 ms. Both models display an irregular wave front moving from left to right, characterized by high-voltage red and yellow leading edges and green/blue trailing regions, illustrating rapid conduction along myocardial fibers. Panels (c) and (d) capture the tissue at t = 160 ms, highlighting a reentry phenomenon. In the microscopic model (c), the reentrant wave appears fragmented and less extensive. In contrast, the discrete model (d) exhibits a more robust and continuous reentrant pathway, particularly visible in the central and upper-right quadrants. These simulations demonstrate how heterogeneous tissue structure and microfibrosis influence electrical dynamics, potentially leading to ectopic pacemakers and sustained arrhythmias like atrial fibrillation.
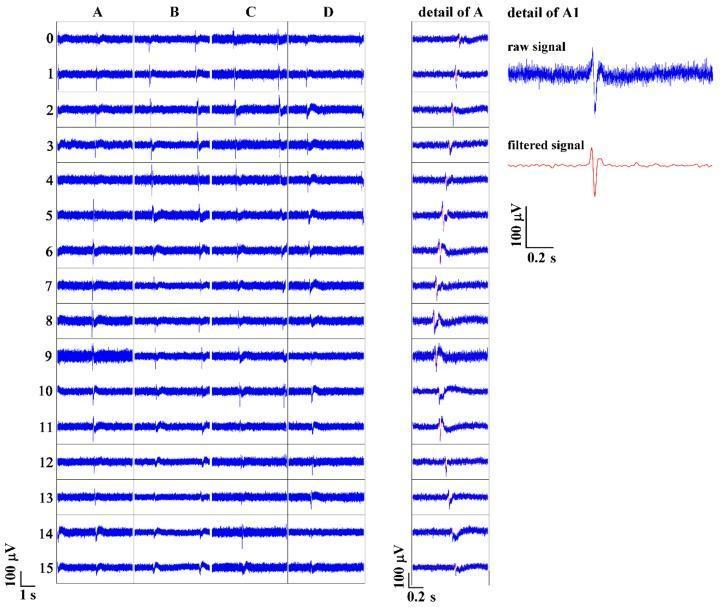
Electrophysiological data visualization showing action potential (AP) propagation in HL-1 cardiac muscle cells using a planar microelectrode array (pMEA). The image is divided into three panels. The left panel displays a grid of signal recordings across 16 rows (0-15) and four columns (A, B, C, D), illustrating the spatiotemporal distribution of APs over a 1-second interval. The center panel, 'detail of A', provides a high-resolution view of AP propagation within a single electrode column over a 0.2-second window, highlighting the sequential firing indicative of cellular conduction. The right panel compares the 'raw signal' and 'filtered signal' from a specific electrode (A1). The raw signal exhibits significant high-frequency background noise, while the filtered version (5–50 Hz bandpass) demonstrates a clarified, biphasic waveform with an improved signal-to-noise ratio. Scale bars indicate voltage in microvolts (100 µV) and time in seconds (1 s or 0.2 s). This figure demonstrates the capability of pMEAs to track rhythmic, propagating electrical activity in cultured cardiomyocytes.
cardiac cycle pressure volume loop systole diastole
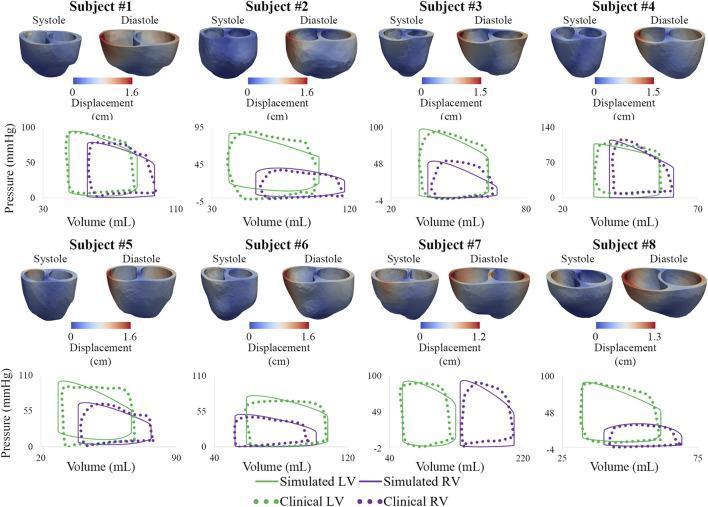
This medical graphic presents a multi-subject comparative study (8 subjects) of cardiovascular mechanics, combining biventricular displacement maps and pressure-volume (PV) loops. The top portion of each subject panel shows 3D color-coded ventricular models during end-systole and end-diastole. Displacement is mapped on a scale from 0 cm (blue) to approximately 1.2–1.6 cm (red), illustrating wall motion across the cardiac cycle. Below each set of models, PV loops represent ventricular hemodynamics. These loops compare left ventricle (LV, green) and right ventricle (RV, purple) data. Solid lines represent computational simulations, while dotted lines represent clinical measurements. The data demonstrates the relationship between pressure (mmHg) and volume (mL), facilitating an assessment of contractility, ejection fraction, and stroke work. The variety in loop morphology and displacement patterns across the subjects highlights patient-specific pathological states, likely in the context of Pulmonary Arterial Hypertension (PAH), where RV remodeling and displacement abnormalities are clinically significant.
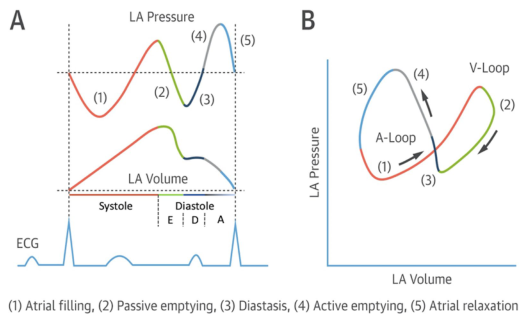
Summary : This figure illustrates the left atrial (LA) pressure-volume relationship during the cardiac cycle, showing both time-course traces and a pressure-volume loop, with key phases of atrial function annotated and correlated with the ECG. line plot and loop diagram: # Panel A: LA Pressure and Volume Traces • Top trace: LA Pressure (y-axis, arbitrary units) over time. • Middle trace: LA Volume (y-axis, arbitrary units) over time. • Bottom trace: ECG waveform for temporal reference. • X-axis: Cardiac cycle phases, with systole and diastole labeled; diastole further subdivided into E, D, and A phases. • Five phases are color-coded and numbered: – (1) Atrial filling (red) – (2) Passive emptying (green) – (3) Diastasis (black) – (4) Active emptying (blue) – (5) Atrial relaxation (gray) • Vertical dashed lines demarcate transitions between phases. # Panel B: LA Pressure-Volume Loop • X-axis: LA Volume (arbitrary units). • Y-axis: LA Pressure (arbitrary units). • The loop is traced in a counterclockwise direction, with arrows indicating the sequence. • The same five phases (1–5) are color-coded as in Panel A. • The loop is divided into two segments: A-Loop (phases 1, 3, 4, 5) and V-Loop (phase 2). # Design Encodings : • Distinct colors for each phase (red, green, black, blue, gray). • Arrows on the loop indicate the direction of the cardiac cycle. • ECG trace provides timing reference for the pressure and volume changes. # Analysis : • The LA pressure and volume traces show cyclical changes corresponding to atrial filling, emptying, and relaxation. • The pressure-volume loop visually summarizes the dynamic relationship between LA pressure and volume, with distinct segments for passive and active phases. • The figure highlights the temporal coordination between atrial events and the ECG, emphasizing the mechanical and electrical coupling in the cardiac cycle.
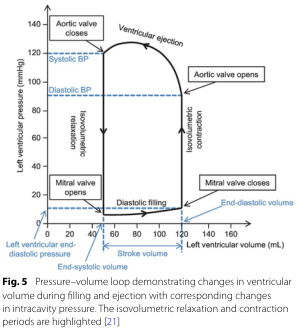
Summary : This figure shows a pressure–volume loop for the left ventricle, illustrating how ventricular volume and pressure change during the cardiac cycle, with key phases and valve events annotated. The isovolumetric relaxation and contraction periods are highlighted, and systolic/diastolic blood pressures are marked. pressure–volume loop diagram: # Title & Axes : • No explicit title on the figure, but the legend describes it as a "Pressure–volume loop demonstrating changes in ventricular volume during filling and ejection with corresponding changes in intracavity pressure." • X-axis: "Left ventricular volume (mL)" with tick marks at 0, 20, 40, 60, 80, 100, 120, 140, 160. • Y-axis: "Left ventricular pressure (mmHg)" with tick marks at 0, 20, 40, 60, 80, 100, 120, 140. • Additional axis labels: "Left ventricular end-diastolic pressure" (blue, left), "End-diastolic volume" (blue, bottom right), "Stroke volume" (black, bottom center). # Phases & Events : • Isovolumetric relaxation: vertical line at low volume, pressure drops, labeled. • Diastolic filling: horizontal line at low pressure, volume increases, labeled. • Isovolumetric contraction: vertical line at high volume, pressure rises, labeled. • Ventricular ejection: curved line, volume decreases as pressure peaks and falls, labeled. • Valve events: – Mitral valve opens (bottom left corner, low pressure/volume). – Mitral valve closes (bottom right corner, high volume/low pressure). – Aortic valve opens (top right corner, high volume/high pressure). – Aortic valve closes (top left corner, low volume/high pressure). # Blood Pressure Markers : • Systolic BP: horizontal dashed blue line at ~120 mmHg. • Diastolic BP: horizontal dashed blue line at ~80 mmHg. # Design Encodings : • Black solid lines for the loop. • Blue dashed lines for blood pressure markers. • Blue text for end-diastolic volume/pressure. • Labeled arrows for direction of phases and valve events. # Analysis : • The loop traces the cardiac cycle, starting at low pressure/volume (end-systolic), filling during diastole, rising sharply during isovolumetric contraction, ejecting blood during ventricular ejection, and dropping pressure during isovolumetric relaxation. • Systolic and diastolic blood pressures are marked, showing the pressure range during ejection. • The width of the loop (horizontal distance) represents stroke volume. • The figure clearly distinguishes the four main phases and the timing of valve openings/closings, providing a comprehensive view of ventricular mechanics during a heartbeat.
Anatomy and Physiology of the Heart
1. Overview
2. Gross Anatomy
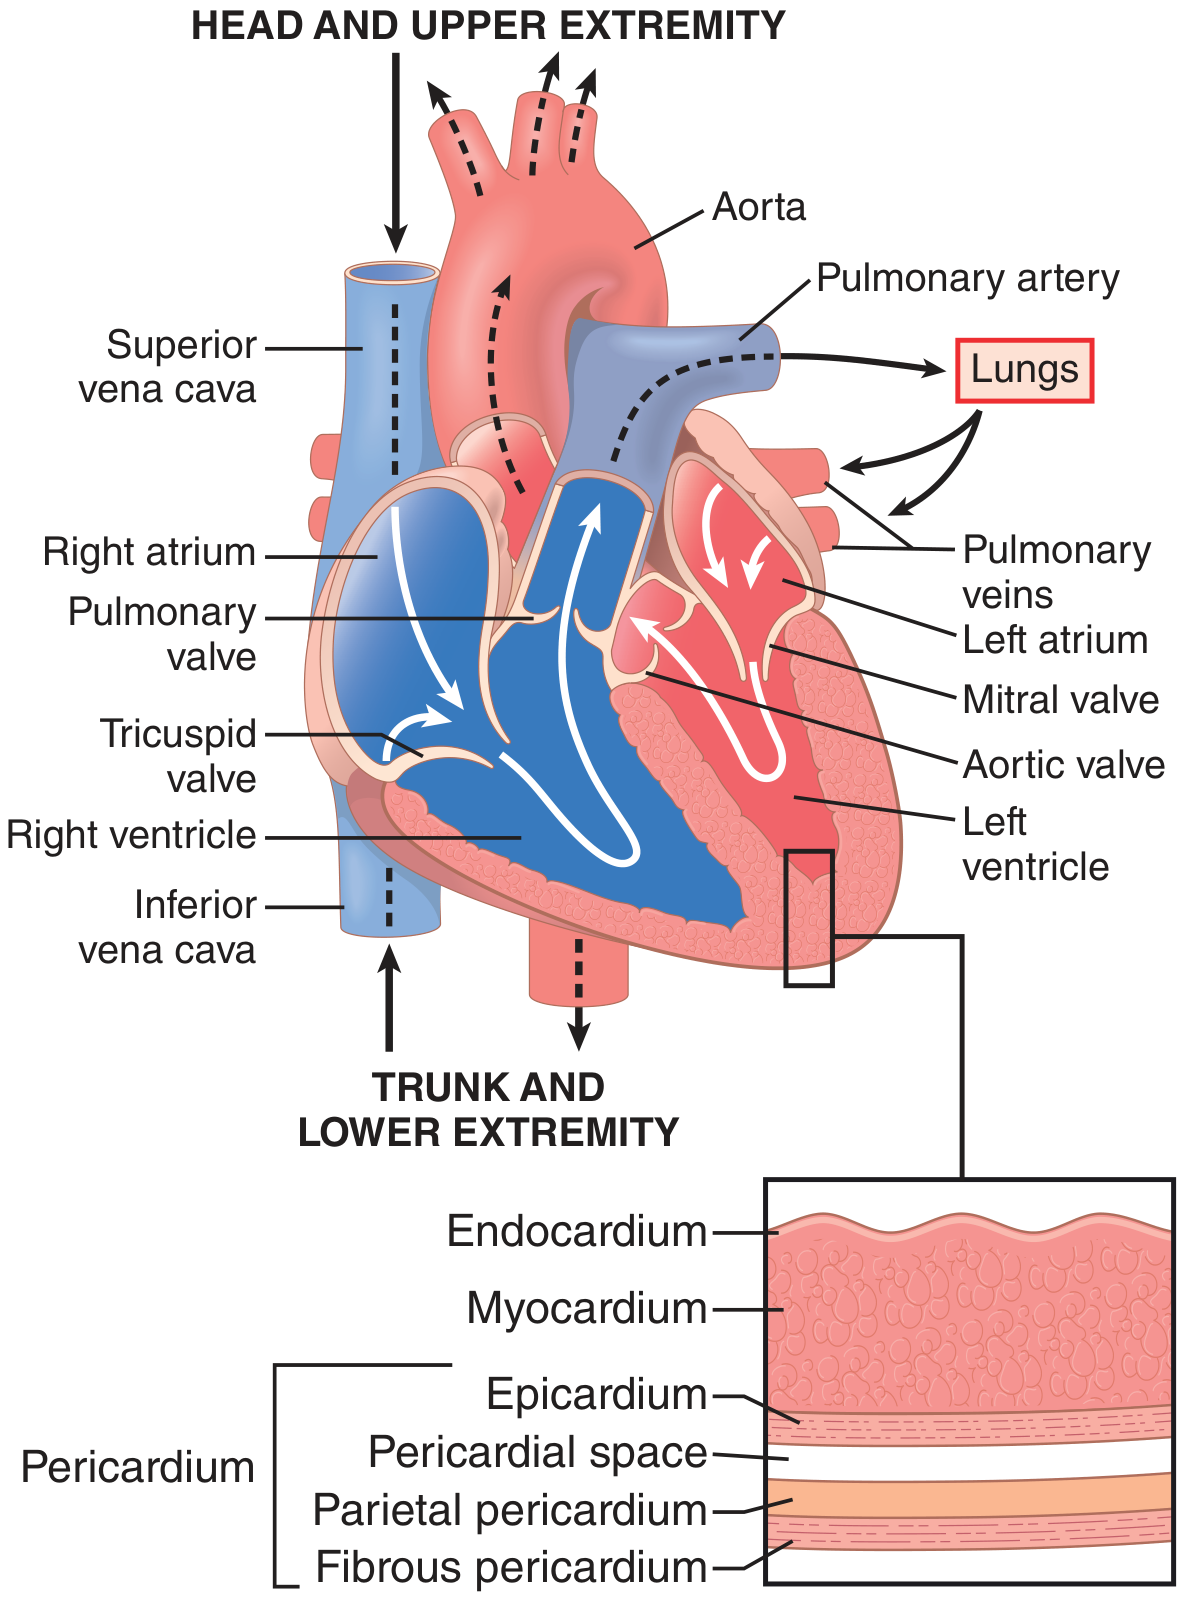
2.1 Position and Layers of the Wall
| Layer | Description |
|---|---|
| Endocardium | Innermost smooth lining, continuous with vessel endothelium |
| Myocardium | Thick muscular layer; performs pumping work |
| Epicardium | Outer visceral layer of the serosal pericardium |
2.2 Chambers
- Receives deoxygenated venous return from the superior vena cava (SVC), inferior vena cava (IVC), and the coronary sinus
- Contains the sinoatrial (SA) node in its wall, near the SVC-RA junction
- Has a thin wall - generates low pressures
- Thin-walled crescent-shaped chamber
- Separated from the LV by the interventricular septum
- Pumps against low pulmonary vascular resistance (PVR ~120-250 dynes·sec/cm⁵)
- Has very little reserve against acute large rises in PVR (e.g., massive PE, pneumonectomy)
- Receives oxygenated blood from four pulmonary veins
- Its posterior wall is the thinnest chamber wall
- Thick-walled primary pumping chamber composed of billions of cardiomyocytes connected end-to-end through gap junctions
- Generates systolic pressures of ~120 mmHg against high systemic vascular resistance (SVR)
- Organized into a double-helix muscle fiber arrangement (see below)
2.3 LV Torsion - The Wringing Motion
- Subepicardial (outer) fibers spiral in a left-handed helix
- Subendocardial (inner) fibers spiral in a right-handed helix
- Midwall fibers run circumferentially
3. Valves
| Valve | Location | Leaflets | Notes |
|---|---|---|---|
| Tricuspid | Right AV junction | 3 leaflets | Attached via chordae tendineae to papillary muscles |
| Mitral (Bicuspid) | Left AV junction | 2 leaflets | Attached to papillary muscles; prevents regurgitation during systole |
| Pulmonary | RV-PA junction | 3 semilunar cusps | No chordae; opens during RV systole |
| Aortic | LV-Aorta junction | 3 semilunar cusps | Coronary ostia arise just above valve |
- AV valves (tricuspid, mitral) open when ventricular pressure falls below atrial pressure (diastole) and close when ventricular pressure exceeds atrial pressure (systole)
- Semilunar valves (aortic, pulmonary) open when ventricular pressure exceeds arterial pressure and close during diastolic recoil
- The AV valves' papillary muscles contract simultaneously with the ventricle to hold leaflets in place and prevent prolapse - they do NOT pull the valves open
4. Conduction System
| Structure | Location | Intrinsic Rate |
|---|---|---|
| SA Node | RA near SVC junction | 60-100 bpm |
| AV Node | Base of interatrial septum | 40-60 bpm |
| Bundle of His | Upper interventricular septum | - |
| Bundle Branches | Left and right | - |
| Purkinje Fibers | Ventricular subendocardium | 20-40 bpm |
5. Coronary Circulation
- Right Coronary Artery (RCA): Supplies the RV, inferior LV, SA node (60% of people), AV node (85% of people)
- Left Anterior Descending (LAD): Supplies the anterior LV wall, anterior septum, apex
- Left Circumflex (LCx): Supplies the lateral and posterior LV
- During systole, the high intramyocardial pressure (especially subendocardial) compresses the vessels
- The aortic valve cusps partially occlude the coronary ostia during systole
- The diastolic aortic pressure is therefore the major determinant of coronary perfusion pressure
6. Cardiac Muscle Physiology
6.1 Syncytial Organization
- Gap junctions: Allow free ionic current flow between cells, making the myocardium a functional syncytium
- Desmosomes: Provide mechanical coupling
6.2 Action Potential
| Phase | Ion Movement | Result |
|---|---|---|
| Phase 0 | Rapid Na⁺ influx | Rapid depolarization (+20 mV) |
| Phase 1 | Brief K⁺ efflux | Early partial repolarization |
| Phase 2 | Ca²⁺ influx (LTCC) = K⁺ efflux | Plateau (~0 mV, 0.2-0.3 sec) |
| Phase 3 | Rapid K⁺ efflux | Repolarization |
| Phase 4 | Na⁺/K⁺ ATPase restoration | Resting potential (-85 mV) |
6.3 Excitation-Contraction Coupling
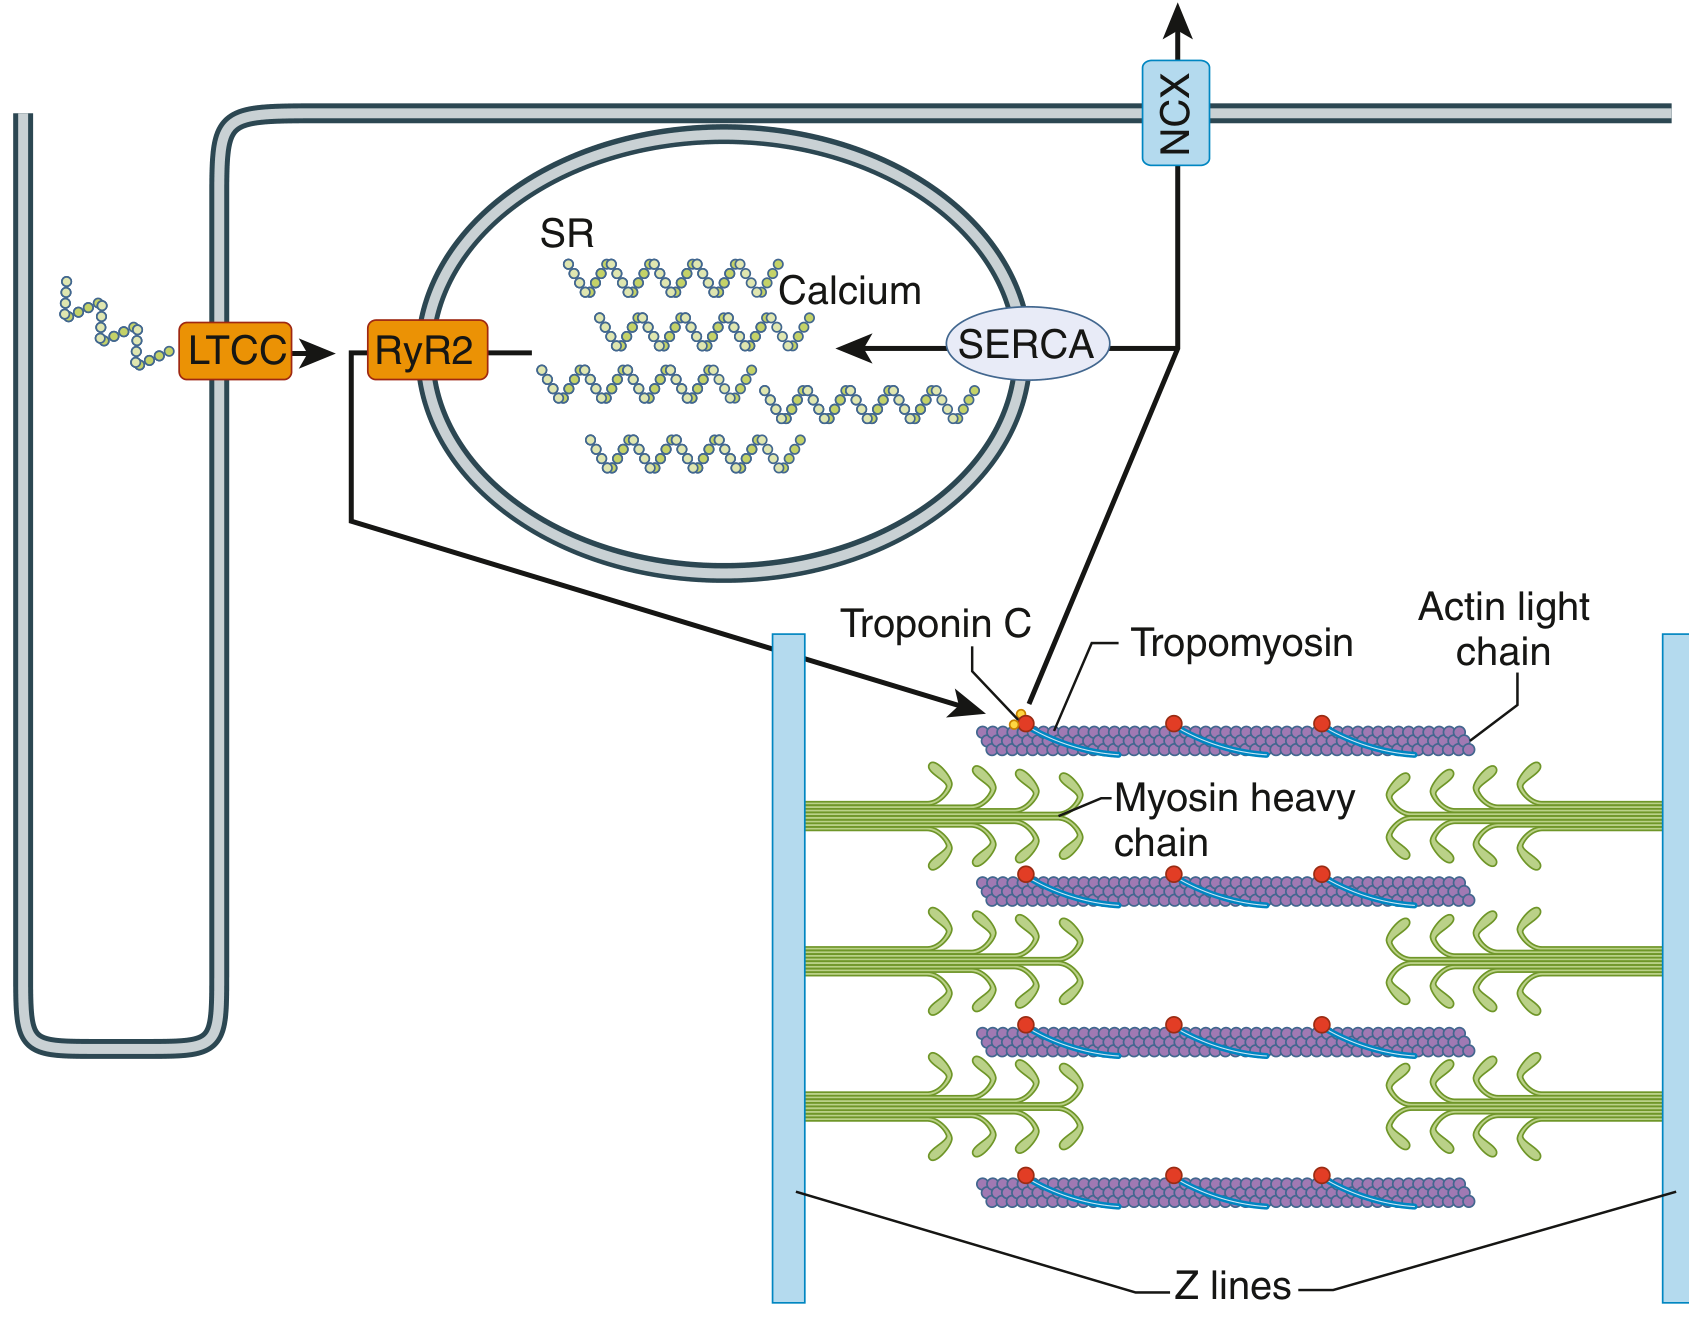
- Depolarization opens L-type calcium channels (LTCC) in the sarcolemma
- Small Ca²⁺ influx triggers ryanodine receptors (RyR2) on the sarcoplasmic reticulum (SR)
- Calcium-induced calcium release (CICR): Massive Ca²⁺ flood from SR (~10-fold amplification)
- Ca²⁺ binds troponin C, causing a conformational change in tropomyosin
- This exposes active sites on actin, allowing myosin heads to cross-bridge and slide - generating force
- Relaxation: Ca²⁺ is pumped back into SR by SERCA (sarcoplasmic/endoplasmic reticulum Ca²⁺ ATPase) and extruded from the cell by the sodium-calcium exchanger (NCX)
7. The Cardiac Cycle
Phases of the Cardiac Cycle
- Isovolumetric Contraction: AV valves close (S1 heart sound), semilunar valves still closed. Pressure rises rapidly at constant volume.
- Rapid Ejection: LV pressure exceeds aortic pressure → aortic valve opens → ~70% of stroke volume ejected
- Reduced Ejection: Slower ejection as pressure gradients equalize
- Isovolumetric Relaxation: Aortic valve closes (S2 heart sound), mitral valve still closed. Pressure falls rapidly at constant volume.
- Rapid Filling: LV pressure falls below LA pressure → mitral valve opens → ~70% of ventricular filling (passive)
- Diastasis: Slow filling period
- Atrial Systole ("atrial kick"): LA contracts, adds final ~30% of ventricular filling. Loss of this (e.g., atrial fibrillation) reduces CO.
Key Values
| Parameter | Normal Value |
|---|---|
| End-diastolic volume (EDV) | ~120-130 mL |
| End-systolic volume (ESV) | ~50-60 mL |
| Stroke Volume (SV = EDV - ESV) | ~70 mL |
| Ejection Fraction (EF = SV/EDV) | 55-70% |
| Cardiac Output (CO = SV × HR) | 4-6 L/min |
8. Determinants of Cardiac Performance
8.1 Preload
8.2 Afterload
8.3 Heart Rate
8.4 Contractility (Inotropy)
- Catecholamines (β₁ stimulation → ↑cAMP → ↑Ca²⁺ influx)
- Digoxin (↑intracellular Ca²⁺)
- Increased heart rate (Bowditch/staircase effect)
8.5 Oxygen Delivery
Summary Table
| Structure | Key Function |
|---|---|
| SA Node | Primary pacemaker (60-100 bpm) |
| AV Node | Delay conduction, rate-limits ventricular response |
| LV | High-pressure systemic pump (~120 mmHg) |
| RV | Low-pressure pulmonary pump (~25 mmHg) |
| Mitral/Tricuspid valves | Prevent AV regurgitation during systole |
| Aortic/Pulmonary valves | Prevent arterial backflow during diastole |
| Coronary arteries | Supply myocardium (mainly during diastole) |
| Intercalated discs/gap junctions | Create functional electrical syncytia |
| LTCC/RyR2/SERCA | Excitation-contraction coupling machinery |
- Guyton and Hall Textbook of Medical Physiology
- Goldman-Cecil Medicine (International Edition)
- Barash, Cullen & Stoelting's Clinical Anesthesia, 9e
- Sabiston Textbook of Surgery
Gross anatomy of heart for 15marks question
gross anatomy of heart external features borders surfaces
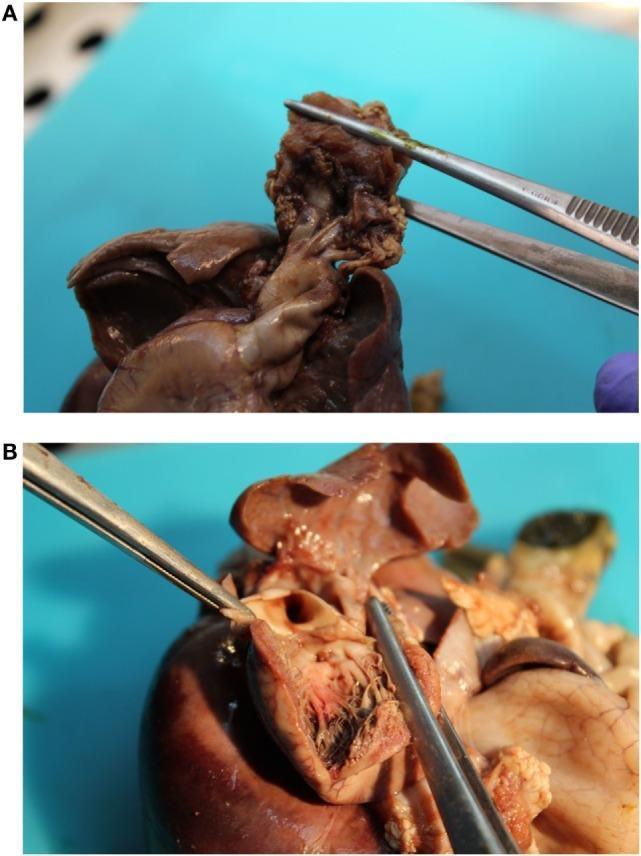
Two-panel gross pathological specimen from a fetal necropsy demonstrating congenital cardiovascular anomalies. Panel (A) shows the external anatomy of the heart and great vessels, highlighting a malpositioned aortic orifice and a distinctive 'S-shaped' curvature of the ascending aorta. Forceps are used to retract tissue, demonstrating that there is no transposition of the great vessels. Panel (B) shows a dissected view of the heart's internal chambers. Metal probes and forceps point to two small, punctate interventricular septal communications (ventricular septal defects): one muscular and one sub-arterial. Visible anatomical features include the interventricular septum, endocardial surfaces, and chordae tendineae. This specimen illustrates complex cardiac malformations often associated with genetic or developmental syndromes, emphasizing anatomical variations in the aortic arch and septal integrity.
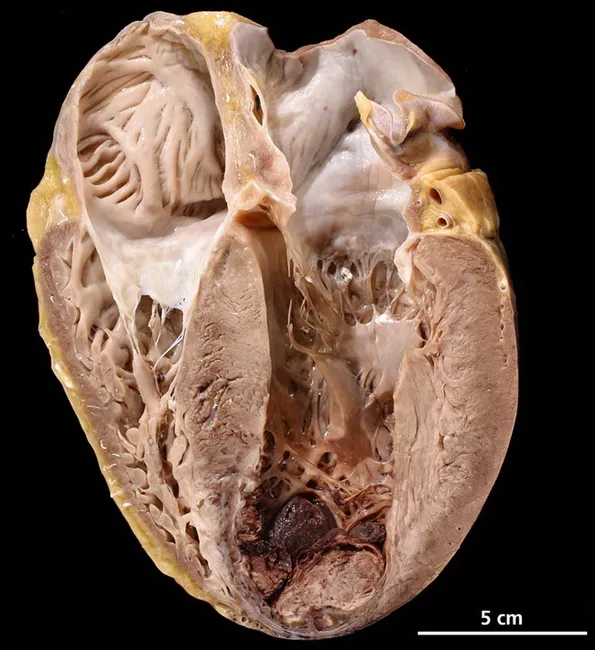
This gross pathology photograph documents an autopsy heart specimen with a longitudinal, apical view illustrating severe cardiovascular pathology underlying sudden death. Imaging modality: gross anatomy/necropsy photograph of a human heart, procured at autopsy, with a longitudinal/apical cross-section displaying the left ventricular apex. The heart exhibits marked biventricular hypertrophy with thickened LV walls and prominent endocardial surfaces. The anterior–apical septal region demonstrates features compatible with acute myocardial infarction, including pallor to dark discoloration and regional softening of myocardial tissue. A mural thrombus is evident at the LV apex, adherent to endocardial surface, presenting a risk for embolization. The coronary vasculature shows severe atherosclerotic narrowing in major epicardial vessels; although not visible in this specimen, the distribution is consistent with ischemic injury in the antero-apical-septal territory. The specimen is a postmortem evaluation, thus no in vivo contrast or staining was used. The scale bar indicates 5 cm for size reference. Clinical context includes obesity, diabetes mellitus type II, and tobacco use as major risk factors contributing to diffuse atherosclerosis and acute coronary occlusion. Diagnostic significance: confirms lethal ischemic heart disease with multivessel disease, supports sudden death due to acute MI with mural thrombus formation. Potential clinical applications include education, autopsy pathology reference, and radiology correlation.
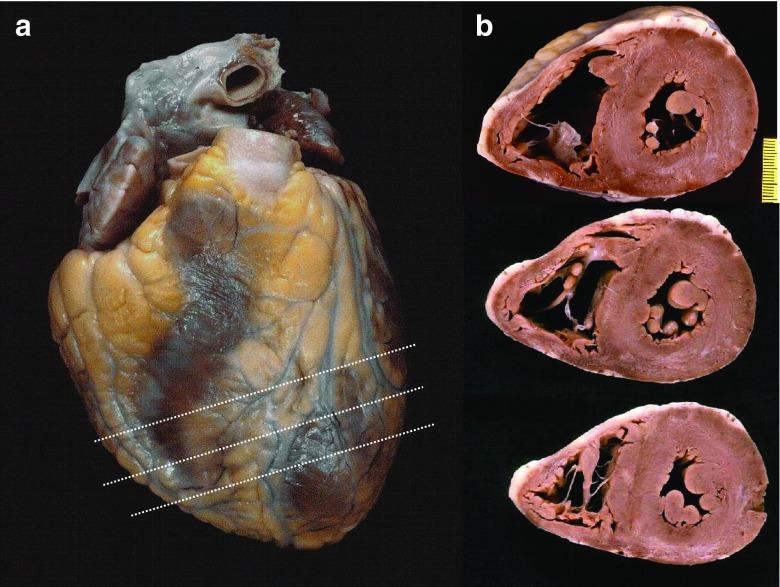
This clinical photograph illustrates the standard pathological procedure for short-axis cross-sectioning of a human heart specimen. Panel A shows a gross external view of the intact heart, displaying yellowish-tan epicardial fat and dark reddish-brown myocardial surfaces. Three transverse white dotted lines indicate the planned parallel sectioning levels starting from the mid-ventricular region towards the apex. Panel B displays the resulting three transverse (short-axis) slices. These sections demonstrate the characteristic cardiac anatomy: a thick-walled, circular left ventricular cavity and a thinner, crescent-shaped right ventricular cavity. Within the left ventricle, prominent papillary muscles and chordae tendineae are visible. The myocardium and endocardium can be assessed across these serial levels to identify pathological changes such as hypertrophy, infarction, or fibrosis. This technique is a fundamental component of forensic and clinical autopsy protocols for evaluating myocardial disease and ventricular morphology.
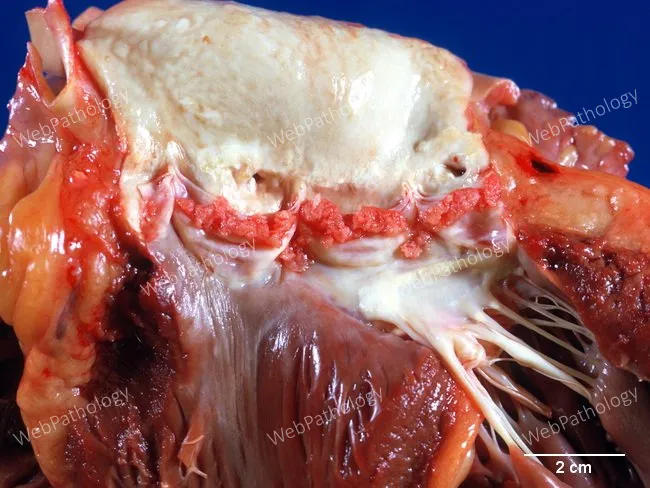
This is a gross pathology photograph of a dissected mammalian heart specimen, captured in a frontal, exterior view with key valvular and myocardial structures exposed. The scale bar indicates 2 cm for size reference. The specimen shows the left ventricular wall and base region, with overlying pale, chalky-appearing deposits along the atrioventricular junction and adjacent endocardial surfaces. Beneath the pale layer, the myocardium appears dark red to mahogany, with visible striations and a glossy texture consistent with fresh or lightly fixed muscle. Fine chordae tendineae and papillary muscle attachments extend toward the mitral valve apparatus, which is partially obscured by surrounding tissue. The epicardial fat is minimal, and surrounding cord-like connective tissue is evident in the valvular region. Overall, there is clear separation of tissue planes, allowing assessment of gross morphology without intact pericardium. Notable features include the juxtaposition of a dense, light-colored, non-vascular plaque-like region against vascularized myocardium, suggesting possible calcific or fibrous remodeling at the base of the heart. This image is suitable for educational demonstration of cardiac anatomy, valvular apparatus, gross pathologic appearance of myocardial tissue, and correlation with histopathology. Interpretation may guide differential considerations including fibrous valvulopathy, calcification, and sequelae of prior ischemic injury or remodeling.
heart position mediastinum pericardium layers anatomy
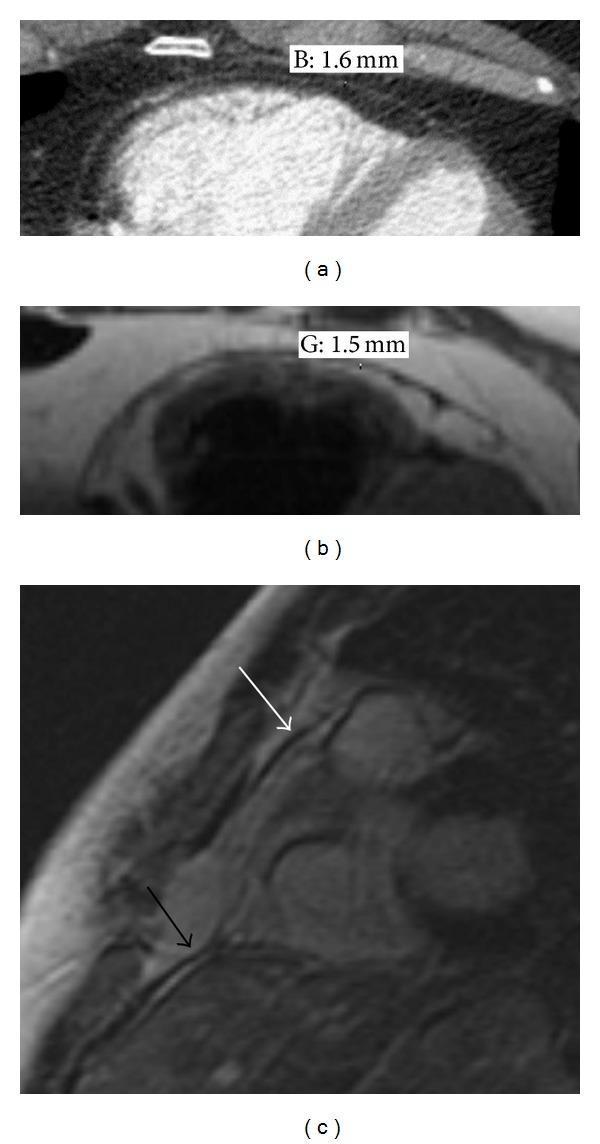
This composite of diagnostic images illustrates the normal anatomy and appearance of the human pericardium using multiple modalities. Panel (a) shows a gated contrast-enhanced axial CT image where the normal pericardium is visible as a thin, radiopaque line (measured at 1.6 mm) positioned between the epicardial and pericardial fat layers. Panel (b) provides an axial double inversion recovery MRI of the same patient, demonstrating a similar thickness (1.5 mm), where the parietal and visceral layers appear as a single indistinguishable band. Panel (c) presents a sagittal post-contrast gradient MR image highlighting the stabilizing ligaments of the heart. A white arrow identifies the pericardial-sternal ligament connecting the pericardium to the posterior sternum, while a black arrow indicates the pericardial-diaphragmatic ligament. These images serve as an educational reference for normal pericardial thickness (typically ≤2 mm) and the structural relationships between the pericardial sac, surrounding adipose tissue, and musculoskeletal anchors in the mediastinum.
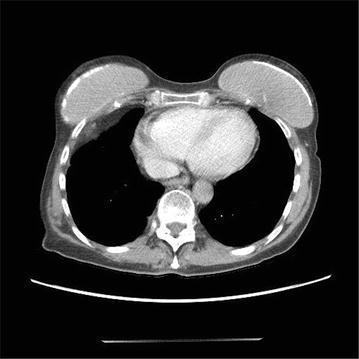
Axial non-contrast computed tomography (CT) scan of the thorax at the level of the heart, demonstrating normal cardiac anatomy and clear lung fields. The image features the heart centrally within the mediastinum, surrounded by the pulmonary parenchyma, which appears uniformly low-density (hypodense) indicative of normal aeration. The pericardium is visualized as a thin, crisp border without evidence of thickening or fluid accumulation, representing the complete resolution of a previous pericardial effusion. Key anatomical landmarks include the vertebral body posteriorly, ribs and thoracic wall musculature laterally, and breast tissue anteriorly. This diagnostic image serves as a clinical follow-up to monitor the response to steroid treatment in cases of immune-related adverse events (irAEs), specifically showing the absence of pericardial fluid or pleural effusions.
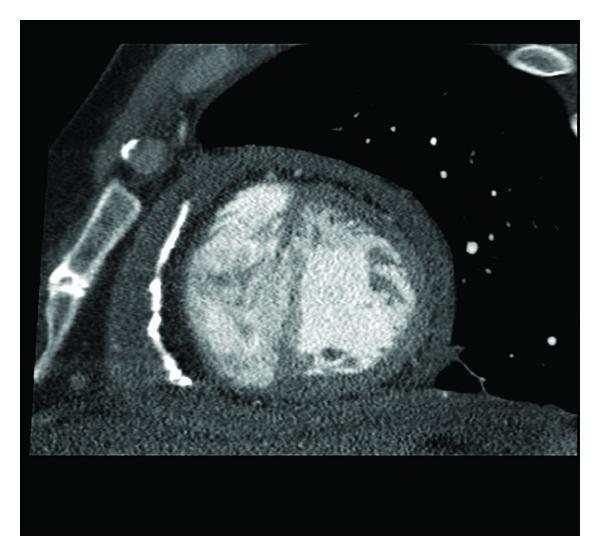
An axial non-contrast CT scan of the thorax focusing on the heart and mediastinum. The image demonstrates a diagnostic hallmark of constrictive pericarditis. The primary visual finding is a significantly thickened and fibrotic pericardium encircling the cardiac silhouette. Extensive, high-density calcifications are visible within the anterior and lateral pericardial layers, appearing as bright, opaque linear and curvilinear structures. These calcified plaques are prominently situated over the right and left ventricular surfaces. The cardiac chambers appear compressed or restricted by the rigid, thickened pericardial shell. Surrounding anatomical landmarks include the sternum anteriorly and portions of the lung parenchyma laterally. This imaging is clinically significant for evaluating chronic constrictive pericarditis, illustrating the characteristic 'armored heart' (pericarditis calculosa) which leads to impaired diastolic filling and clinical signs of heart failure.
coronary arteries right left anterior descending circumflex diagram
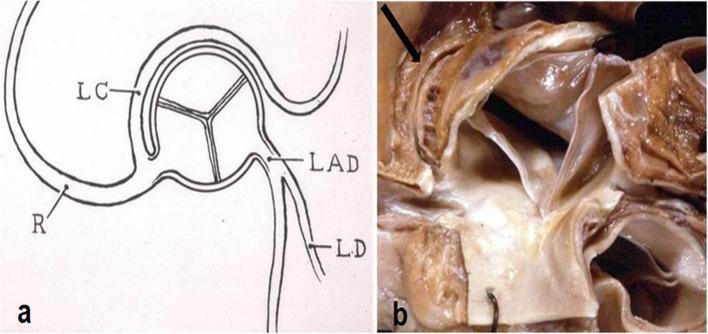
This composite educational material demonstrates a common coronary artery anomaly: the origin of the left circumflex artery from the right coronary artery with a retroaortic course. Panel (a) is an anatomical diagram showing the right coronary artery (R) giving rise to the left circumflex (LC), which then travels posterior to the aortic root. The left anterior descending (LAD) and left descending (LD) arteries are shown originating separately from the left aortic sinus. Panel (b) is a gross clinical photograph of an autopsied aortic root. An arrow points to the actual anomalous vessel as it courses behind the posterior aspect of the aorta. This visual highlights a significant anatomical variation where the LC does not arise from the left main coronary artery but instead originates from the right system and traverses between the aorta and the atria. This condition is clinically relevant in cardiology and cardiothoracic surgery, as the retroaortic pathway can be associated with myocardial ischemia or complicate surgical procedures involving the aortic valve or root.
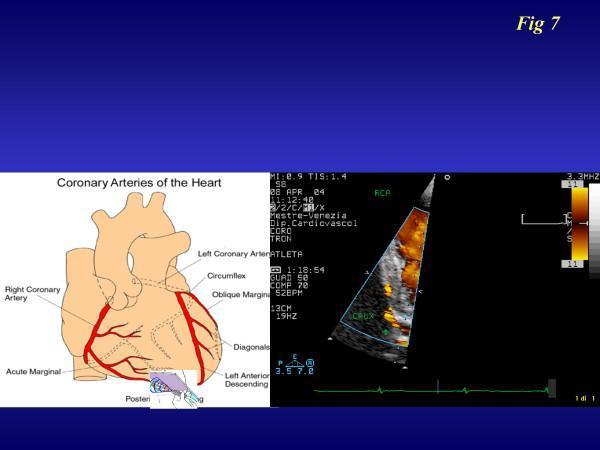
A dual-panel medical illustration and diagnostic image set demonstrating the transthoracic imaging of the right coronary artery (RCA). The left panel is an anatomical diagram of the 'Coronary Arteries of the Heart,' highlighting the major epicardial vessels including the Right Coronary Artery, Acute Marginal artery, Left Coronary Artery, Circumflex, Oblique Marginal, Diagonals, and Left Anterior Descending (LAD) artery. The right panel is a color Doppler transthoracic echocardiogram (TTE) in a specialized apical off-axis view. It displays real-time blood flow within the RCA, labeled as 'RCA' and 'CRUX' (indicating the crux of the heart), represented by a red and yellow color scale signifying flow velocity. A vertical color velocity bar and an electrocardiogram (ECG) trace are visible on the periphery. This comparison is used to guide non-invasive assessment of coronary flow reserve (CFR) by correlating anatomical landmarks with functional Doppler flow signals in a clinical cardiology setting.
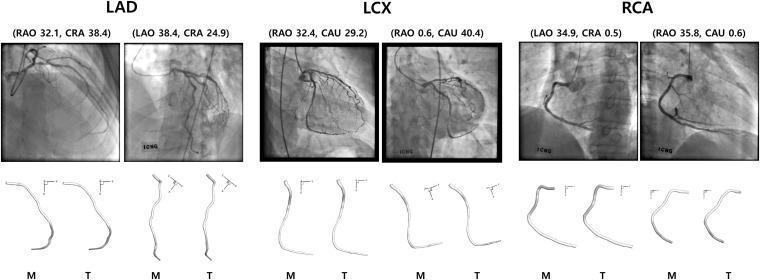
This diagnostic image and anatomical diagram set illustrates 3-D reconstructions of the human coronary arteries derived from 2-D coronary angiograms. The content is organized into three sections covering the Left Anterior Descending (LAD) artery, the Left Circumflex (LCX) artery, and the Right Coronary Artery (RCA). Each section displays two angiographic views captured at different projection angles, labeled with RAO/LAO (Right/Left Anterior Oblique) and CRA/CAU (Cranial/Caudal) coordinates. Below the radiographs are 3-D centerline models reconstructed using two computational methods: Manual matching (M) of landmark points and automated Template matching (T). The diagrams highlight the vascular morphology, including vessel curvature and tapering, demonstrating the precision of computerized reconstruction in interventional cardiology. This material is designed for advanced medical education in radiology and cardiology, focusing on the application of deep learning and geometric back-projection to overcome vessel foreshortening in diagnostic imaging.
GROSS ANATOMY OF THE HEART
(15 Marks Answer)
INTRODUCTION
1. POSITION AND EXTERNAL FEATURES
- Location: Middle mediastinum of the thoracic cavity, behind the body of the sternum, between the 2nd and 5th costal cartilages
- Size: Roughly the size of the owner's closed fist; weighs approximately 250-350 g
- Orientation: The heart is not symmetrically placed - approximately 2/3 lies to the left of the midsternal line
Surfaces of the Heart
| Surface | Formed By | Relations |
|---|---|---|
| Sternocostal (Anterior) | Mainly right ventricle | Behind sternum and costal cartilages |
| Diaphragmatic (Inferior) | Left ventricle + part of right ventricle | Rests on central tendon of diaphragm |
| Base (Posterior) | Mainly left atrium + part of right atrium | Faces posteriorly; receives pulmonary veins |
| Left pulmonary surface | Left ventricle | Faces left lung |
| Right pulmonary surface | Right atrium | Faces right lung |
Borders of the Heart
| Border | Formed By |
|---|---|
| Right border | Right atrium (from 3rd to 6th costal cartilage) |
| Left border | Left ventricle + small portion of left auricle |
| Inferior border | Right ventricle + apex (left ventricle) |
| Superior border | Right and left atria + auricles + great vessel origins |
Apex
- Formed by the left ventricle
- Directed downward, forward, and to the left
- Located in the left 5th intercostal space, 9 cm from the midsternal line (at the midclavicular line)
- The apex beat is felt and auscultated here
2. PERICARDIUM
Layers
Fibrous pericardium (outermost)
↓
Parietal layer of serous pericardium
↓ (pericardial cavity - 15-50 mL fluid)
Visceral layer of serous pericardium = Epicardium
↓
Myocardium
↓
Endocardium (innermost)
Fibrous Pericardium
- Cone-shaped, tough connective tissue bag
- Base is fused to the central tendon of the diaphragm (and a small muscular area on the left)
- Apex is continuous with the tunica adventitia of the great vessels
- Anteriorly attached to the sternum by sternopericardial ligaments
- Limits overdistension of the heart
- Supplied by phrenic nerve (pericardiacophrenic vessels)
Pericardial Sinuses
| Sinus | Location | Clinical Significance |
|---|---|---|
| Transverse pericardial sinus | Posterior to ascending aorta and pulmonary trunk; anterior to SVC; superior to LA | Surgeon can pass a finger here to compress arteries separately from veins during cardiac surgery |
| Oblique pericardial sinus | J-shaped cul-de-sac posterior to left atrium | A hand placed under the cardiac apex slides into this sinus |
Clinical: Pain from parietal pericarditis is referred to the shoulder and neck (C3-C5 dermatomes) because somatic sensation from the pericardium is carried by the phrenic nerve (C3, C4, C5). Rapid fluid accumulation causes cardiac tamponade because the rigid fibrous pericardium cannot expand.
3. WALL OF THE HEART
- Epicardium (visceral serous pericardium) - thin outer layer, contains coronary vessels and epicardial fat
- Myocardium - thick muscular layer; thickest in the LV (~10-12 mm), thinnest in the atria (~2-3 mm)
- Endocardium - smooth inner lining, continuous with vessel endothelium
4. INTERNAL ANATOMY OF THE CHAMBERS
Right Atrium (RA)
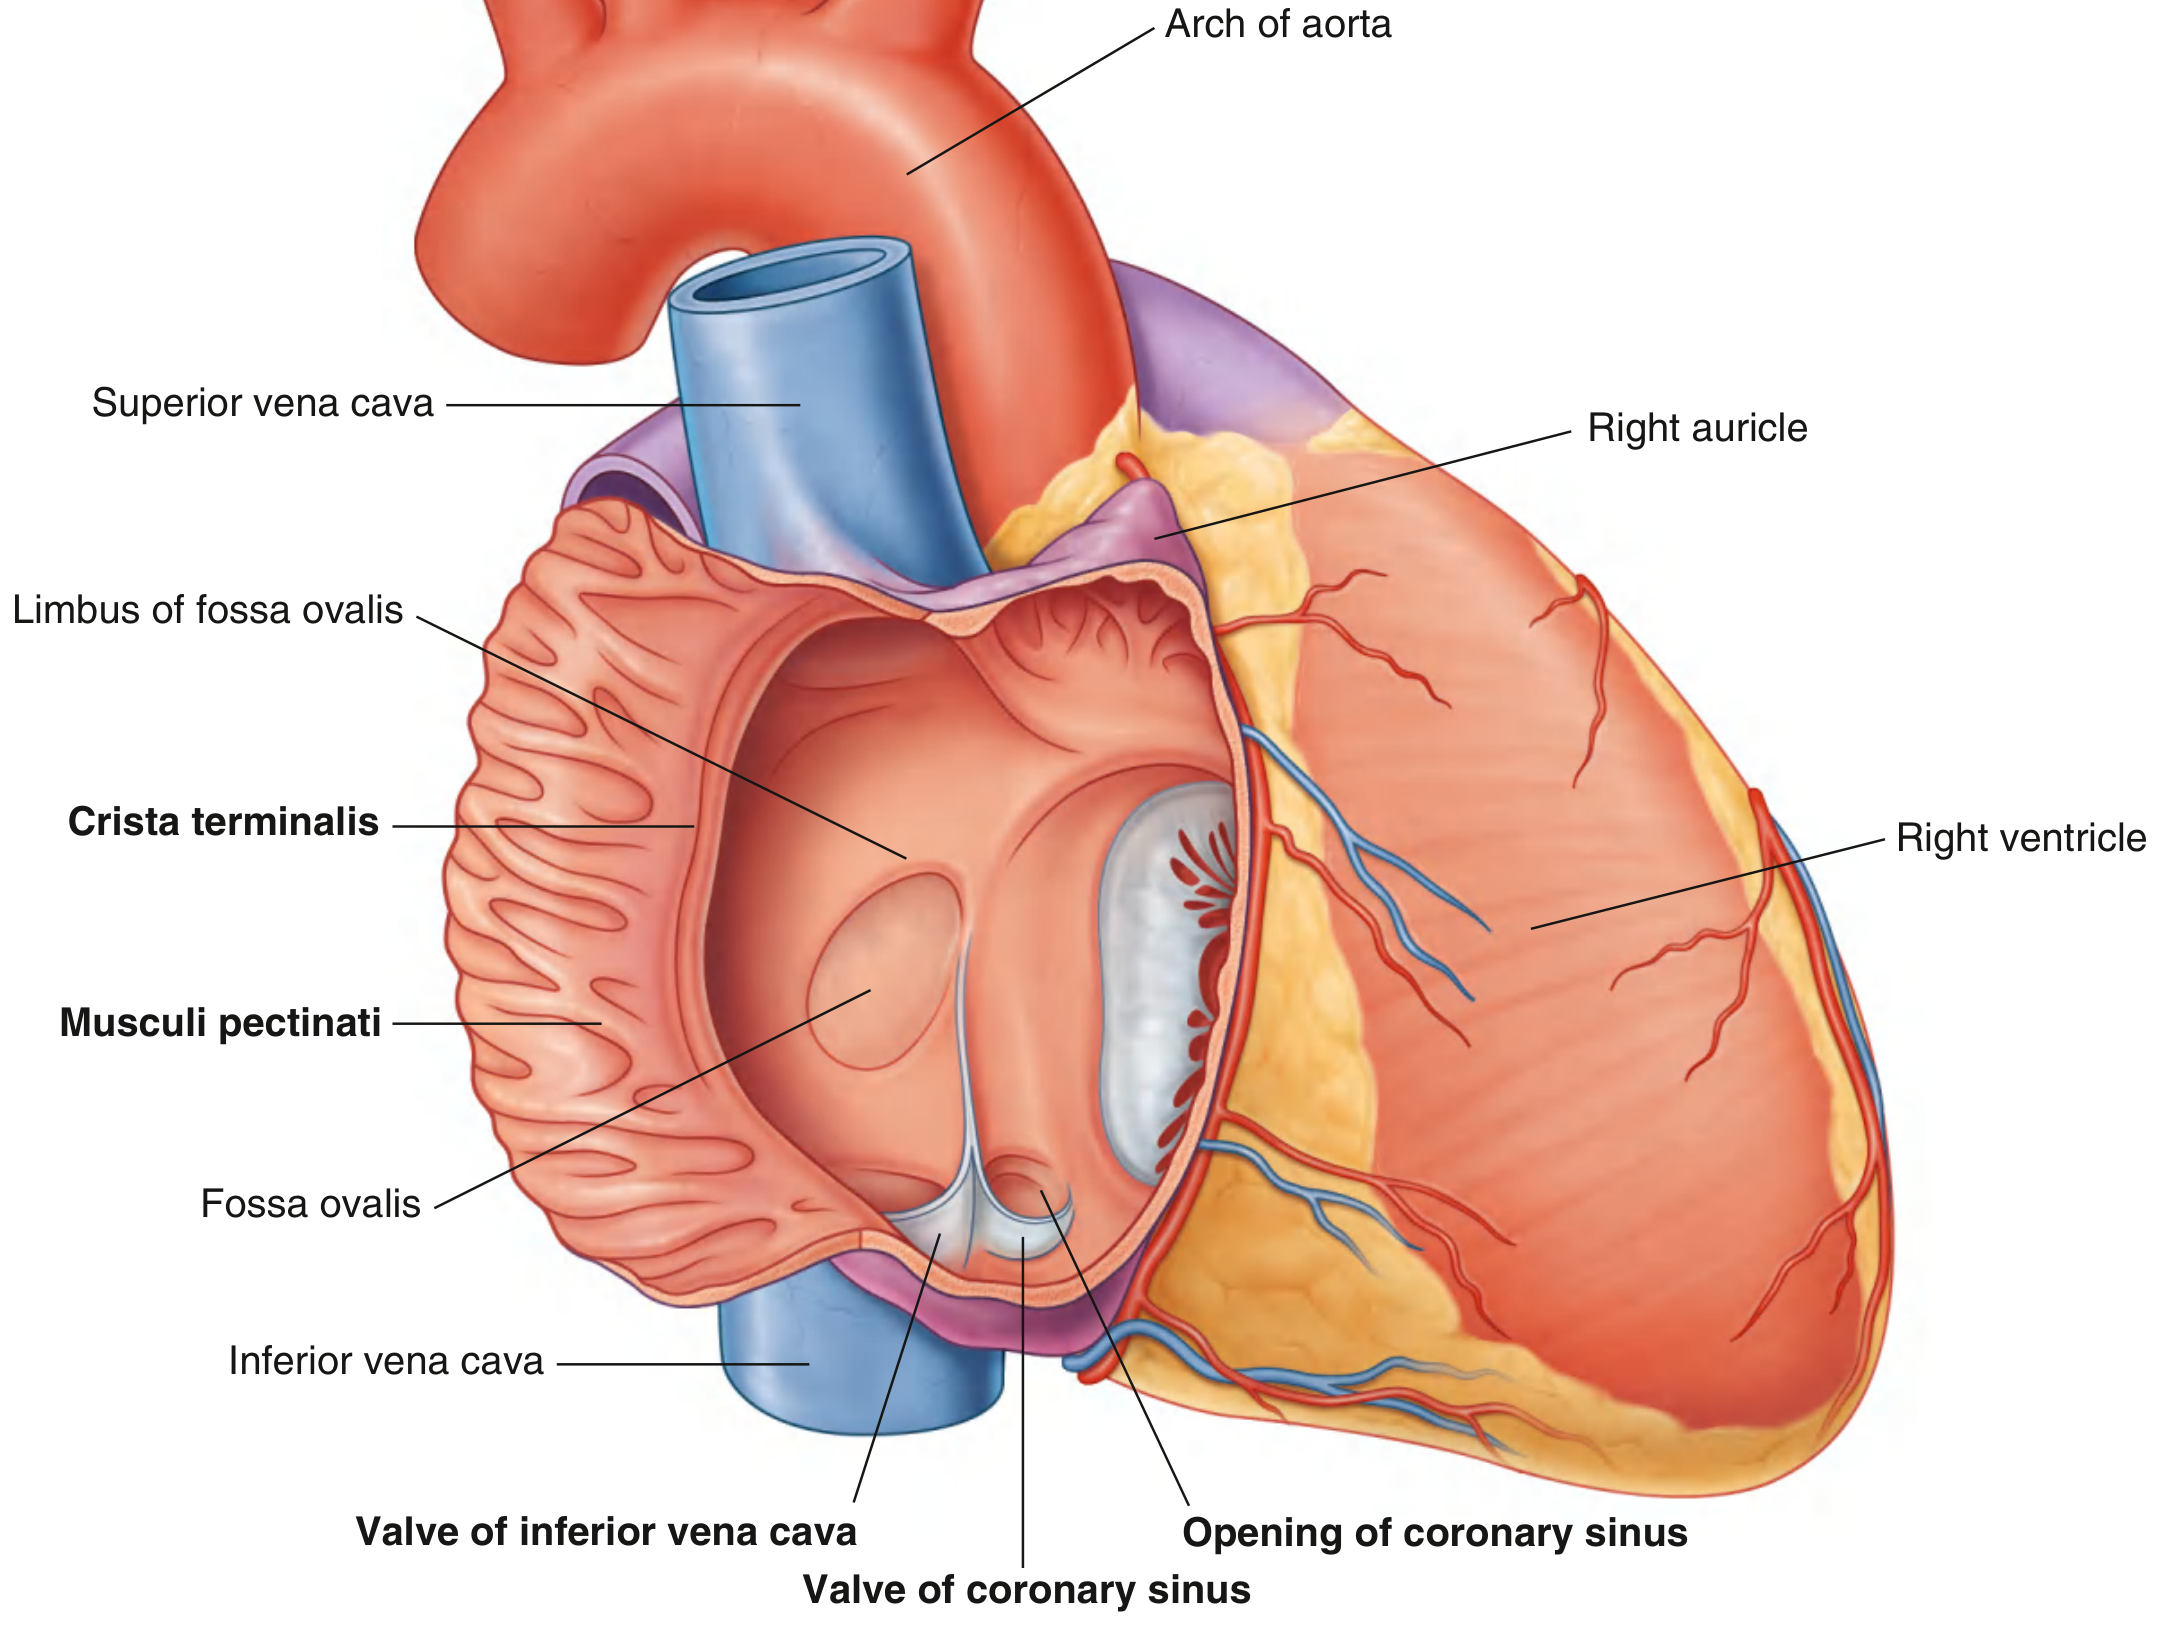
| Feature | Description |
|---|---|
| Crista terminalis | Vertical muscular ridge separating smooth sinus venarum (posteriorly) from trabeculated atrium proper (anteriorly) |
| Musculi pectinati | Horizontal ridges that fan from the crista terminalis like "teeth of a comb" |
| Sinus venarum | Smooth posterior wall; receives SVC (above) and IVC (below) |
| Fossa ovalis | Oval depression in the interatrial septum; remnant of embryonic foramen ovale |
| Limbus fossa ovalis | Prominent margin/border surrounding the fossa ovalis |
| Opening of coronary sinus | Medial to IVC opening; guarded by valve of coronary sinus (Thebesian valve) |
| Valve of IVC (Eustachian valve) | Directs blood through foramen ovale in fetal life |
| Right auricle | Ear-like muscular pouch that overlaps the ascending aorta |
| AV node | Located in the interatrial septum near the coronary sinus opening (Koch's triangle) |
Right Ventricle (RV)
- Forms most of the anterior surface of the heart and part of the inferior (diaphragmatic) surface
- Crescent-shaped in cross-section; thin-walled (pumps against low PVR)
| Feature | Description |
|---|---|
| Trabeculae carneae | Muscular ridges, bridges, and papillary muscles on the inner wall |
| Papillary muscles | Anterior (largest), posterior, and septal (smallest); attached to tricuspid via chordae tendineae |
| Conus arteriosus (infundibulum) | Smooth-walled outflow tract leading to the pulmonary valve; derived from embryonic bulbus cordis |
| Moderator band (septomarginal trabecula) | Muscular band crossing from interventricular septum to the base of the anterior papillary muscle; carries the right bundle branch of the conducting system |
- Tricuspid valve (right AV valve): 3 leaflets - anterior, posterior, and septal
- Pulmonary valve: 3 semilunar cusps - left, right, and anterior (based on fetal position)
Left Atrium (LA)
- Forms most of the base (posterior surface) of the heart
- Has the thinnest wall of all four chambers
- Divided embryologically into two portions:
- Posterior smooth portion: receives 4 pulmonary veins (2 right, 2 left); derived from incorporated pulmonary vein tissue
- Anterior trabeculated portion: contains musculi pectinati; continuous with the left auricle
- Interatrial septum forms the anterior wall of LA; contains the valve of the foramen ovale (thin area opposite the fossa ovalis)
- No crista terminalis (unlike RA)
Clinical: The LA's posterior proximity to the esophagus makes it accessible on barium swallow (LA enlargement pushes esophagus posteriorly). LA is also the most common site of myxoma.
Left Ventricle (LV)
- Conical-shaped, longer than the RV
- Has the thickest myocardium (~10-12 mm) - generates high systolic pressure (~120 mmHg)
- Contributes to the anterior, diaphragmatic, left pulmonary surfaces, and forms the apex
| Feature | Description |
|---|---|
| Trabeculae carneae | Fine and delicate (contrast with coarser ones in RV) |
| Papillary muscles | Two: anterior and posterior; larger than those in RV |
| Chordae tendineae | Connect papillary muscles to mitral valve leaflets |
| Aortic vestibule | Smooth-walled outflow tract leading to aortic valve; derived from bulbus cordis |
- Mitral valve (bicuspid): 2 leaflets - anterior (aortic) and posterior (mural)
- Aortic valve: 3 semilunar cusps - right (right coronary), left (left coronary), and posterior (non-coronary/non-coronary cusp). Each cusp has a nodule (of Arantius) at the center and lunulae at the edges
5. FIBROUS SKELETON OF THE HEART
- Provides attachment for cardiac muscle and valve leaflets
- Electrically insulates atria from ventricles (conduction only through AV bundle)
- Prevents overstretching of valves during contraction
6. CORONARY CIRCULATION
Arterial Supply
- Arises from the right aortic sinus
- Runs in the right atrioventricular (coronary) groove
- Key branches:
- SA nodal artery - to SA node (in 60% of people)
- Right marginal artery - along inferior border of RV
- Posterior interventricular (posterior descending) artery - in posterior interventricular groove (in right dominant circulation - 85%)
- AV nodal artery - to AV node (in 85% of people)
- Supplies: RV, inferior LV wall, posterior septum, SA node, AV node (in most people)
- Arises from the left aortic sinus as a short left main stem (~2 cm)
- Divides into:
- Left Anterior Descending (LAD) - runs in the anterior interventricular groove toward the apex
- Branches: diagonal arteries (to anterior LV wall), septal perforators (to anterior 2/3 of interventricular septum)
- Supplies: anterior LV wall, apex, anterior 2/3 of interventricular septum, right bundle branch, left anterior fascicle
- Left Circumflex (LCx) - runs in the left AV groove
- Branches: obtuse marginal arteries (to lateral LV wall)
- Supplies: lateral and posterior LV wall; SA node in 40% of people
- Left Anterior Descending (LAD) - runs in the anterior interventricular groove toward the apex
"Left Main Disease" is the most dangerous single-vessel coronary lesion because it threatens both LAD and LCx territory simultaneously.
- Right dominant: 85% (RCA supplies PDA)
- Left dominant: 8% (LCx supplies PDA)
- Co-dominant: 7%
Venous Drainage
| Vein | Course | Drains Into |
|---|---|---|
| Great cardiac vein | Anterior interventricular groove → left AV groove | Coronary sinus (left end) |
| Middle cardiac vein | Posterior interventricular groove | Coronary sinus (right end) |
| Small cardiac vein | Right marginal → right AV groove | Coronary sinus (right end) |
| Posterior vein of LV | Diaphragmatic surface of LV | Coronary sinus |
| Oblique vein of LA (of Marshall) | Posterior LA wall | Coronary sinus (left end); remnant of embryonic left SVC |
- Anterior cardiac veins: Drain directly into right atrium
- Venae cordis minimae (Thebesian veins): Drain directly into chambers, mainly atria
7. NERVE SUPPLY OF THE HEART
| Nerve | Origin | Effect |
|---|---|---|
| Sympathetic | T1-T4 via superior, middle, inferior cervical cardiac branches and thoracic cardiac branches | + Chronotropy, + Inotropy, + Dromotropy; coronary vasodilation |
| Parasympathetic | Vagus nerve (CN X) via superior and inferior cervical cardiac branches and thoracic cardiac branches | - Chronotropy, - Dromotropy; slows SA and AV nodes |
8. CONDUCTING SYSTEM (Gross Anatomy)
| Component | Location |
|---|---|
| SA Node (Keith-Flack node) | Junction of SVC and right atrium, in the sulcus terminalis |
| AV Node (Aschoff-Tawara node) | Floor of right atrium, in Koch's triangle (bounded by coronary sinus, tricuspid annulus, and tendon of Todaro) |
| Bundle of His | Crosses the fibrous skeleton; runs along the upper interventricular septum |
| Right Bundle Branch | Travels in the septomarginal trabecula (moderator band) to reach anterior papillary muscle |
| Left Bundle Branch | Divides into anterior and posterior fascicles |
| Purkinje Fibers | Subendocardial network in both ventricles |
SUMMARY TABLE
| Feature | Right Side | Left Side |
|---|---|---|
| Atrium | Thin wall; pectinate muscles + crista terminalis; fossa ovalis | Forms base of heart; smooth posterior half; no crista terminalis |
| Ventricle | Anterior surface; crescent-shaped; coarse trabeculae; moderator band | Forms apex & diaphragmatic surface; thickest myocardium; fine trabeculae |
| AV Valve | Tricuspid (3 leaflets) | Mitral/Bicuspid (2 leaflets) |
| Semilunar Valve | Pulmonary (3 semilunar cusps) | Aortic (3 semilunar cusps + nodules of Arantius) |
| Coronary artery | RCA - inferior/right | LCA (LAD + LCx) - anterior/lateral/posterior |
| Pressure generated | ~25 mmHg systolic | ~120 mmHg systolic |