
6. Waveforms & Graphics ⭐⭐⭐⭐⭐ Understand: Pressure-time curve Flow-time curve Volume-time curve Pressure-volume loop Flow-volume loop Recognize: Secretions Bronchospasm Air leak Patient-ventilator asynchrony Auto-PEEP Overdistension
ventilator waveforms pressure time flow time volume time curves
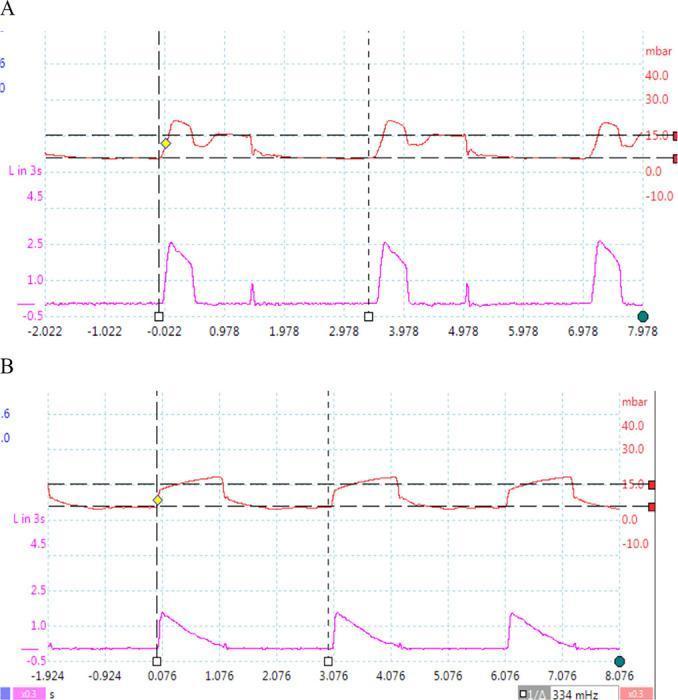
A comparison chart consisting of two sets of mechanical ventilation waveforms (pressure-time and flow-time curves) demonstrating different control variables. The upper panel (Ventilator 1) shows characteristics of volume-controlled ventilation, where the pressure curve (red) reaches a peak and then maintains a plateau, while the flow curve (purple) rises instantaneously and remains constant before falling, indicating a square flow waveform. The lower panel (Ventilator 2) illustrates pressure-controlled ventilation. In this mode, the pressure curve (red) rapidly rises to a set level (approximately 15 mbar) and maintains a plateau, while the flow curve (purple) shows a peak followed by a decelerating ramp pattern. Both panels show three respiratory cycles over an approximately 8-second window, with vertical dashed lines marking the start of inspiration. These waveforms are critical for respiratory therapy education to distinguish between volume-preset and pressure-preset mechanical ventilation strategies.
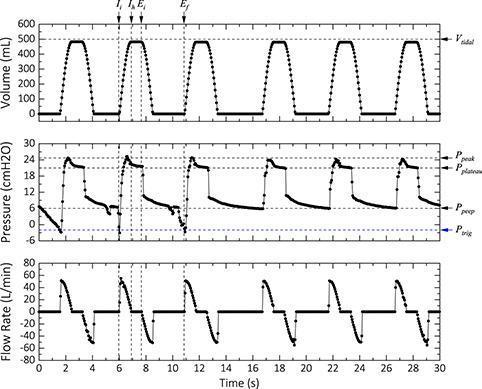
This diagnostic graphic displays three stacked ventilator waveforms (Volume, Pressure, and Flow Rate) over a 30-second interval, demonstrating mechanical ventilation in assisted mode. The top graph shows Tidal Volume (Vt) pulsing consistently to approximately 500 mL with a distinct plateau indicating an end-inspiratory hold. The middle Pressure-time waveform illustrates critical respiratory parameters: a negative deflection reaching the trigger pressure (Ptrig) of -2 cmH2O initiates each breath, followed by a rapid rise to a peak inspiratory pressure (Ppeak) of ~25 cmH2O. An inspiratory hold reveals a plateau pressure (Pplateau) of ~22 cmH2O, with the cycle concluding at a positive end-expiratory pressure (PEEP) of ~5 cmH2O. The bottom Flow Rate graph displays corresponding inspiratory and expiratory flow pulses. Annotations mark key temporal points: initial inspiration (Ii), inspiratory hold (Ih), end-inspiration (Ei), and end-expiration (Ef). This visualization is essential for understanding ventilator-patient synchrony, mechanical lung properties (compliance and resistance), and the functioning of pressure-triggered assisted ventilation modes.
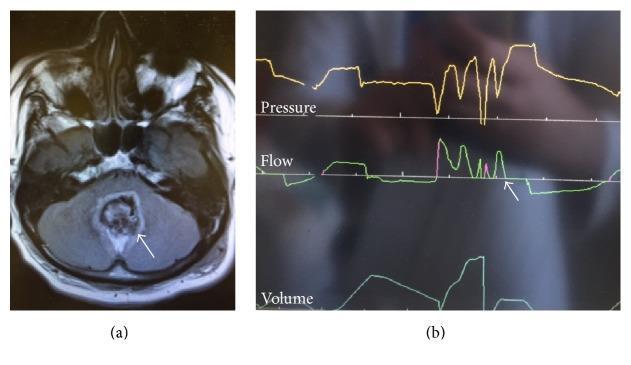
A composite medical image featuring neuroimaging and ventilator waveforms. (a) Axial T2 Fluid Attenuated Inversion Recovery (FLAIR) MRI of the brain at the level of the posterior fossa. An arrow indicates a heterogeneous hyperintense area in the midline cerebellum, consistent with a status post-resection medulloblastoma. The pathology causes significant effacement and compression of the fourth ventricle. (b) Mechanical ventilator monitor display illustrating pressure, flow, and volume curves over time. The waveforms demonstrate a 'cluster breathing' pattern, characterized by irregular groups of rapid breaths followed by periods of apnea. This respiratory abnormality is a clinical sign of neurological injury, specifically involving the lower pons or medulla. The combination illustrates the correlation between structural brainstem compression in the posterior fossa and the resulting dysfunctional central respiratory drive.
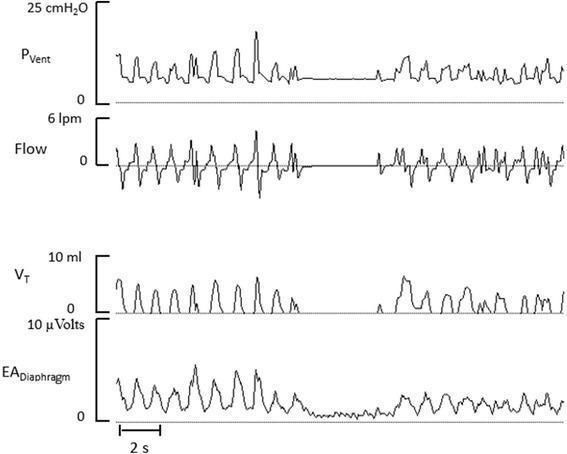
A multi-panel respiratory waveform tracing illustrating Neurally Adjusted Ventilatory Assist (NAVA) in a premature infant. The image displays four vertically stacked waveforms over time: ventilator pressure (PVent, 0–25 cmH2O), flow (0–6 lpm), tidal volume (VT, 0–10 ml), and diaphragmatic electrical activity (EADiaphragm, 0–10 μVolts). The tracings demonstrate a proportional relationship where the ventilator pressure dynamically adjusts to match the magnitude and timing of the EADiaphragm signals, reflecting the patient's spontaneous neural respiratory drive. During inspiration, a rise in EADiaphragm triggers a corresponding increase in PVent, flow, and VT. Conversely, a breathing pause is clearly visible in the middle of the tracing, where the absence of diaphragmatic electrical activity results in a cessation of ventilator pressure delivery. This clinical diagnostic image serves as an educational example of advanced neonatal synchronization and patient-triggered ventilation modes, highlighting how physiological feedback can be used to coordinate mechanical support with intrinsic respiratory effort.
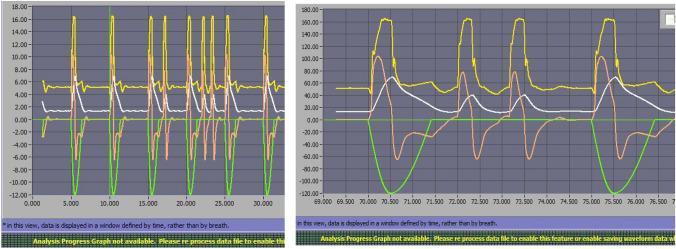
This diagnostic graphic displays mechanical ventilation waveforms from a Hamilton C3 ventilator during Pressure Support Ventilation (PSV 10), illustrating ventilator asynchrony under restrictive lung patterns with air leaks. Two side-by-side time-series graphs plot respiratory parameters: Airway Pressure (Paw, yellow), Delivered Volume (white), Flow (red/orange), and Muscular Pressure (green). The green line represents patient effort (negative deflection indicates inspiration), while the yellow and white lines represent ventilator response. The image specifically highlights 'Auto-triggering' (AT), a form of patient-ventilator asynchrony where the ventilator delivers a breath without an antecedent drop in muscular pressure. This is evident where peaks in airway pressure (yellow) and flow (red/orange) occur in the absence of a corresponding green negative deflection. The graph on the right provides a high-resolution view of these cycles, demonstrating the synchronization failure between the patient's intrinsic respiratory drive and the ventilator's trigger sensitivity (set at 1 lpm). This material is intended for advanced clinical education regarding mechanical ventilation monitoring and the identification of asynchronies in restrictive respiratory conditions.
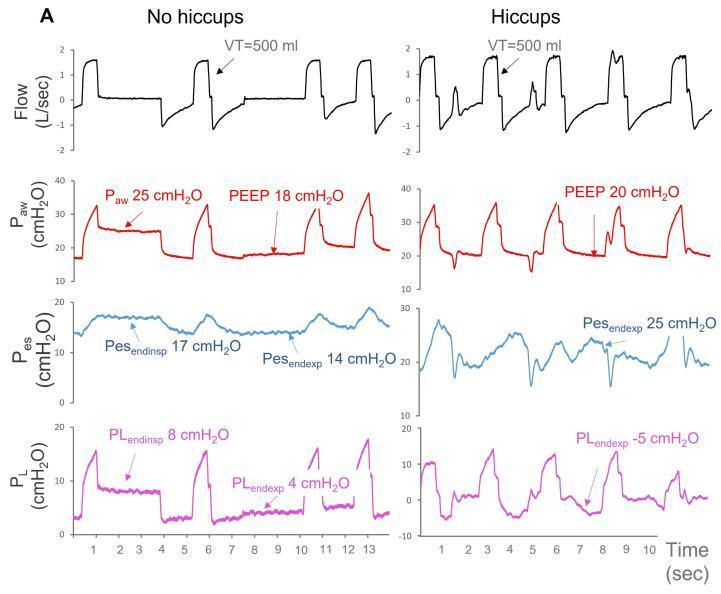
A multi-panel medical diagnostic graphic displaying mechanical ventilation waveforms over time (seconds) in a patient with volume-controlled ventilation (VCV). The image compares two clinical states: 'No hiccups' (left) and 'Hiccups' (right). Four synchronous traces are shown: Flow (L/sec), Airway Pressure (Paw, cmH2O), Esophageal Pressure (Pes, cmH2O), and Transpulmonary Pressure (PL, cmH2O). In the 'No hiccups' state, waveforms show regular patterns with a Paw of 25 cmH2O, PEEP of 18 cmH2O, and positive PL values (PLendinsp 8 cmH2O, PLendexp 4 cmH2O). In the 'Hiccups' state, following an increase in PEEP to 20 cmH2O, the waveforms exhibit significant patient-ventilator asynchrony. Notable features include erratic Pes fluctuations (Pesendexp 25 cmH2O) and sharp, irregular spikes in flow and airway pressure. Critically, the 'Hiccups' panel demonstrates a negative end-expiratory transpulmonary pressure (PLendexp -5 cmH2O), illustrating the physiological impact of involuntary diaphragmatic contractions on lung recruitment and ventilation stability.
pressure volume loop overdistension auto-PEEP ventilator waveform abnormality
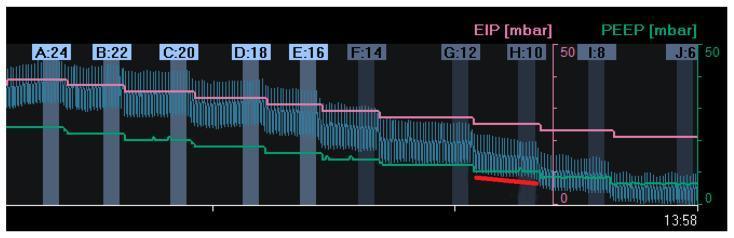
This diagnostic image displays a waveform graph from a decremental Positive End-Expiratory Pressure (PEEP) trial, used in critical care and respiratory medicine to optimize mechanical ventilation. The visualization monitors three primary variables over time, marked from segments A to J: end-inspiratory pressure (EIP, pink line), end-expiratory lung impedance (EELI, green line), and global lung impedance change (blue oscillating waveform). The x-axis represents a stepwise reduction in PEEP from 24 mbar (A) down to 6 mbar (J). A corresponding stepwise decrease is visible in the EIP and EELI, reflecting changes in lung volume. At a PEEP of 10 mbar (H), a red trend line highlights a gradual decline in the EELI waveform, indicating alveolar derecruitment despite constant pressure. This comparison chart is a key tool in Electrical Impedance Tomography (EIT) for identifying the 'best PEEP'—the level that maintains lung recruitment while avoiding overdistension. The educational focus is on identifying the point of lung collapse during ventilator weaning or ARDS management.
This diagnostic graphic displays three stacked ventilator waveforms (Volume, Pressure, and Flow Rate) over a 30-second interval, demonstrating mechanical ventilation in assisted mode. The top graph shows Tidal Volume (Vt) pulsing consistently to approximately 500 mL with a distinct plateau indicating an end-inspiratory hold. The middle Pressure-time waveform illustrates critical respiratory parameters: a negative deflection reaching the trigger pressure (Ptrig) of -2 cmH2O initiates each breath, followed by a rapid rise to a peak inspiratory pressure (Ppeak) of ~25 cmH2O. An inspiratory hold reveals a plateau pressure (Pplateau) of ~22 cmH2O, with the cycle concluding at a positive end-expiratory pressure (PEEP) of ~5 cmH2O. The bottom Flow Rate graph displays corresponding inspiratory and expiratory flow pulses. Annotations mark key temporal points: initial inspiration (Ii), inspiratory hold (Ih), end-inspiration (Ei), and end-expiration (Ef). This visualization is essential for understanding ventilator-patient synchrony, mechanical lung properties (compliance and resistance), and the functioning of pressure-triggered assisted ventilation modes.
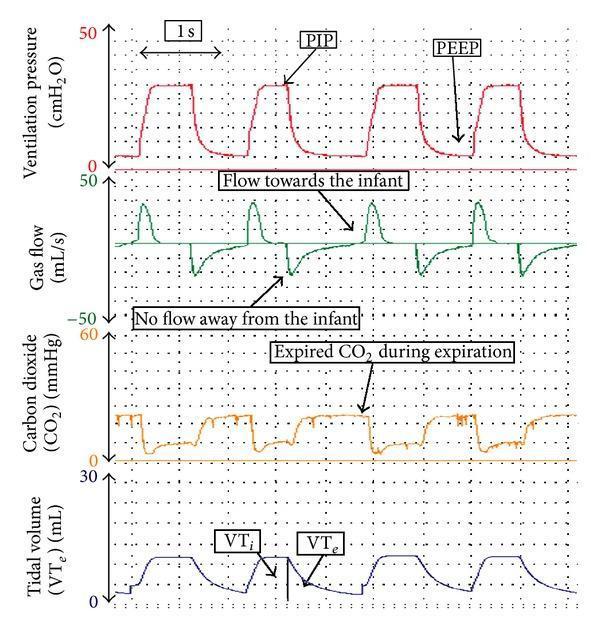
This diagnostic graphic displays synchronous respiratory function monitoring waveforms from a neonatal ventilator. It consists of four vertically stacked temporal traces: ventilation pressure (cmH2O), gas flow (mL/s), carbon dioxide (mmHg), and tidal volume (mL). The top pressure waveform illustrates positive pressure ventilation (PPV), identifying the Peak Inspiratory Pressure (PIP) during inflation and the Positive End-Expiratory Pressure (PEEP) at baseline. The gas flow waveform shows positive deflection during inspiration (flow towards the infant) and negative deflection during expiration (flow away). A capnography trace indicates expired CO2 peaks coinciding with the expiratory phase. The bottom waveform displays Tidal Volume (VT), showing increasing volume during inspiration (VTi) and decreasing volume during expiration (VTe). The return of the VT wave to the baseline without a residual offset indicates the absence of an endotracheal tube leak. This visualization is used in neonatal critical care to monitor lung mechanics, gas exchange efficiency, and circuit integrity during transport or bedside management.
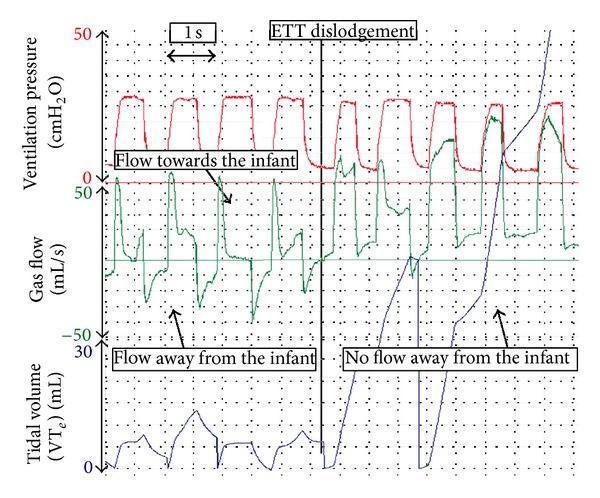
A respiratory function monitor (RFM) graphical display illustrating the effect of accidental endotracheal tube (ETT) dislodgement during neonatal positive pressure ventilation (PPV). The image presents three stacked physiological waveforms over time: Ventilation pressure (cmH2O), Gas flow (mL/s), and Tidal volume (VT in mL). Initially, the waveforms show synchronous ventilation: rhythmic pressure cycles correlate with biphasic gas flow (inspiratory flow toward the infant and expiratory flow away) and consistent tidal volume peaks. A vertical line marks the 'ETT dislodgement' event. Post-dislodgement, while the ventilator continues to provide rhythmic pressure (PIP and PEEP), the gas flow waveform loses its negative deflection (no flow away from the infant), and the tidal volume waveform becomes erratic, losing its cyclical expiratory return to baseline. This illustrates a total leak where air is delivered by the ventilator but fails to reach the lungs or return through the flow sensor, serving as a critical diagnostic indicator for accidental extubation during neonatal intensive care or transport.
A comparison chart consisting of two sets of mechanical ventilation waveforms (pressure-time and flow-time curves) demonstrating different control variables. The upper panel (Ventilator 1) shows characteristics of volume-controlled ventilation, where the pressure curve (red) reaches a peak and then maintains a plateau, while the flow curve (purple) rises instantaneously and remains constant before falling, indicating a square flow waveform. The lower panel (Ventilator 2) illustrates pressure-controlled ventilation. In this mode, the pressure curve (red) rapidly rises to a set level (approximately 15 mbar) and maintains a plateau, while the flow curve (purple) shows a peak followed by a decelerating ramp pattern. Both panels show three respiratory cycles over an approximately 8-second window, with vertical dashed lines marking the start of inspiration. These waveforms are critical for respiratory therapy education to distinguish between volume-preset and pressure-preset mechanical ventilation strategies.
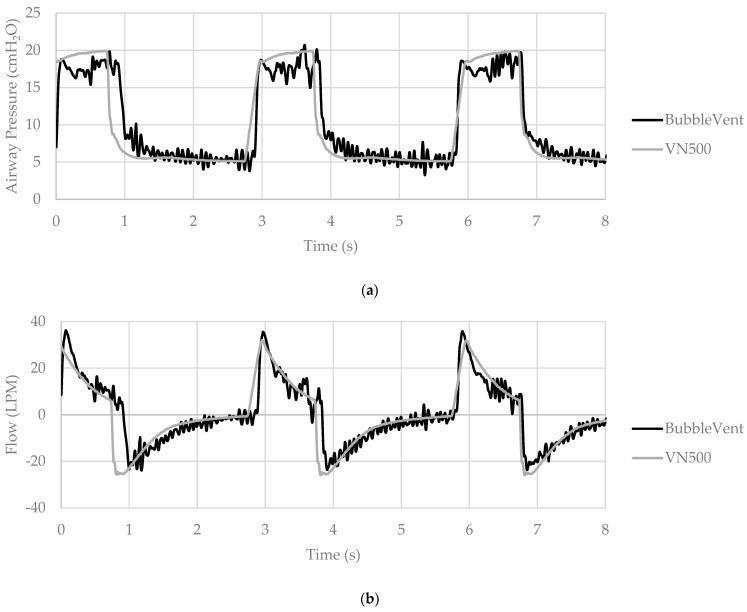
Two comparative waveform tracings (a and b) illustrate mechanical ventilation parameters over an 8-second interval, comparing a BubbleVent prototype (black line) with a Draeger VN500 clinical ventilator (gray line). Graph (a) depicts Airway Pressure (cmH2O) vs. Time (s). It shows periodic breath cycles with a Peak Inspiratory Pressure (PIP) of ~20 cmH2O and Positive End-Expiratory Pressure (PEEP) of ~5 cmH2O. The BubbleVent tracing exhibits characteristic high-frequency oscillations during the plateau and expiratory phases, likely due to gas bubbling through water, whereas the VN500 shows smooth transitions. Graph (b) depicts Inspiratory Flow (LPM) vs. Time (s). The BubbleVent demonstrates a more abrupt, square-like flow pattern reaching peak inspiratory flows of ~35-40 LPM, followed by sharp expiratory transitions to negative flow. The VN500 displays a smoother, more sinusoidal flow profile peaking at ~25 LPM. These waveforms demonstrate the performance of a hydropneumatic pressure-limited intermittent mandatory ventilation (IMV) system compared to standard microprocessor-controlled critical care ventilation in a lung model simulating ARDS conditions.
patient ventilator asynchrony flow waveform bronchospasm secretions air leak
This diagnostic graphic displays mechanical ventilation waveforms from a Hamilton C3 ventilator during Pressure Support Ventilation (PSV 10), illustrating ventilator asynchrony under restrictive lung patterns with air leaks. Two side-by-side time-series graphs plot respiratory parameters: Airway Pressure (Paw, yellow), Delivered Volume (white), Flow (red/orange), and Muscular Pressure (green). The green line represents patient effort (negative deflection indicates inspiration), while the yellow and white lines represent ventilator response. The image specifically highlights 'Auto-triggering' (AT), a form of patient-ventilator asynchrony where the ventilator delivers a breath without an antecedent drop in muscular pressure. This is evident where peaks in airway pressure (yellow) and flow (red/orange) occur in the absence of a corresponding green negative deflection. The graph on the right provides a high-resolution view of these cycles, demonstrating the synchronization failure between the patient's intrinsic respiratory drive and the ventilator's trigger sensitivity (set at 1 lpm). This material is intended for advanced clinical education regarding mechanical ventilation monitoring and the identification of asynchronies in restrictive respiratory conditions.
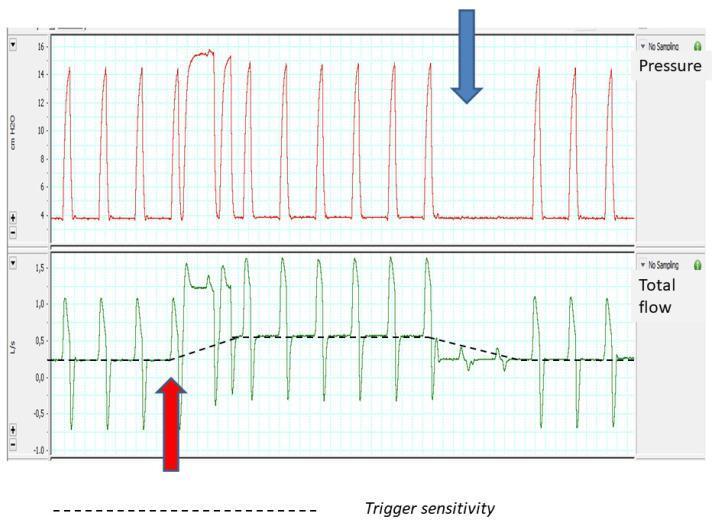
This diagnostic visualization consists of two stacked ventilator waveforms illustrating the impact of air leakage on flow-triggering sensitivity. The upper graph displays Pressure (cm H2O) over time, showing cyclical pressure-supported breaths ranging from approximately 4 to 16 cm H2O. The lower graph displays Total Flow (L/s) over time, with values ranging from -1.0 to 1.5 L/s. A horizontal dashed line superimposed on the flow graph represents the dynamic trigger sensitivity threshold. The red arrow highlights a point where a sudden increase in baseline flow (leakage) causes the ventilator to auto-trigger several breaths until the algorithm adjusts by raising the sensitivity threshold. The blue arrow indicates the withdrawal of the leak, causing a temporary lapse in triggering (ineffective efforts) as the sensitivity threshold gradually resets to the lower baseline. This figure demonstrates the compensatory logic used in non-invasive ventilation (NIV) to maintain synchrony during fluctuating leak conditions.
A respiratory function monitor (RFM) graphical display illustrating the effect of accidental endotracheal tube (ETT) dislodgement during neonatal positive pressure ventilation (PPV). The image presents three stacked physiological waveforms over time: Ventilation pressure (cmH2O), Gas flow (mL/s), and Tidal volume (VT in mL). Initially, the waveforms show synchronous ventilation: rhythmic pressure cycles correlate with biphasic gas flow (inspiratory flow toward the infant and expiratory flow away) and consistent tidal volume peaks. A vertical line marks the 'ETT dislodgement' event. Post-dislodgement, while the ventilator continues to provide rhythmic pressure (PIP and PEEP), the gas flow waveform loses its negative deflection (no flow away from the infant), and the tidal volume waveform becomes erratic, losing its cyclical expiratory return to baseline. This illustrates a total leak where air is delivered by the ventilator but fails to reach the lungs or return through the flow sensor, serving as a critical diagnostic indicator for accidental extubation during neonatal intensive care or transport.
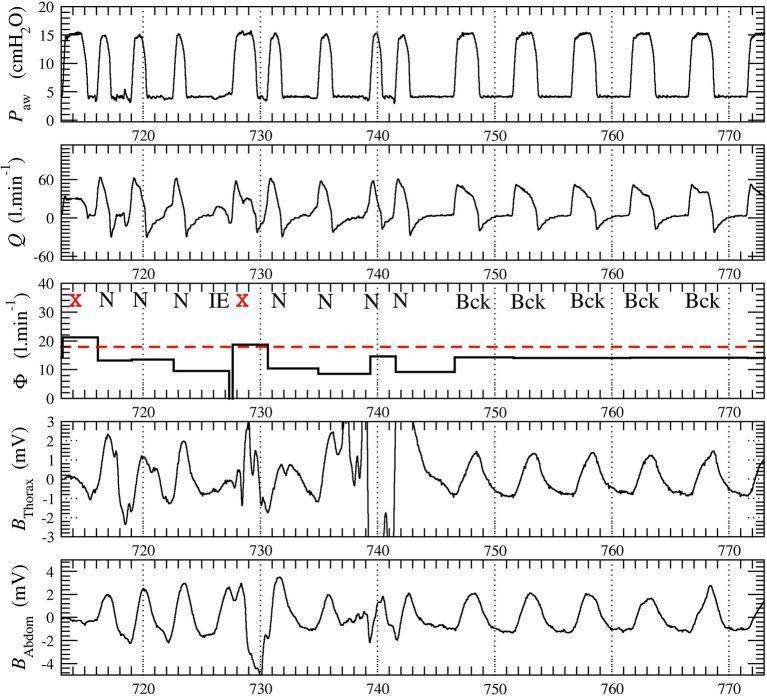
This physiological monitoring waveform chart displays data from a patient receiving non-invasive ventilation (NIV). The display includes five synchronized panels over a 60-second time series (seconds 710 to 775). Top panel: Airway pressure (Paw) measured in cmH2O, showing cyclical ventilatory support peaking at approximately 15 cmH2O. Second panel: Airflow (Q) in l/min, depicting inspiratory and expiratory fluctuations ranging from -30 to 60 l/min. Third panel: Total leakage (Φ) in l/min, shown as a stepwise average per cycle with a red dashed threshold line at 18 l/min; cycles exceeding this (marked with 'X') indicate excessive leakage and turbulent flow. The panel also includes automated event annotations: 'N' (Normal), 'IE' (Ineffective Effort), and 'Bck' (Background/different physiological state). Bottom panels: Thoracic (Bthorax) and abdominal (Babdom) respiratory belt signals in millivolts (mV), demonstrating chest wall and abdominal excursions. These signals are used to assess patient-ventilator synchrony and identify asynchrony events like ineffective efforts or autotriggering. This content is used for educating healthcare providers on ventilator waveform analysis and automated scoring algorithms for patient-ventilator interaction.
This diagnostic graphic displays synchronous respiratory function monitoring waveforms from a neonatal ventilator. It consists of four vertically stacked temporal traces: ventilation pressure (cmH2O), gas flow (mL/s), carbon dioxide (mmHg), and tidal volume (mL). The top pressure waveform illustrates positive pressure ventilation (PPV), identifying the Peak Inspiratory Pressure (PIP) during inflation and the Positive End-Expiratory Pressure (PEEP) at baseline. The gas flow waveform shows positive deflection during inspiration (flow towards the infant) and negative deflection during expiration (flow away). A capnography trace indicates expired CO2 peaks coinciding with the expiratory phase. The bottom waveform displays Tidal Volume (VT), showing increasing volume during inspiration (VTi) and decreasing volume during expiration (VTe). The return of the VT wave to the baseline without a residual offset indicates the absence of an endotracheal tube leak. This visualization is used in neonatal critical care to monitor lung mechanics, gas exchange efficiency, and circuit integrity during transport or bedside management.
flow volume loop sawtooth pattern bronchospasm secretions mechanical ventilation
A comparison chart consisting of two sets of mechanical ventilation waveforms (pressure-time and flow-time curves) demonstrating different control variables. The upper panel (Ventilator 1) shows characteristics of volume-controlled ventilation, where the pressure curve (red) reaches a peak and then maintains a plateau, while the flow curve (purple) rises instantaneously and remains constant before falling, indicating a square flow waveform. The lower panel (Ventilator 2) illustrates pressure-controlled ventilation. In this mode, the pressure curve (red) rapidly rises to a set level (approximately 15 mbar) and maintains a plateau, while the flow curve (purple) shows a peak followed by a decelerating ramp pattern. Both panels show three respiratory cycles over an approximately 8-second window, with vertical dashed lines marking the start of inspiration. These waveforms are critical for respiratory therapy education to distinguish between volume-preset and pressure-preset mechanical ventilation strategies.
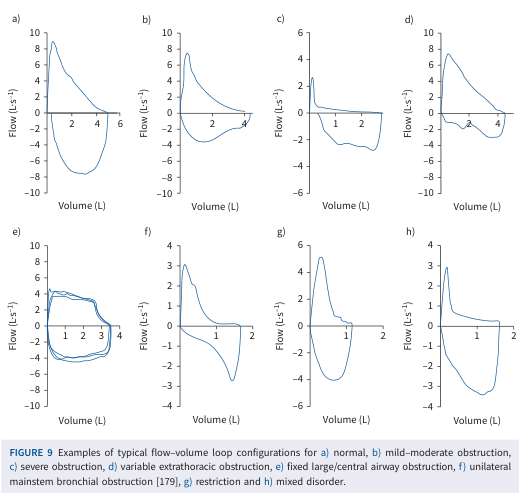
Summary : This figure presents eight typical flow–volume loop configurations, each illustrating a different pattern of pulmonary function abnormality, including normal, obstructive, restrictive, and mixed disorders. flow–volume loop plots: # Title & Axes : • Figure title: "Examples of typical flow–volume loop configurations for a) normal, b) mild–moderate obstruction, c) severe obstruction, d) variable extrathoracic obstruction, e) fixed large/central airway obstruction, f) unilateral mainstem bronchial obstruction, g) restriction and h) mixed disorder." • X-axis: "Volume (L)" with tick labels ranging from 0 to 6 (varies by panel). • Y-axis: "Flow (L·s⁻¹)" with tick labels ranging from -10 to 10 (varies by panel). # Panels & Data Points : • Panel a) Normal: Loop with peak expiratory flow near 10 L·s⁻¹, volume up to ~6 L, smooth descending limb. • Panel b) Mild–moderate obstruction: Lower peak flow (~8 L·s⁻¹), volume up to ~4 L, scooped-out descending limb. • Panel c) Severe obstruction: Peak flow ~6 L·s⁻¹, volume up to ~2.5 L, pronounced scooping and reduced flow. • Panel d) Variable extrathoracic obstruction: Peak flow ~6 L·s⁻¹, volume up to ~4 L, plateau in inspiratory limb. • Panel e) Fixed large/central airway obstruction: Loops with both inspiratory and expiratory plateaus, volume up to ~4 L, flow range -8 to 8 L·s⁻¹. • Panel f) Unilateral mainstem bronchial obstruction: Peak flow ~3 L·s⁻¹, volume up to ~2 L, irregular loop shape. • Panel g) Restriction: Peak flow ~6 L·s⁻¹, volume up to ~2 L, steep and narrow loop. • Panel h) Mixed disorder: Peak flow ~4 L·s⁻¹, volume up to ~2 L, combination of scooping and restriction features. # Design Encodings : • Each panel shows a single blue line representing the flow–volume loop. • Axes are consistent in style, with horizontal and vertical grid lines. • No additional colour or marker encodings. # Distribution & Trends : • Normal loop (a) is tall and broad, with a rapid rise and gradual fall. • Obstructive loops (b, c) show reduced peak flow and scooped-out descending limbs. • Restrictive loop (g) is narrow and steep, with reduced volume. • Fixed obstruction (e) shows plateaus in both inspiratory and expiratory limbs. • Mixed disorder (h) combines features of obstruction and restriction. # Analysis : • The figure visually distinguishes between normal, obstructive, restrictive, and mixed pulmonary function patterns. • Obstructive patterns are characterised by reduced peak flow and scooping; restrictive patterns by reduced volume and steep loops. • Fixed and variable obstructions show plateaus, while mixed disorders combine features. • These loop shapes are diagnostic for different types of airway and lung pathology.
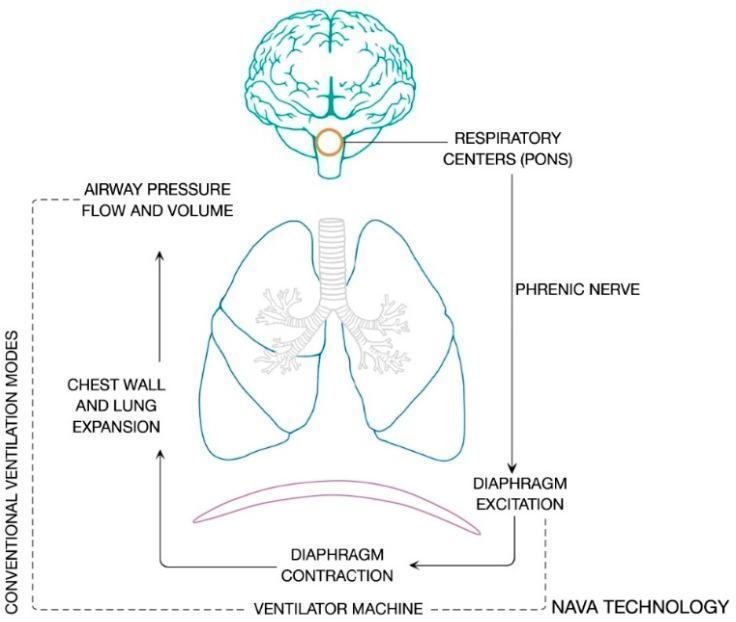
This pathophysiology diagram illustrates the process of neuroventilatory coupling, detailing the pathway from neural drive to mechanical ventilation. At the top, a brain illustration highlights the respiratory centers within the pons as the primary signal origin. An efferent pathway follows the phrenic nerve down to the diaphragm, where it triggers diaphragm excitation and subsequent contraction. This mechanical action leads to chest wall and lung expansion, resulting in measurable changes in airway pressure, flow, and volume. The diagram further incorporates the role of medical technology, showing how a ventilator machine interacts with this loop. It identifies two specific pathways: 'Conventional Ventilation Modes,' which modulate airway pressure, flow, and volume, and 'NAVA Technology' (Neurally Adjusted Ventilatory Assist), which interfaces directly with diaphragm excitation signals. This educational visual provides a comprehensive overview of the physiological drive of breathing and its integration with mechanical ventilatory support, emphasizing the connection between neurological output and respiratory mechanics.
![This Comparison Chart displays synchronized respiratory waveforms over 40 seconds during volume-controlled mechanical ventilation. From top to bottom, the four graphs include: 1) Flow [l/min], showing inspiratory and expiratory phases with zero-flow plateaus during maneuvers. 2) Airway pressure (Paw [cmH2O]), highlighting 'Set PEEP', 'PEEPtot' during an expiratory pause, and 'Airway plateau pressure' and 'Airway driving pressure' during an inspiratory hold. 3) Esophageal pressure (Pes [cmH2O]), used as a surrogate for pleural pressure, showing end-expiratory/end-inspiratory values and minor cardiac artifacts. 4) Transpulmonary pressure (Plung [cmH2O]), calculated as Paw minus Pes, illustrating 'Transpulmonary driving pressure' and 'End-inspiratory transpulmonary pressure'. The visual illustrates critical bedside monitoring for Acute Respiratory Distress Syndrome (ARDS), focusing on lung mechanics, intrinsic PEEP, and the prevention of ventilator-induced lung injury (VILI) by quantifying driving pressures and plateau pressures through hold maneuvers.](https://cdn.orris.care/cdss_images/pmc_clinical_VQA_1099345286f128aad8b7d3b682adc5a15737e3b737170091be774aed96d94975.jpg)
This Comparison Chart displays synchronized respiratory waveforms over 40 seconds during volume-controlled mechanical ventilation. From top to bottom, the four graphs include: 1) Flow [l/min], showing inspiratory and expiratory phases with zero-flow plateaus during maneuvers. 2) Airway pressure (Paw [cmH2O]), highlighting 'Set PEEP', 'PEEPtot' during an expiratory pause, and 'Airway plateau pressure' and 'Airway driving pressure' during an inspiratory hold. 3) Esophageal pressure (Pes [cmH2O]), used as a surrogate for pleural pressure, showing end-expiratory/end-inspiratory values and minor cardiac artifacts. 4) Transpulmonary pressure (Plung [cmH2O]), calculated as Paw minus Pes, illustrating 'Transpulmonary driving pressure' and 'End-inspiratory transpulmonary pressure'. The visual illustrates critical bedside monitoring for Acute Respiratory Distress Syndrome (ARDS), focusing on lung mechanics, intrinsic PEEP, and the prevention of ventilator-induced lung injury (VILI) by quantifying driving pressures and plateau pressures through hold maneuvers.
pressure volume loop beaking bird beak overdistension lower inflection point PEEP
This diagnostic image displays a waveform graph from a decremental Positive End-Expiratory Pressure (PEEP) trial, used in critical care and respiratory medicine to optimize mechanical ventilation. The visualization monitors three primary variables over time, marked from segments A to J: end-inspiratory pressure (EIP, pink line), end-expiratory lung impedance (EELI, green line), and global lung impedance change (blue oscillating waveform). The x-axis represents a stepwise reduction in PEEP from 24 mbar (A) down to 6 mbar (J). A corresponding stepwise decrease is visible in the EIP and EELI, reflecting changes in lung volume. At a PEEP of 10 mbar (H), a red trend line highlights a gradual decline in the EELI waveform, indicating alveolar derecruitment despite constant pressure. This comparison chart is a key tool in Electrical Impedance Tomography (EIT) for identifying the 'best PEEP'—the level that maintains lung recruitment while avoiding overdistension. The educational focus is on identifying the point of lung collapse during ventilator weaning or ARDS management.
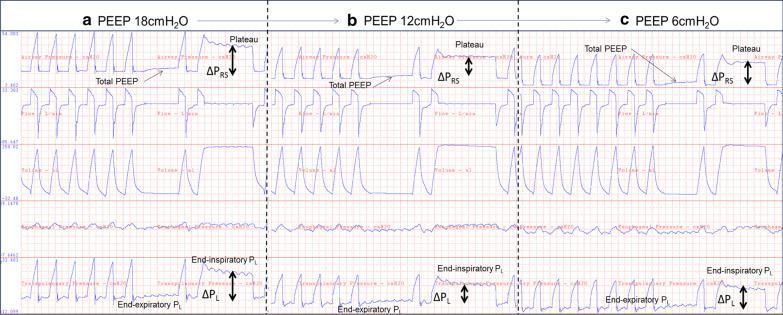
This diagnostic comparison chart displays mechanical ventilation waveforms during a PEEP (positive end-expiratory pressure) titration procedure for a patient with acute respiratory distress syndrome (ARDS). The graphic is divided into three panels representing PEEP levels of 18 cmH2O (a), 12 cmH2O (b), and 6 cmH2O (c). Each panel displays synchronized tracings for Airway Pressure (Pao), Flow, Volume, Esophageal Pressure (Pes), and Transpulmonary Pressure (PL). Key physiological markers identified include Total PEEP, Plateau Pressure, Respiratory System Driving Pressure (ΔPRS), End-expiratory PL, End-inspiratory PL, and Transpulmonary Driving Pressure (ΔPL). The waveforms illustrate the optimization of lung mechanics at 12 cmH2O, where ΔPRS and ΔPL are minimized, and end-expiratory transpulmonary pressure is near zero. Panel (a) shows signs of overdistension with high driving pressures, while panel (c) demonstrates derecruitment as evidenced by a negative end-expiratory PL and increased driving pressures. This visualization highlights the clinical utility of esophageal manometry in tailoring PEEP to manage lung stress and compliance in complex respiratory cases.
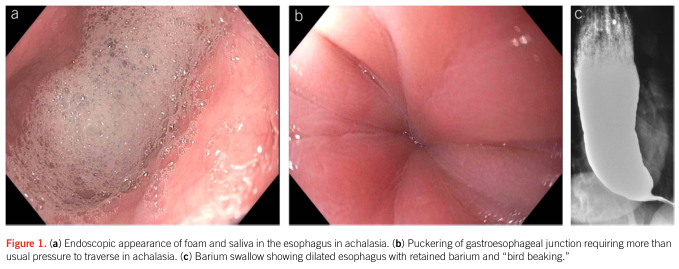
Summary : This figure presents three medical imaging views illustrating features of achalasia in the esophagus: endoscopic foam/saliva accumulation, puckering at the gastroesophageal junction, and a barium swallow radiograph showing classic "bird beak" appearance. photo: # Panel a: Endoscopic foam and saliva in achalasia Scene Overview : • Endoscopic view of the esophageal lumen. • Significant accumulation of foam and saliva coating the mucosal surface. • Pink mucosa visible beneath the frothy layer. Technical Details : • No scale bar or magnification indicated. • Standard endoscopic lighting, no staining. Spatial Relationships : • Foam and saliva occupy the majority of the field, suggesting impaired clearance. # Panel b: Puckering of gastroesophageal junction Scene Overview : • Endoscopic close-up of the gastroesophageal junction. • Mucosa appears puckered and tightly closed. • Pink, healthy-appearing tissue with visible folds. Technical Details : • No scale bar or magnification indicated. • Standard endoscopic lighting. Spatial Relationships : • Junction is centrally located, with folds radiating outward. # Panel c: Barium swallow radiograph ("bird beaking") Scene Overview : • Black-and-white radiograph of the thoracic region. • Esophagus is dilated and filled with retained barium contrast. • Distal esophagus tapers sharply, forming a "bird beak" shape. Technical Details : • No scale bar or magnification indicated. • Barium contrast highlights the esophageal lumen. Spatial Relationships : • Dilated esophagus occupies the majority of the image, with tapering at the lower end. Analysis : • The images collectively demonstrate classic features of achalasia: impaired esophageal clearance (foam/saliva), resistance at the gastroesophageal junction (puckering), and radiographic evidence of esophageal dilation with distal narrowing ("bird beaking"). • These findings visually support the diagnosis and pathophysiology of achalasia, showing both functional and structural changes.
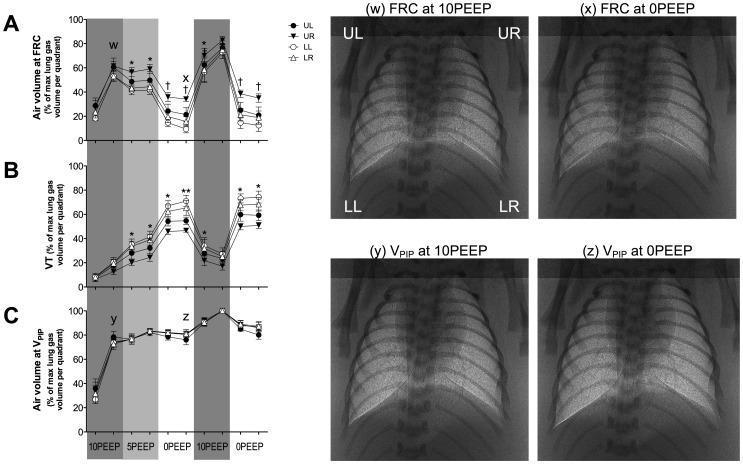
This composite educational graphic illustrates the effects of Positive End-Expiratory Pressure (PEEP) on regional lung aeration and gas volume during neonatal respiratory support. On the left, line graphs (A, B, C) track percentage changes in air volume at Functional Residual Capacity (FRC), Tidal Volume (VT), and Volume at Peak Inflation Pressure (VPIP) across four lung quadrants: Upper Left (UL), Upper Right (UR), Lower Left (LL), and Lower Right (LR). On the right, four phase-contrast X-ray images (w, x, y, z) provide visual comparisons of lung expansion. Images (w) and (x) compare FRC at 10 PEEP versus 0 PEEP, demonstrating that higher PEEP maintains significantly greater radiolucency and alveolar recruitment, particularly in the lower lobes. Images (y) and (z) compare VPIP at 10 PEEP versus 0 PEEP, showing that while peak inflation improves aeration, 0 PEEP (z) results in reduced lung volume and increased radio-opacity compared to the uniform expansion seen at 10 PEEP (y). The data highlights the role of PEEP as an internal splint to prevent atelectasis in compliant neonatal lung tissue.
Ventilator Waveforms & Graphics: Complete Study Guide ⭐⭐⭐⭐⭐
PART 1: THE FIVE WAVEFORMS - WHAT THEY ARE
1. Pressure-Time Curve
- Baseline = set PEEP
- Sharp rise = inspiratory flow
- Peak Inspiratory Pressure (PIP) = highest point (reflects resistance + compliance)
- Plateau Pressure (Pplat) = flat portion after end-inspiratory hold (reflects compliance only)
- Return to PEEP = exhalation
- Driving Pressure = Pplat - PEEP (reflects tidal stress on lung)
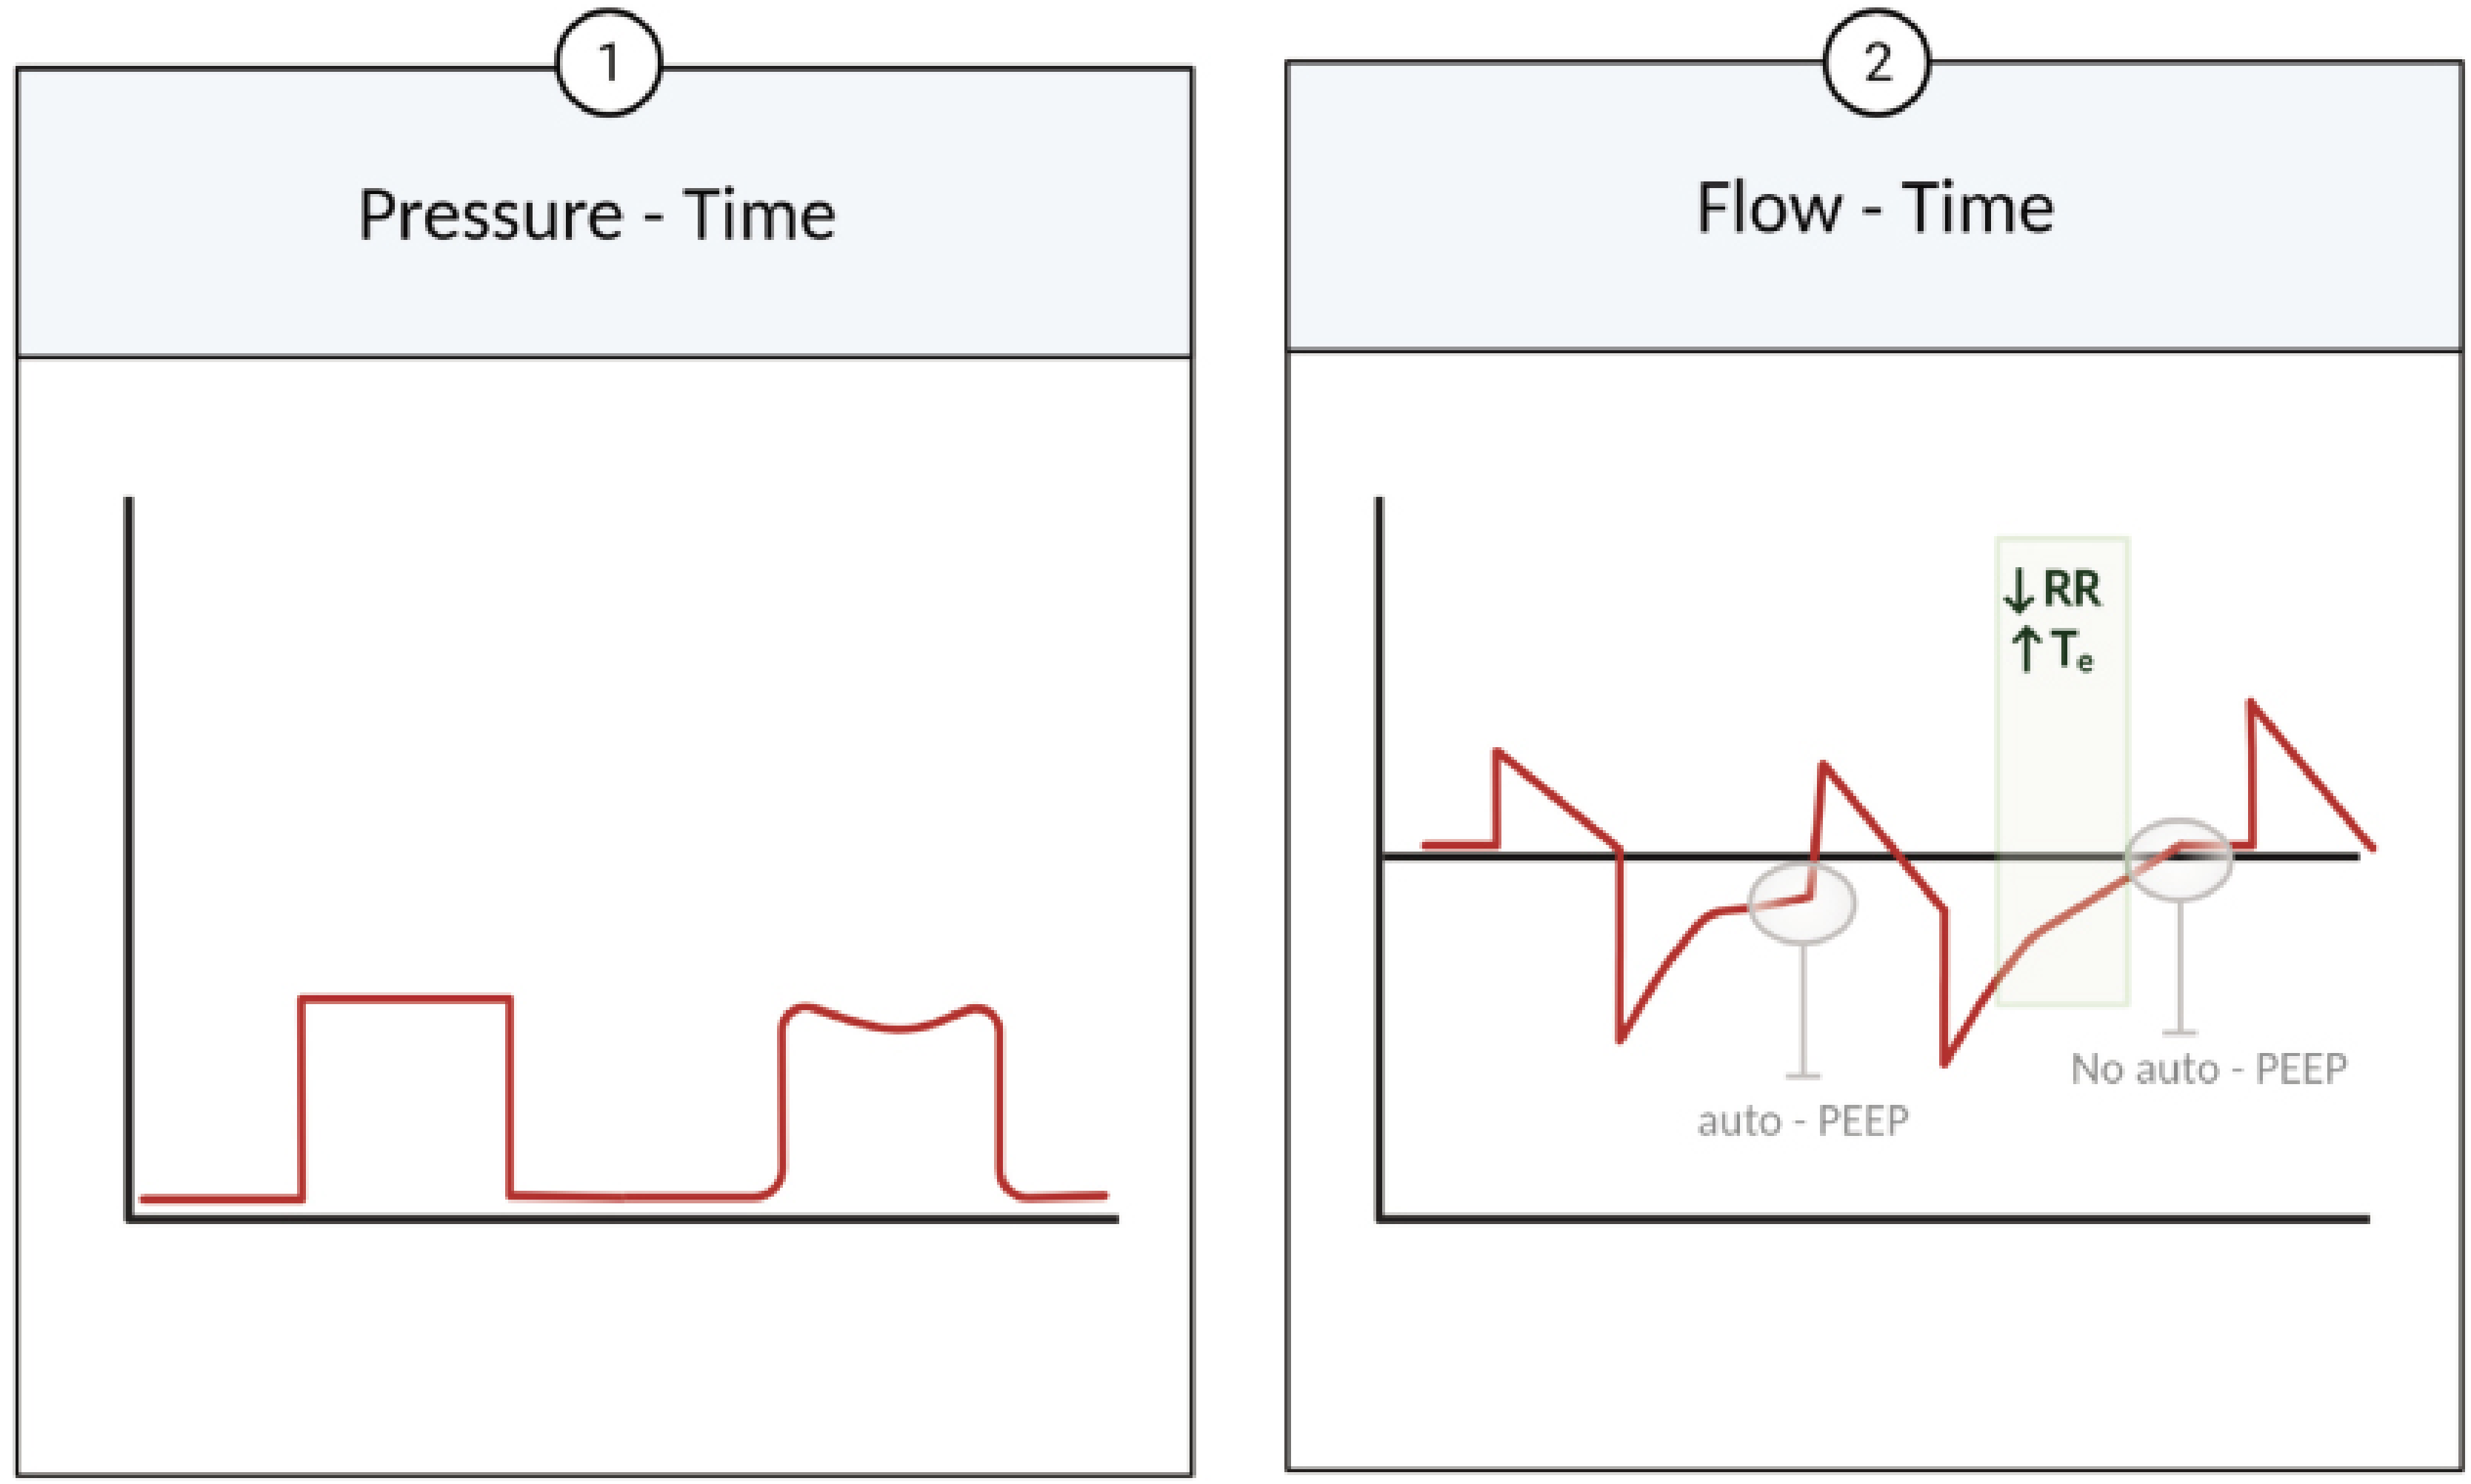
2. Flow-Time Curve
| Mode | Inspiratory Flow Pattern |
|---|---|
| Volume Control (square) | Constant square wave |
| Volume Control (decelerating) | Ramp - peaks then falls |
| Pressure Control | Decelerating ramp (peaks high, falls to near-zero) |
- Normal: Expiratory flow returns to zero baseline before the next breath starts.
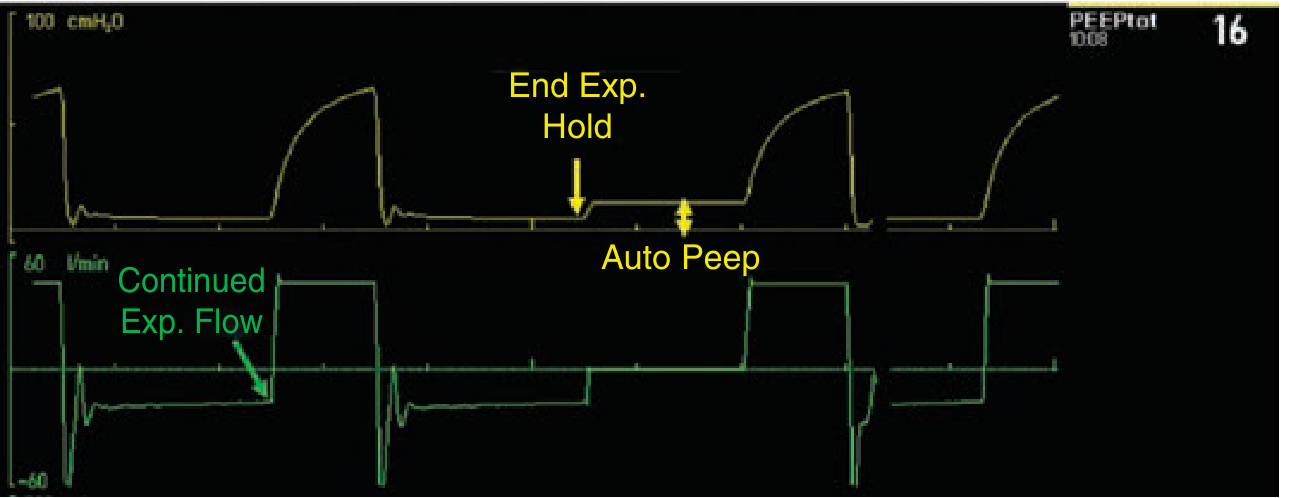
- Auto-PEEP sign: Expiratory flow still above/below zero when next breath is triggered - the patient has NOT finished exhaling.
3. Volume-Time Curve
- Does not return to zero: Air leak (volume delivered > volume exhaled). The gap represents lost volume.
- Slow rise / prolonged inspiration: Airway obstruction limiting flow delivery.
- Sloped or irregular: Circuit disconnect, leak around ETT, bronchopleural fistula.
4. Pressure-Volume (P-V) Loop
- Starts at baseline (set PEEP, zero added volume)
- Inspiration = lower limb (curves rightward-upward as pressure and volume rise)
- Exhalation = upper limb (falls back to baseline via a different path - demonstrating hysteresis)
- The loop is traversed counter-clockwise
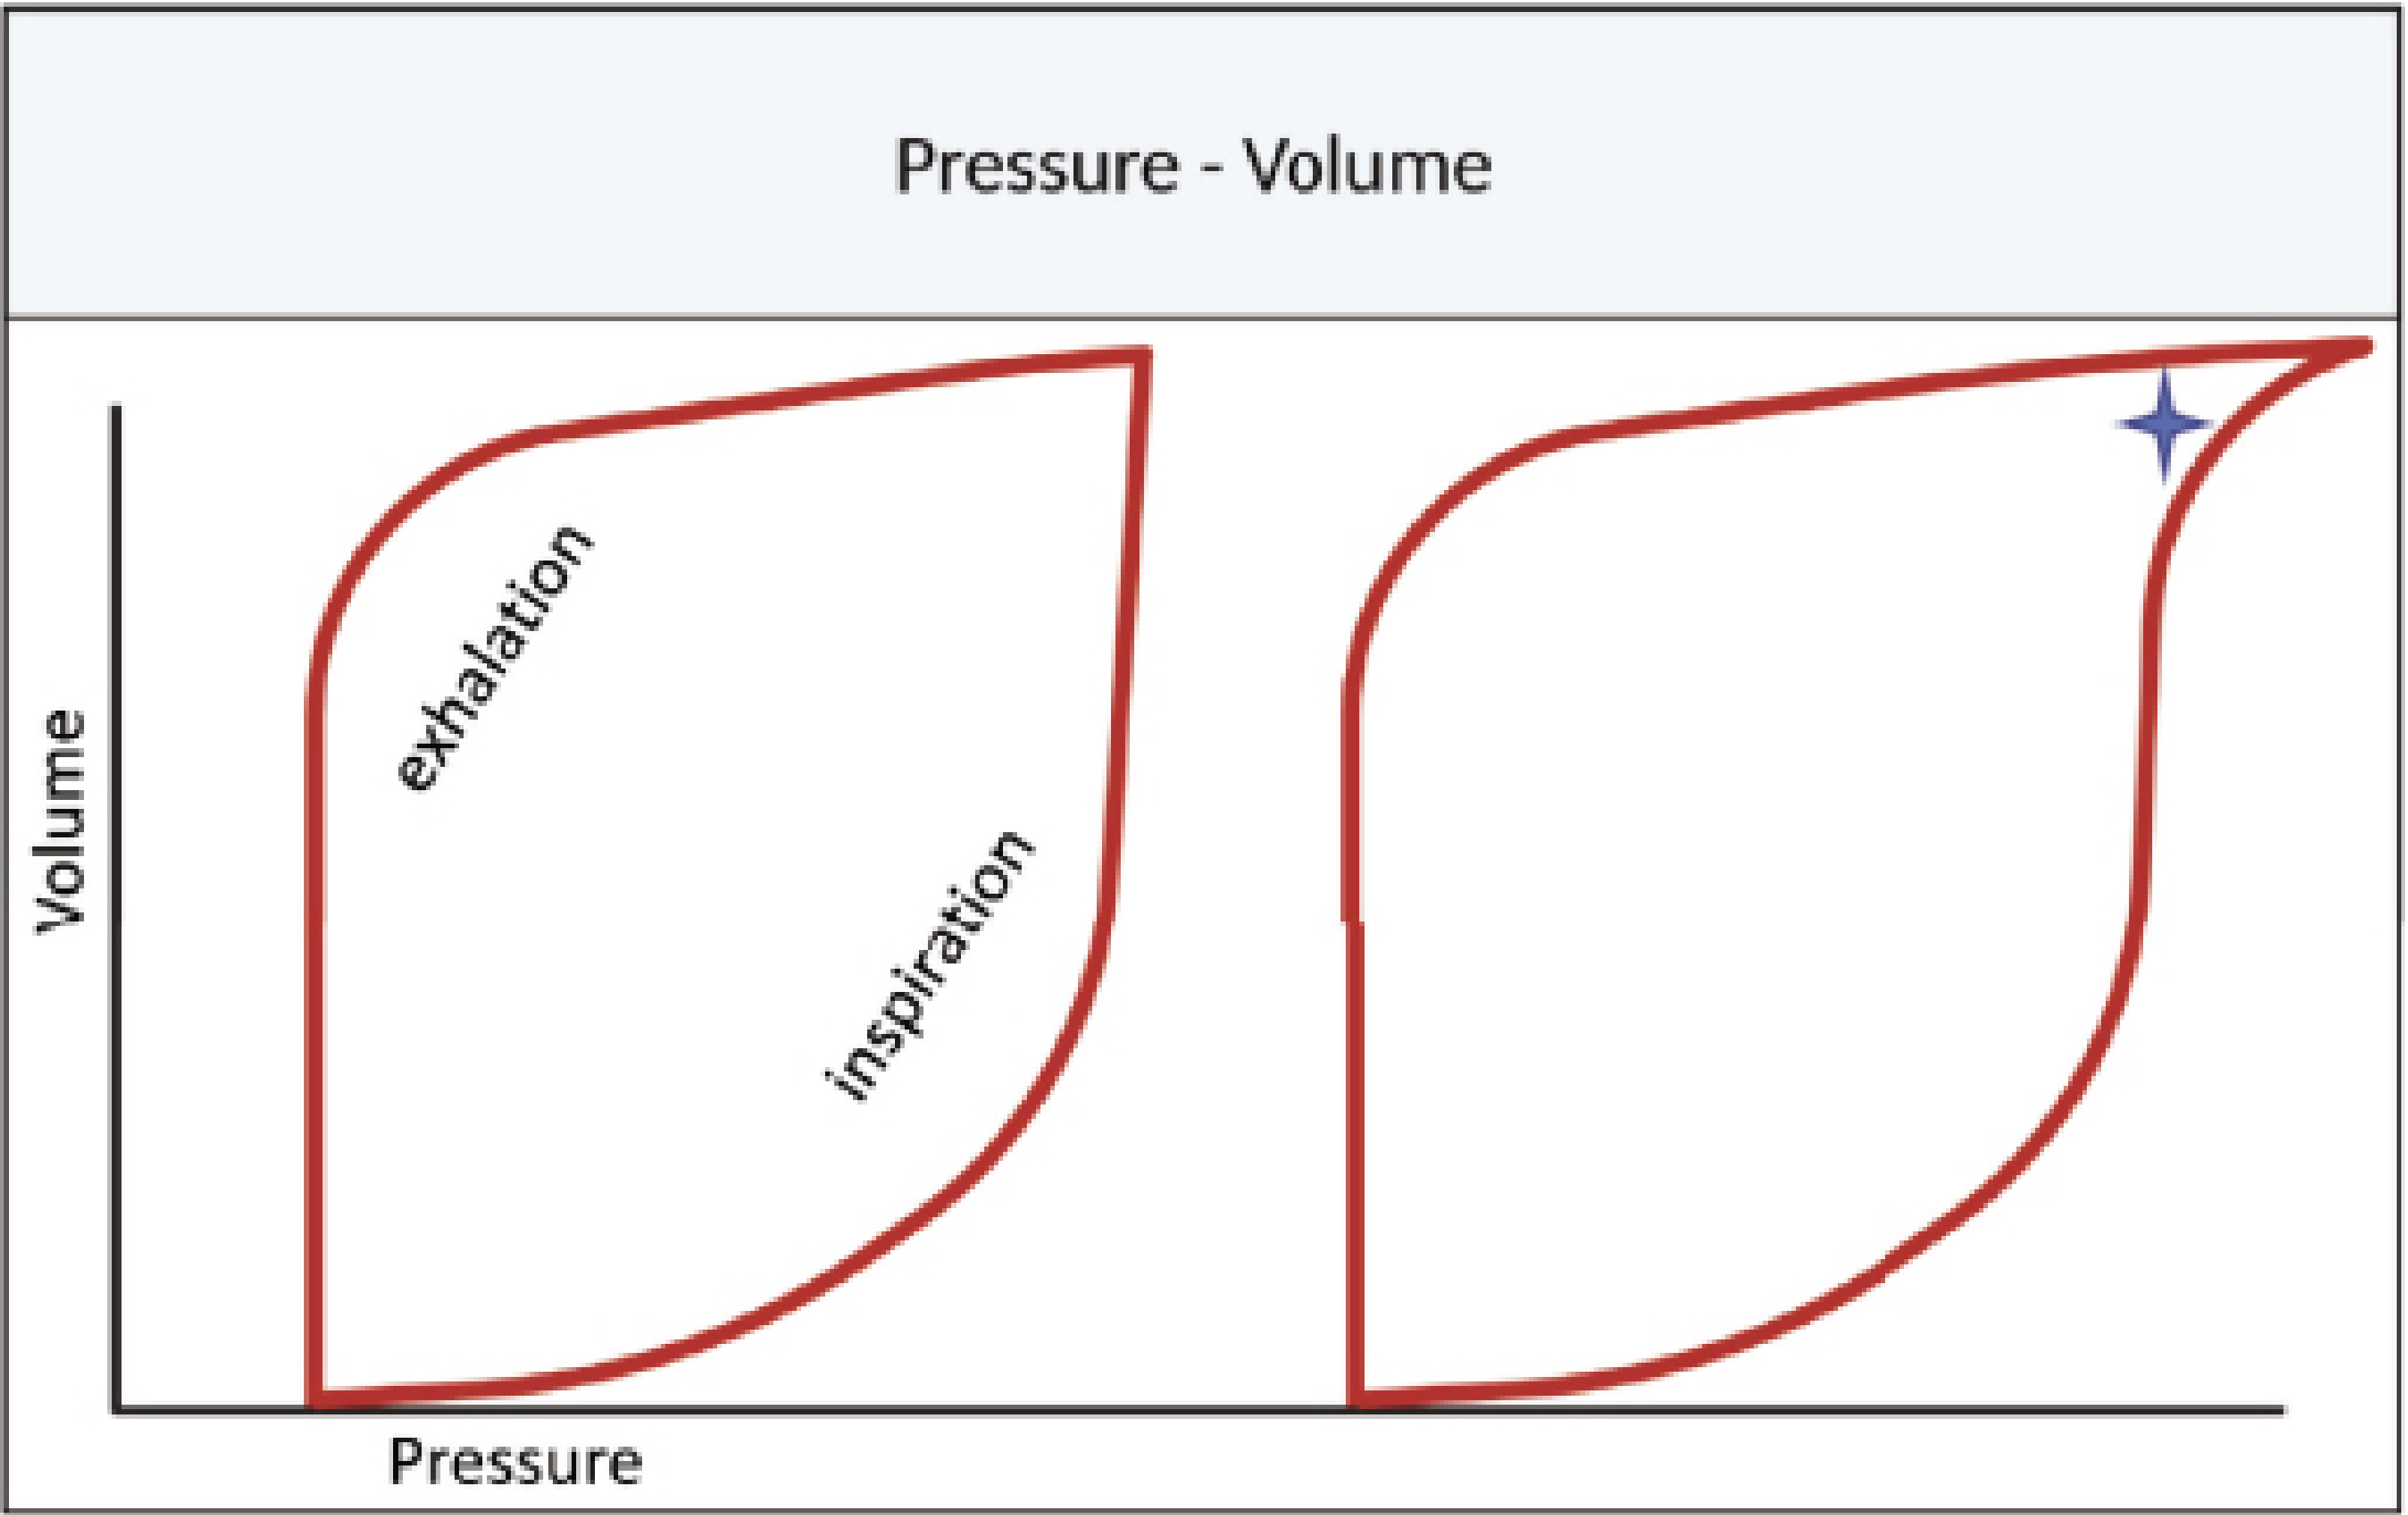
| Feature | Appearance | Meaning |
|---|---|---|
| Lower inflection point (LIP) | "Snap" or kink at start of inspiration | Pressure needed to open collapsed alveoli - PEEP should be set above this |
| Upper inflection point (UIP) / "Bird beak" | Loop hooks rightward at top | Overdistension - reduce VT, PEEP, or driving pressure |
| Increased loop width | Wide loop (much area between limbs) | Increased resistance or work of breathing |
| Loop shifted right | Whole loop displaced right | Decreased compliance (stiffer lungs, e.g. ARDS) |
| Small loop | Narrow, small | High restriction or low tidal volume |
5. Flow-Volume (F-V) Loop
- Positive values = inspiration (upper part)
- Negative values = expiration (lower part)
- Traversed clockwise in mechanically ventilated patients
PART 2: RECOGNIZING PATHOLOGICAL PATTERNS
1. Secretions
- Sawtooth / serrated / "chattering" pattern on both the inspiratory and expiratory flow limbs
- Caused by secretions or mucus vibrating in the airway creating oscillatory airway resistance
- Also visible as irregular spikes on the Pressure-Time curve (irregular rippling)
2. Bronchospasm
3. Air Leak
4. Patient-Ventilator Asynchrony
| Type | Description | Waveform Finding |
|---|---|---|
| Trigger asynchrony - Ineffective effort | Patient makes effort but fails to trigger the ventilator | Pressure-time: small negative deflection at PEEP that does not initiate a breath. Flow-time: brief flow blip with no cycle. |
| Trigger asynchrony - Auto-triggering | Ventilator triggers without patient effort | Pressure shows delivered breath with no preceding patient effort (no P-drop, no esophageal pressure change); occurs with leaks, cardiogenic oscillations, circuit condensation. |
| Flow asynchrony - Flow starvation | Patient's demand exceeds set flow in VCV | Pressure-time: pressure plateau shows a "concave scooping" instead of remaining flat - the patient is actively pulling but flow is inadequate. Fix: increase peak flow or switch to pressure control. |
| Cycling asynchrony - Double triggering | Ventilator delivers two breaths for one patient effort | Two consecutive breaths with very short time between them; second breath often has abnormally large VT. |
| Cycling asynchrony - Premature cycling | Ventilator cycles off while patient still inhaling | Pressure-time shows premature drop to PEEP; patient may re-trigger immediately. |
| Cycling asynchrony - Delayed cycling (Prolonged inspiration) | Ventilator cycles off after patient has stopped inhaling | PSV: patient begins to exhale actively while ventilator still in inspiration - see pressure rise at end of inspiration + patient fighting. |
5. Auto-PEEP (Dynamic Hyperinflation / Intrinsic PEEP)
6. Overdistension
- Reduce tidal volume (target 6 mL/kg IBW)
- Reduce PEEP if excessive
- Correct auto-PEEP (which adds to total distending pressure)
- Reduce inspiratory time
- Reduce pressure target in PCV
PART 3: QUICK RECOGNITION TABLE
| Waveform Finding | Think... |
|---|---|
| Sawtooth / serrations on flow | Secretions (suction!) |
| Scooped expiratory F-V loop + high PIP-Pplat gap | Bronchospasm |
| Volume-time: inspired ≠ expired | Air leak |
| Flow-time: expiratory limb not returning to zero | Auto-PEEP |
| End-expiratory hold: pressure > set PEEP | Auto-PEEP (quantified) |
| P-V loop: "bird beak" at top of inspiration | Overdistension |
| P-V loop: kink at start of inspiration | Under-recruitment / insufficient PEEP |
| Pressure-time: concave plateau in VCV | Flow starvation asynchrony |
| Two consecutive breaths, tiny gap | Double-triggering |
| Pressure negative dip with no triggered breath | Ineffective effort |
| Pressure delivered without patient effort | Auto-triggering |
PART 4: PRESSURE-TIME PATHOLOGY SUMMARY
| Finding | PIP | Pplat | Gradient | Interpretation |
|---|---|---|---|---|
| Normal | <35 | <30 | <5 | No problem |
| High PIP, normal Pplat | ↑ | Normal | ↑↑ | Resistance problem: bronchospasm, secretions, kinked ETT |
| High PIP, high Pplat | ↑ | ↑ | Normal | Compliance problem: ARDS, pneumothorax, pulmonary edema |
| High PIP, high Pplat, Bird Beak on P-V | ↑ | ↑ | Normal | Overdistension |
- Fischer's Mastery of Surgery, 8th ed. - "Essential Waveforms," p. 285-287 (Pressure-time trace, Flow-time trace, P-V loop, F-V loop, auto-PEEP, overdistension)
- Tintinalli's Emergency Medicine, Comprehensive Study Guide - Chapter 29B, p. obstructive lung disease on ventilator, auto-PEEP detection and measurement