
PCOS
"polycystic ovary syndrome"[MeSH Terms] AND management
polycystic ovary syndrome PCOS ultrasound pathophysiology diagram
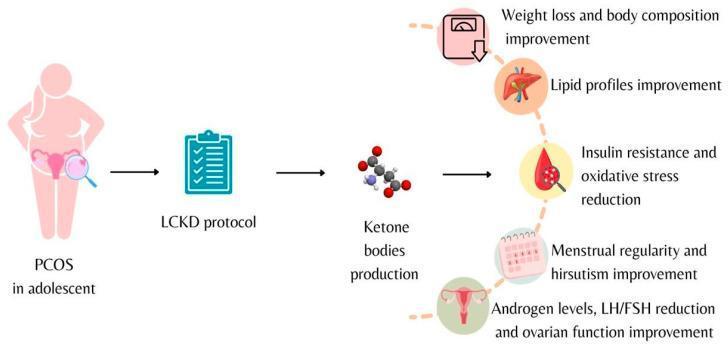
A pathophysiology diagram illustrating the clinical impact of a Low-Calorie Ketogenic Diet (LCKD) protocol on adolescents with Polycystic Ovary Syndrome (PCOS). The schematic follows a linear progression from left to right. It begins with an adolescent figure representing a PCOS diagnosis, highlighting the pelvic region. The next stage depicts the 'LCKD protocol' intervention, which leads to the biochemical phase of 'Ketone bodies production,' represented by a molecular model. The final section branches into multiple physiological benefits, categorized by icons: a scale indicating weight loss and body composition improvement; a liver icon for lipid profile improvement; a blood drop for reduction in insulin resistance and oxidative stress; a calendar for menstrual regularity and hirsutism improvement; and a reproductive system icon for the reduction of androgen levels and LH/FSH ratios, alongside improved ovarian function. This infographic summarizes the multi-systemic metabolic and endocrine benefits of nutritional ketosis in managing PCOS symptoms.
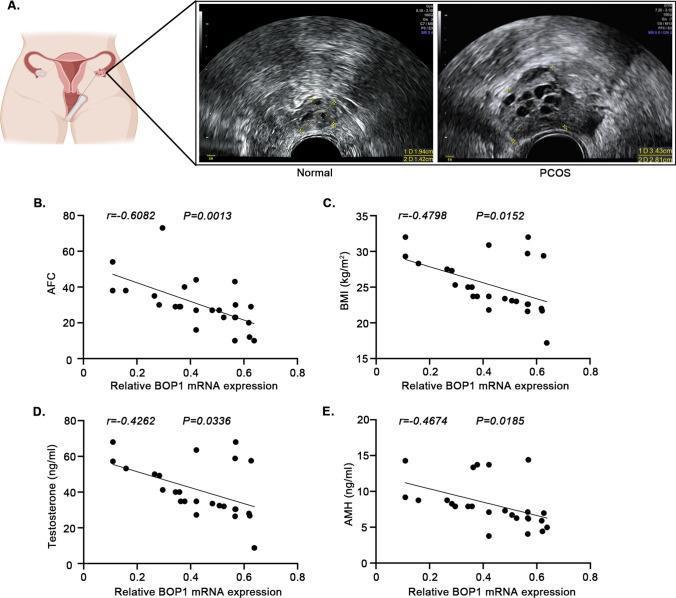
This composite educational graphic illustrates the relationship between BOP1 expression and polycystic ovary syndrome (PCOS). Panel A presents an anatomical diagram of a transvaginal ultrasound procedure alongside two actual ultrasound images comparing a 'Normal' ovary to a 'PCOS' ovary. The PCOS ovary demonstrates classic diagnostic features including enlargement and a 'string of pearls' appearance with multiple peripherally located, small, hypoechoic antral follicles. Panels B through E are scatter plots with linear regression lines showing clinical correlations in PCOS patients. These graphs demonstrate that relative BOP1 mRNA expression in granulosa cells is negatively correlated with four key clinical indicators: Antral Follicle Count (AFC) (r = -0.6082), Body Mass Index (BMI) (r = -0.4798), Serum Testosterone levels (r = -0.4262), and Anti-Müllerian Hormone (AMH) levels (r = -0.4674). All correlations are statistically significant (p < 0.05). This visual data suggests that downregulation of the BOP1 gene is associated with increased severity of PCOS phenotypic markers and hormonal imbalances.
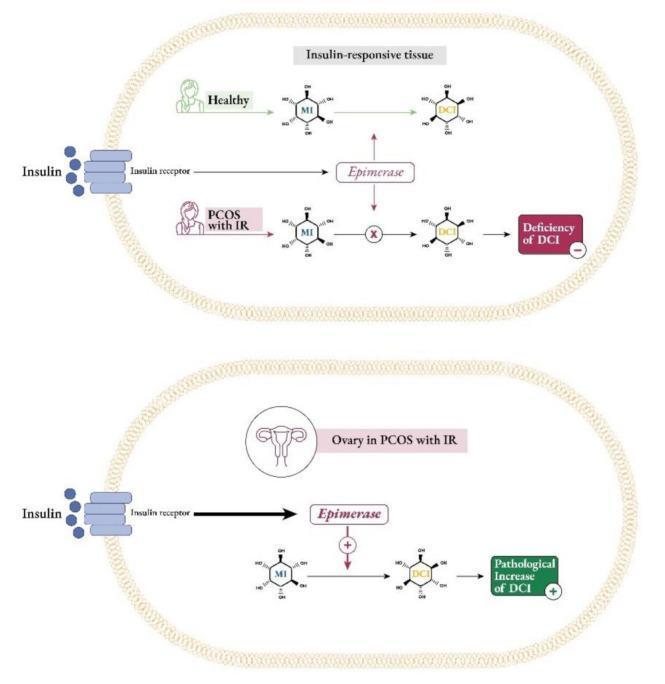
This pathophysiology diagram illustrates the differential regulation of inositol metabolism in classic insulin-responsive tissues versus the ovaries in Polycystic Ovary Syndrome (PCOS) with insulin resistance (IR). The top panel compares healthy and PCOS states in peripheral tissues. In healthy individuals, insulin binding to the insulin receptor activates the epimerase enzyme, facilitating the conversion of myo-inositol (MI) to D-chiro-inositol (DCI). In PCOS with IR, this conversion is blocked (indicated by an 'X'), leading to a 'Deficiency of DCI'. The bottom panel depicts the 'ovarian paradox'. In the ovary of a patient with PCOS and IR, hyperinsulinemia overstimulates the insulin receptor and the epimerase enzyme (indicated by a plus sign and thick arrows). This overactivity causes an excessive conversion of MI to DCI, resulting in a 'Pathological Increase of DCI'. The diagram uses chemical structures for MI and DCI and flow-based signaling pathways to explain how metabolic dysregulation in PCOS leads to tissue-specific inositol imbalances, contributing to endocrine dysfunction.
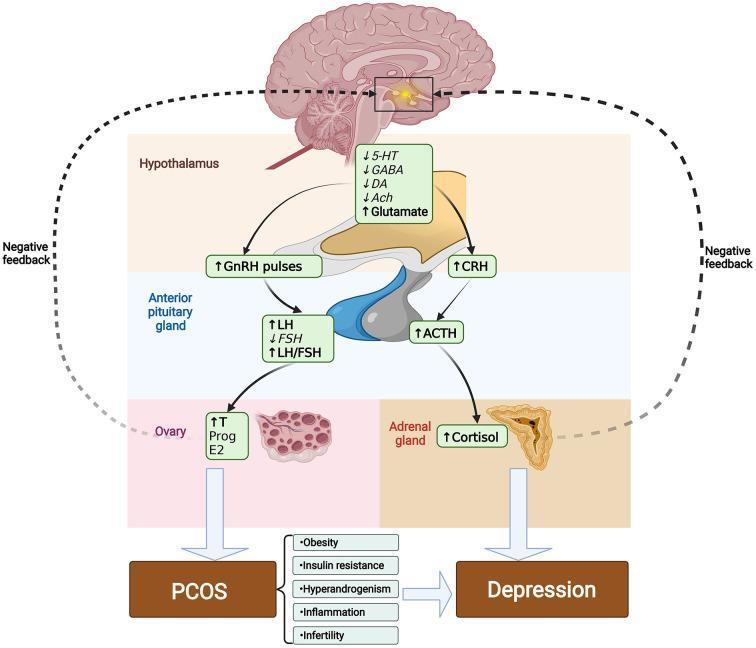
This pathophysiology diagram illustrates the neuroendocrine pathways linking the Hypothalamic-Pituitary-Gonadal (HPG) and Hypothalamic-Pituitary-Adrenal (HPA) axes in the context of Polycystic Ovary Syndrome (PCOS) and depression. The diagram shows a sagittal brain section highlighting the hypothalamus, where a decrease in inhibitory neurotransmitters (5-HT, GABA, DA, Ach) and an increase in glutamate lead to elevated GnRH pulses and CRH levels. This stimulates the anterior pituitary gland to increase LH secretion and the LH/FSH ratio, while simultaneously increasing ACTH. These hormonal shifts trigger the ovary to produce excessive testosterone (T) and estradiol (E2), and the adrenal gland to overproduce cortisol. The cascade culminates in clinical PCOS and depression, exacerbated by common pathological traits including obesity, insulin resistance, hyperandrogenism, inflammation, and infertility. Arrows indicate stimulatory pathways, while dashed lines represent disrupted negative feedback loops, providing a visual summary of hormonal dysregulation in gynecological and psychiatric co-morbidity.
PCOS hormonal pathophysiology LH FSH hyperandrogenism insulin resistance
This pathophysiology diagram illustrates the neuroendocrine pathways linking the Hypothalamic-Pituitary-Gonadal (HPG) and Hypothalamic-Pituitary-Adrenal (HPA) axes in the context of Polycystic Ovary Syndrome (PCOS) and depression. The diagram shows a sagittal brain section highlighting the hypothalamus, where a decrease in inhibitory neurotransmitters (5-HT, GABA, DA, Ach) and an increase in glutamate lead to elevated GnRH pulses and CRH levels. This stimulates the anterior pituitary gland to increase LH secretion and the LH/FSH ratio, while simultaneously increasing ACTH. These hormonal shifts trigger the ovary to produce excessive testosterone (T) and estradiol (E2), and the adrenal gland to overproduce cortisol. The cascade culminates in clinical PCOS and depression, exacerbated by common pathological traits including obesity, insulin resistance, hyperandrogenism, inflammation, and infertility. Arrows indicate stimulatory pathways, while dashed lines represent disrupted negative feedback loops, providing a visual summary of hormonal dysregulation in gynecological and psychiatric co-morbidity.
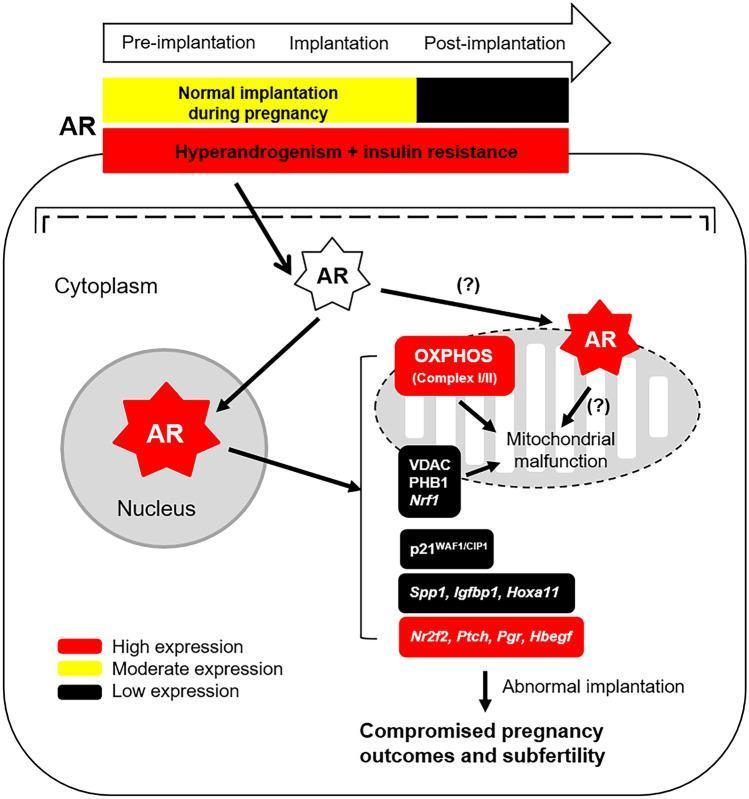
This pathophysiology diagram illustrates the dysregulation of the Androgen Receptor (AR) signaling pathway in the gravid uterus under conditions of hyperandrogenism and insulin resistance. A temporal comparison at the top shows that in normal pregnancy, AR expression transitions from moderate (yellow) during pre-implantation and implantation to low (black) post-implantation. In contrast, hyperandrogenism + insulin resistance maintains sustained high (red) AR expression across all stages. The cellular model depicts high AR expression (red star symbols) localized within the nucleus, cytoplasm, and mitochondrion. Nuclear AR translocation affects the transcription of implantation-related genes, including p21WAF1/CIP1, Spp1, Igfbp1, and Hoxa11, as well as Nr2f2, Ptch, Pgr, and Hbegf. Concurrently, mitochondrial AR localization and interaction with OXPHOS (Complex I/III), VDAC, PHB1, and Nrf1 contribute to mitochondrial malfunction. These combined molecular disturbances lead to abnormal implantation, compromised pregnancy outcomes, and subfertility, modeling mechanisms often associated with Polycystic Ovary Syndrome (PCOS).
A pathophysiology diagram illustrating the clinical impact of a Low-Calorie Ketogenic Diet (LCKD) protocol on adolescents with Polycystic Ovary Syndrome (PCOS). The schematic follows a linear progression from left to right. It begins with an adolescent figure representing a PCOS diagnosis, highlighting the pelvic region. The next stage depicts the 'LCKD protocol' intervention, which leads to the biochemical phase of 'Ketone bodies production,' represented by a molecular model. The final section branches into multiple physiological benefits, categorized by icons: a scale indicating weight loss and body composition improvement; a liver icon for lipid profile improvement; a blood drop for reduction in insulin resistance and oxidative stress; a calendar for menstrual regularity and hirsutism improvement; and a reproductive system icon for the reduction of androgen levels and LH/FSH ratios, alongside improved ovarian function. This infographic summarizes the multi-systemic metabolic and endocrine benefits of nutritional ketosis in managing PCOS symptoms.
Polycystic Ovary Syndrome (PCOS)
Definition & Diagnostic Criteria (Rotterdam 2003, Updated 2023)
| Criterion | Detail |
|---|---|
| Oligo/Anovulation | <9 periods/year, or cycles >40 days apart |
| Hyperandrogenism | Clinical (hirsutism, acne, alopecia) OR biochemical (elevated total/free testosterone; mFG score ≥4-6 depending on ethnicity) |
| Polycystic ovaries on ultrasound | ≥20 antral follicles OR ovarian volume ≥10 cm³ in at least one ovary; OR elevated AMH |
- Hypothyroidism
- Hyperprolactinemia
- Congenital adrenal hyperplasia
- Cushing syndrome
- Androgen-secreting tumors
Pathophysiology
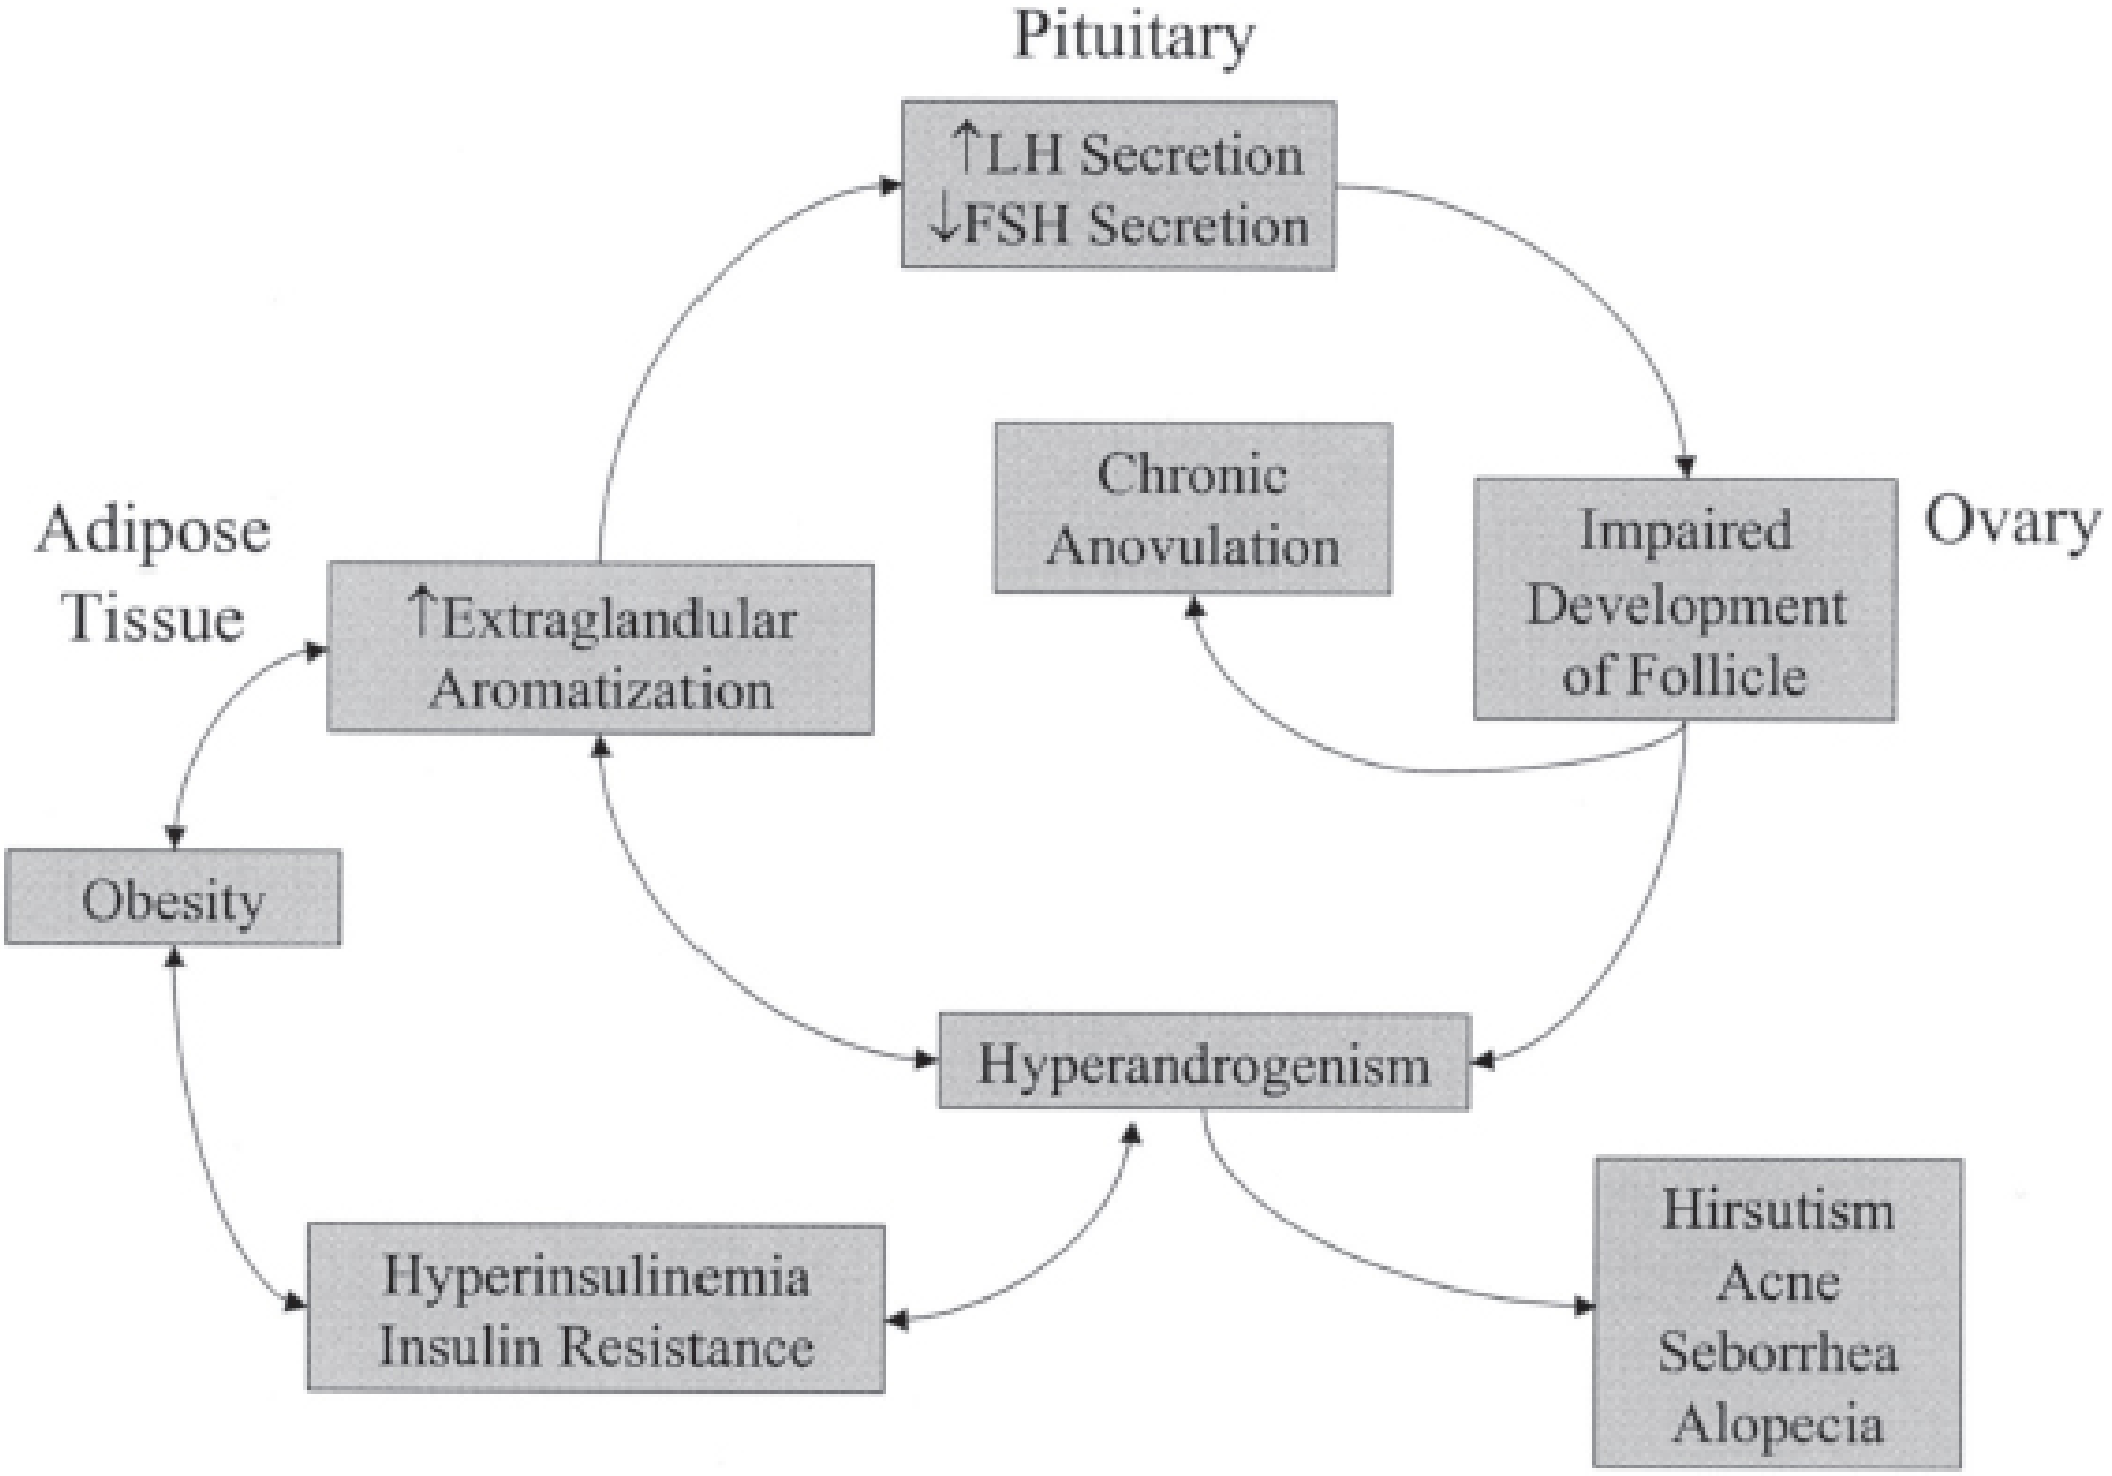
Key Mechanisms:
-
GnRH/HPG Axis Dysregulation
- GnRH becomes insensitive to ovarian steroid negative feedback
- Increased LH pulse amplitude and frequency → elevated LH:FSH ratio
- High LH → excess thecal cell androgen synthesis
- Low FSH → impaired granulosa cell aromatase activity → less estrogen, more androgens → follicular arrest
-
Insulin Resistance & Hyperinsulinemia
- Insulin sensitivity is reduced by 35-40% in PCOS patients, independent of obesity
- Hyperinsulinemia directly stimulates ovarian androgen production
- Insulin also reduces hepatic SHBG synthesis, increasing free androgens
- ~50% of PCOS patients are obese; obesity further amplifies insulin resistance
-
Extraglandular Aromatization
- Adipose tissue converts androgens to estrogens
- This persistent estrogen stimulates further LH secretion, perpetuating the cycle
-
Inositol Dysregulation (emerging mechanism)
- In peripheral tissues: insulin resistance blocks myo-inositol (MI) to D-chiro-inositol (DCI) conversion
- In the ovary: paradoxically, overactive epimerase causes excess DCI, impairing oocyte quality
- Kaplan & Sadock's Comprehensive Textbook of Psychiatry; Berek & Novak's Gynecology
Clinical Features
Reproductive/Menstrual
- Oligomenorrhea or amenorrhea
- Infertility (chronic anovulation)
- Increased risk of endometrial hyperplasia and endometrial cancer (2-6x increased risk due to unopposed estrogen)
Hyperandrogenic (Cutaneous)
- Hirsutism - coarse hair on chin, upper lip, periareolar area (male distribution)
- Acne
- Seborrhea
- Male-pattern alopecia (androgenic alopecia)
Metabolic
- Obesity (affects 20-80% of patients; BMI >25 or >30)
- Metabolic syndrome
- Type 2 diabetes / impaired glucose tolerance
- Dyslipidemia
- Hypertension, cardiovascular disease risk
Other Comorbidities
- Obstructive sleep apnea (increased independently of BMI)
- Metabolic dysfunction-associated steatotic liver disease (MASLD) - independent of BMI
- Depression and anxiety (high prevalence)
- Disordered eating and body image distress
- In pregnancy: early miscarriage, gestational diabetes, gestational hypertension, preeclampsia, preterm birth
Investigations
- Elevated LH; low-normal FSH → elevated LH:FSH ratio (characteristic but not part of diagnostic criteria due to LH pulsatility)
- Elevated total or free testosterone
- Elevated DHEAS (reflects adrenal contribution)
- Elevated AMH (marker of antral follicle count; also correlates with ovulation induction resistance)
- Low SHBG
- Fasting glucose / HbA1c (screen for diabetes)
- Fasting lipid profile (overweight/obese patients)
- Blood pressure
- Screen for depression and anxiety
Management
1. Lifestyle Modification (all patients)
- First-line for all PCOS patients, regardless of weight
- Weight loss of just 5-7% over 6 months can significantly reduce free testosterone, restore ovulation, and improve fertility in >75% of women
- Exercise targeting large muscle groups (e.g., thighs) reduces insulin resistance
2. Menstrual Regulation & Endometrial Protection (not seeking pregnancy)
- Suppress LH → reduce ovarian androgen production
- Increase hepatic SHBG → reduce free testosterone
- Reduce DHEAS independently of LH/SHBG effects
- Decrease conversion of testosterone to DHT in the skin
- Improve hirsutism in ~2/3 of patients; effects on acne/hirsutism take >6 months
- Antiandrogens: Spironolactone, cyproterone acetate, flutamide
- Progestins alone (for endometrial protection): medroxyprogesterone acetate 10 mg or progesterone 200 mg for 10-14 days every ≥3 months; or levonorgestrel IUD
3. Ovulation Induction (seeking pregnancy)
| Agent | Role |
|---|---|
| Letrozole (aromatase inhibitor) | First-line for ovulation induction; superior to clomiphene for live birth rates in anovulatory PCOS |
| Clomiphene citrate | Second-line SERM; associated with thinner endometrial lining |
| Metformin | Improves ovulation rates; combination with letrozole comparable to gonadotropins in clomiphene-resistant PCOS |
| Injectable gonadotropins | Used cautiously; PCOS carries increased risk of ovarian hyperstimulation syndrome (OHSS) |
| IVF | For cases resistant to above |
4. Insulin Sensitizers
- Mechanism: inhibits hepatic glucose output, enhances peripheral glucose uptake
- Indicated for: cardiometabolic risk reduction in overweight/obese PCOS; adjunct to ovulation induction; diabetes/impaired glucose tolerance
- Improves ovulation rates; combination with lifestyle interventions lowers BMI and improves menstruation
- Not recommended as monotherapy for endometrial protection, hyperandrogenic symptoms, infertility, pregnancy loss, or gestational diabetes prevention
5. Emerging/Recent Evidence
- GLP-1 receptor agonists (e.g., semaglutide, liraglutide): a 2024 meta-analysis found these agents promote significant weight loss and hormonal regulation in obese women with PCOS
- Probiotics/synbiotics: a 2024 systematic review showed benefit in managing insulin resistance and hormonal imbalance
- Lifestyle interventions: a 2025 systematic review confirms lifestyle modification as cornerstone of PCOS management with multi-system benefits
Genetics
PCOS & Mental Health
- High prevalence of depression and anxiety disorders
- Disordered eating and body image distress
- The neurobiological link involves reduced inhibitory neurotransmitters (5-HT, GABA, dopamine) → elevated GnRH pulsatility → elevated LH and androgens → depression and PCOS reinforce each other