

Interpretation
ventricular tachycardia ECG wide complex tachycardia 12 lead
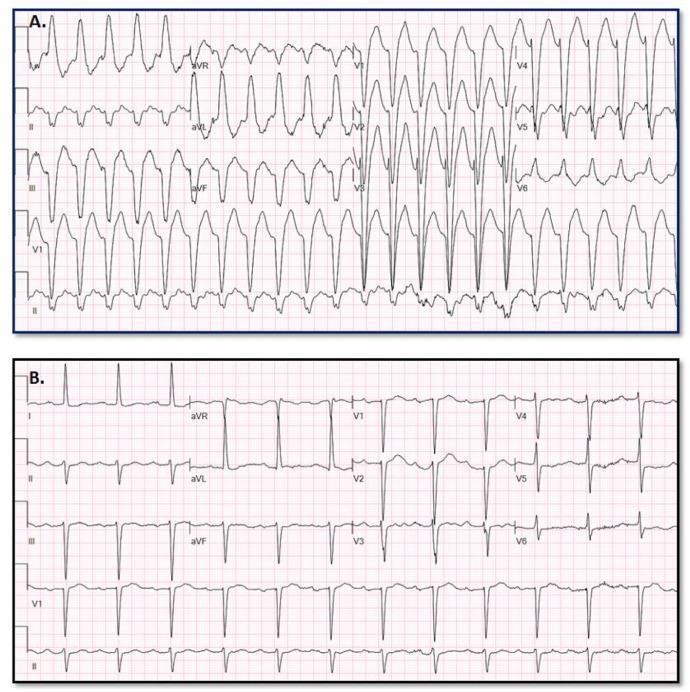
This diagnostic comparison image shows two 12-lead electrocardiograms (ECGs) used to illustrate the differentiation between Wide Complex Tachycardia (WCT) and baseline rhythms. Panel A displays a Wide Complex Tachycardia characterized by a rapid ventricular rate and significantly widened QRS complexes (approximately 170 ms). The morphology is relatively uniform with prominent S-waves in the precordial leads and notable baseline artifact. Panel B shows the patient's baseline ECG, presenting a narrow QRS complex rhythm with visible P-waves preceding each QRS, consistent with sinus rhythm or a supraventricular origin. The comparison highlights clinical diagnostic challenges where Supraventricular Tachycardia (SWCT) with aberrancy may mimic Ventricular Tachycardia (VT). This material is intended for advanced medical education in cardiology and electrophysiology, specifically focusing on ECG interpretation and the application of predictive models for arrhythmia classification.
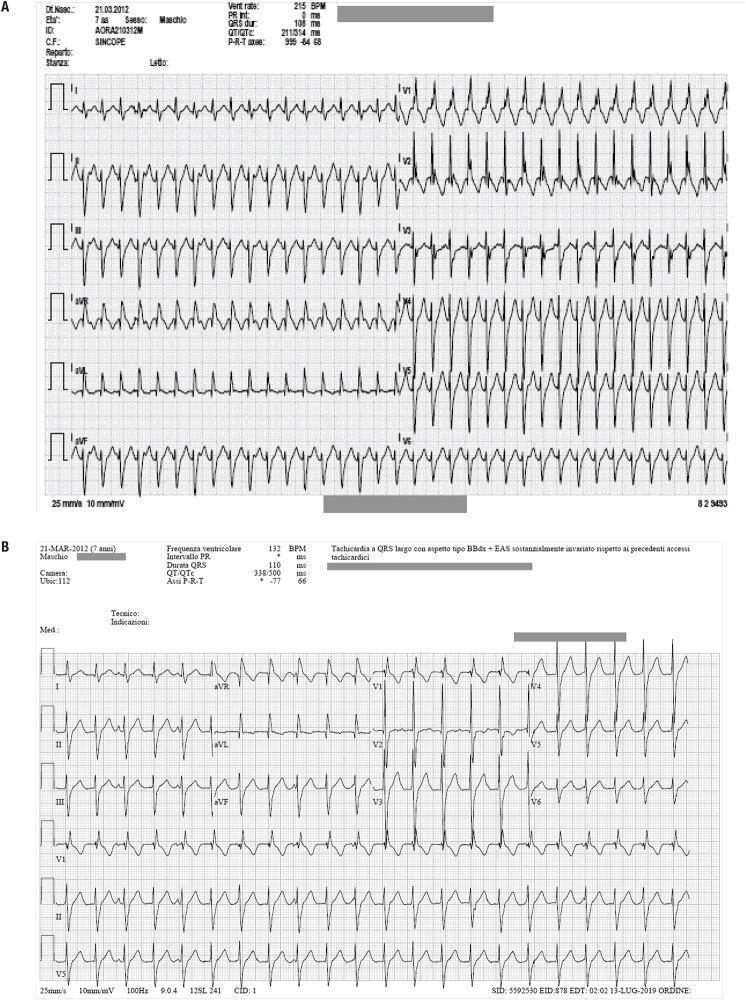
Two diagnostic 12-lead electrocardiogram (ECG) tracings (labeled A and B) from a 7-year-old male patient showing wide-complex tachyarrhythmias. Figure 1A demonstrates a regular, wide QRS tachycardia at a rate of approximately 215 BPM. The morphology exhibits features consistent with a right bundle branch block (RBBB) pattern and a superior axis, suggestive of left anterior fascicular block. Figure 1B shows a subsequent episode of wide-complex tachycardia at a slower rate of 132 BPM, maintaining the RBBB-like morphology and superior QRS axis deviation. Key diagnostic parameters provided in the ECG headers include a QRS duration of 110 ms in Figure 1B and a markedly shifted P-R-T axis between the two recordings. Both tracings represent ventricular fascicular tachycardia (VFT), a specific type of idiopathic ventricular tachycardia often characterized by a RBBB pattern and axis deviation. The images serve as educational materials for distinguishing fascicular ventricular tachycardia from other forms of supraventricular or ventricular arrhythmias based on QRS morphology, axis, and rate.
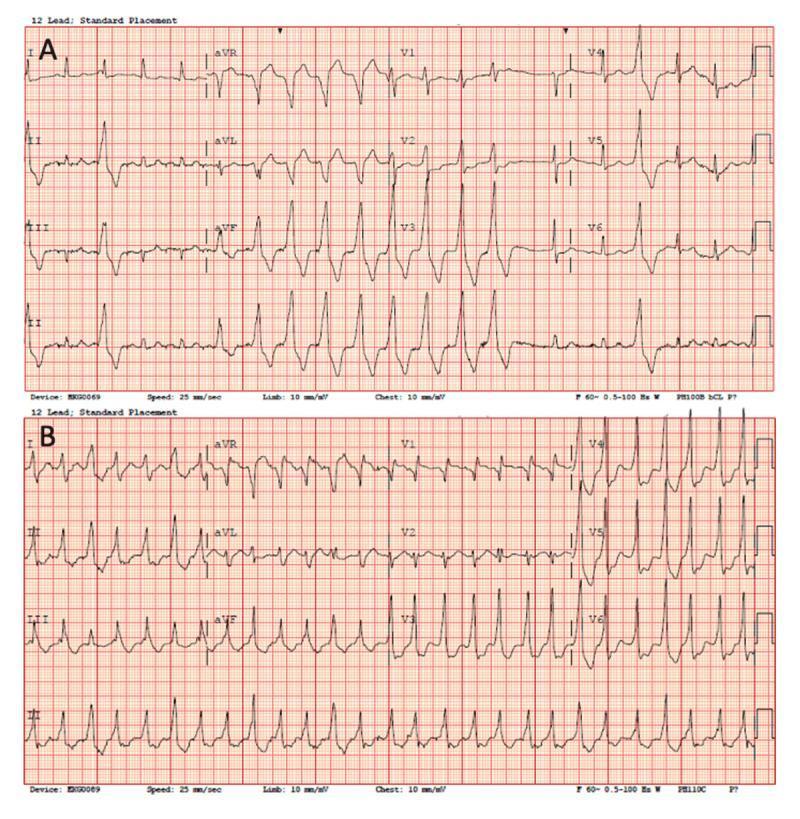
This diagnostic image displays two comparative 12-lead electrocardiograms (ECGs) representing wide-complex tachycardia localized to the ventricular outflow tract. Panel A illustrates a regular wide-complex rhythm characterized by an inferior axis and a QS pattern in leads aVR and aVL. The precordial transition is early, occurring before lead V3, which is a visual marker often associated with a left ventricular outflow tract (LVOT) origin. Panel B demonstrates a similar wide-complex tachycardia but with distinct morphological variations: it features a QR pattern specifically in lead V1, an inferior axis where the R-wave voltage ratio in lead II/III is greater than 1, and a precordial transition occurring at lead V3. These ECG findings are clinically significant for mapping the anatomical origin of idiopathic or post-surgical ventricular arrhythmias. The tracings are presented on standard grid paper (25 mm/sec) and serve as a comparative educational resource for identifying exit sites of ventricular tachycardia based on QRS morphology and axis transition.
ECG Interpretation
- Sex: Male
- Date/Time: 11-Aug-2026, 11:44:30
- Paper speed: 25 mm/s | Gain: 10 mm/mV
- Filter: H50d 35 Hz
- Machine-reported rate: 95 bpm
Rate & Rhythm
- Heart rate: ~95 bpm (machine-reported)
- Rhythm: Regular - each QRS complex appears to be preceded by consistent activity
- The overall appearance suggests a sinus rhythm at borderline high-normal rate, though the irregular and broad complexes must be assessed carefully
QRS Morphology - KEY FINDING
- Leads I, II, III: Wide, bizarre-looking QRS complexes with significant amplitude
- aVR: Deep negative deflection (predominantly negative complex) - this is a key finding
- aVL: Positive QRS complex
- V1: Broad QRS, likely with a notched or slurred morphology
- V2-V5: Wide QRS complexes with tall R waves or deep S waves; precordial pattern is abnormal
ST Segments & T Waves
- ST segments appear discordant (opposite to the main QRS deflection) - this is expected in bundle branch block or ventricular rhythm
- T wave inversions are seen in leads where the QRS is upright - secondary changes
Axis
- Based on Lead I (positive) and aVF (lead not fully visible, but Lead II appears positive): likely normal axis or left axis deviation
P Waves & PR Interval
- P waves are visible but may be difficult to clearly identify due to the wide complexes
- PR interval appears within normal range where visible (~160-200 ms)
Differential Diagnosis for Wide QRS Complex Rhythm
| Diagnosis | Features supporting |
|---|---|
| Left Bundle Branch Block (LBBB) | Broad QRS, negative in V1, positive in I/aVL, monophasic R in lateral leads |
| Right Bundle Branch Block (RBBB) | RSR' pattern in V1, broad S in I/V6 |
| Ventricular Tachycardia (VT) | Rate 95 bpm is slow for VT (usually >100 bpm), but accelerated idioventricular rhythm possible |
| WPW / Pre-excitation | Delta waves, short PR |
| Hyperkalemia | Diffuse widening, peaked T waves |
Most Likely Interpretation
Left Bundle Branch Block (LBBB)
- Broad monophasic QRS in lateral leads (I, aVL, V5-V6): Broad, notched R waves
- Broad, predominantly negative QRS in V1/V2: Deep QS or rS pattern
- Discordant ST-T changes: ST depression and T inversion in leads with tall R waves
- No septal Q waves in lateral leads
- Rate of 95 bpm is consistent with underlying sinus rhythm with LBBB
If this is new LBBB in a symptomatic patient, this should be treated as a STEMI equivalent until proven otherwise (Sgarbossa criteria apply).
Summary
| Parameter | Finding |
|---|---|
| Rate | ~95 bpm |
| Rhythm | Regular (likely sinus) |
| Axis | Normal to left axis |
| P waves | Present |
| PR interval | Normal (~160-200 ms) |
| QRS duration | Wide (>120 ms) - ABNORMAL |
| QRS morphology | Bundle branch block pattern |
| ST-T changes | Discordant (secondary to BBB) |
| Primary diagnosis | Left Bundle Branch Block (LBBB) |
Clinical note: In a symptomatic patient (chest pain, dyspnea, syncope), new or presumed-new LBBB mandates urgent evaluation for acute MI. Correlate with prior ECGs and clinical presentation. If the patient is hemodynamically unstable with a wide complex tachycardia, VT must also be excluded.