Explain me 10 heart diseases with ECG changes and ECG of those diseases.
Reading File
Finding Sources
Finding Sources
Searching Images
ECG electrocardiogram myocardial infarction ST elevation
Reading File
Searching Images
ECG atrial fibrillation irregular rhythm absent P waves
Searching Images
ECG heart block complete third degree AV block
Searching Images
ECG Wolff-Parkinson-White syndrome delta wave short PR interval
Searching Images
ECG hyperkalemia peaked T waves wide QRS sine wave
Searching Images
ECG pericarditis saddle-shaped ST elevation diffuse leads
Searching Images
ECG left ventricular hypertrophy high voltage Sokolow-Lyon criteria
Searching Images
ECG pulmonary embolism S1Q3T3 right heart strain sinus tachycardia
Searching Images
ECG hypertrophic cardiomyopathy deep T wave inversion lateral leads
Searching Images
ECG Brugada syndrome coved type ST elevation V1 V2 right bundle branch block
Finding Sources
Here is a comprehensive guide to 10 heart diseases with their ECG changes, with images for each.
10 Heart Diseases & Their ECG Changes
1. ST-Elevation Myocardial Infarction (STEMI)
Pathophysiology
Complete occlusion of a coronary artery causes full-thickness (transmural) myocardial injury, producing a characteristic sequence of ECG changes.
ECG Changes
| Phase | Finding |
|---|---|
| Hyperacute (minutes) | Tall, broad, peaked "hyperacute" T waves |
| Acute (hours) | ST-segment elevation (convex/tombstone shape), reciprocal ST depression in opposing leads |
| Subacute (hours–days) | Pathological Q waves (>40 ms wide, >25% of R amplitude), T-wave inversion |
| Old (weeks–months) | Persistent Q waves, T-wave normalization |
Localizing STEMI by leads (from Tintinalli's Emergency Medicine):
- Anterior: V1–V4 (LAD occlusion)
- Anterolateral: V1–V6, I, aVL
- Inferior: II, III, aVF (RCA or LCx)
- Lateral: I, aVL
- True Posterior: Tall R in V1/V2 + ST depression V1–V3 (mirror image)
- Right Ventricular: ST elevation V1 + right-sided leads V3R–V4R
ECG

Anterolateral STEMI: ST elevation V1–V6, I, aVL with hyperacute T waves; reciprocal ST depression in II, III, aVF.
2. Acute Pericarditis
Pathophysiology
Inflammation of the pericardium causes diffuse sub-epicardial injury, producing pan-lead ST changes — in contrast to the localized changes of MI.
ECG Changes (4 stages)
| Stage | Timing | Findings |
|---|---|---|
| I | Day 1–2 | Diffuse concave ("saddle-shaped") ST elevation in nearly all leads except aVR and V1; PR-segment depression (most visible in II, V4–V6); PR elevation in aVR |
| II | Days–week | ST normalizes, T waves flatten |
| III | Week 1–3 | Diffuse T-wave inversion |
| IV | Weeks | Normalization |
Key distinguishing feature vs. STEMI: ST elevation is concave (not convex), involves all leads (not one territory), and is accompanied by PR depression. No reciprocal changes (except aVR).
ECG
Classic pericarditis: diffuse concave ST elevation in I, II, III, aVF, V2–V6; PR depression in II/V4–V6; PR elevation in aVR.
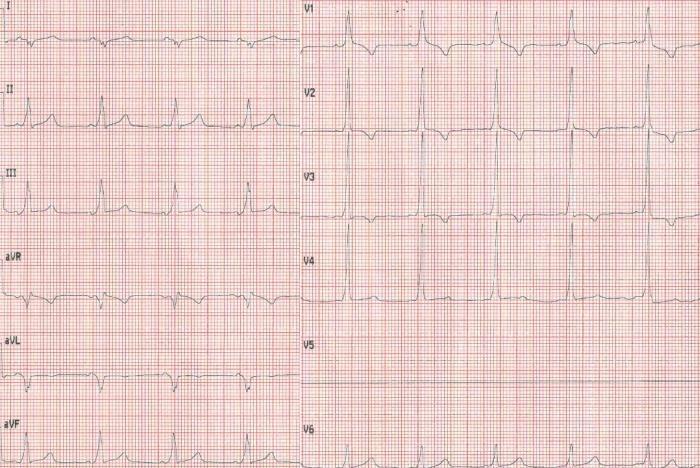
3. Atrial Fibrillation (AF)
Pathophysiology
Chaotic, disorganized atrial electrical activity produces irregular ventricular activation. Multiple re-entrant wavelets in the atria replace organized sinus node depolarization.
ECG Changes
- Absent P waves — replaced by fine, irregular fibrillatory baseline (best seen in V1)
- Irregularly irregular R-R intervals — the hallmark
- Narrow QRS (unless aberrant conduction or pre-existing bundle branch block)
- Rate varies: bradycardic (<60 bpm), normal (60–100), or rapid ventricular response (>100 bpm)
- Secondary ST-T changes may appear at rapid rates
ECG
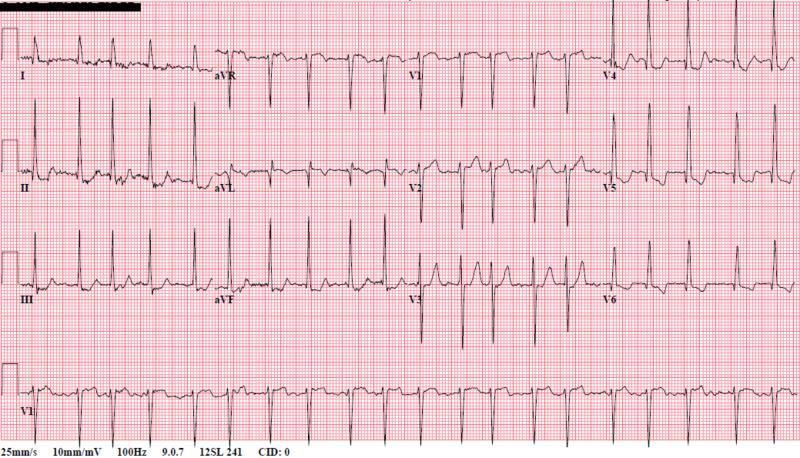
AF with RVR: absent P waves replaced by fibrillatory baseline, completely irregular QRS intervals.
4. Complete (Third-Degree) AV Block
Pathophysiology
Complete failure of conduction through the AV node or His-Purkinje system. The atria and ventricles beat independently — the ventricles driven by a slow escape pacemaker.
ECG Changes
- Complete AV dissociation — P waves and QRS complexes completely unrelated (different rates, no fixed PR interval)
- Regular P-P intervals at the atrial rate (usually 60–100 bpm)
- Regular R-R intervals at the escape rate (slower than atrial rate)
- Junctional escape: narrow QRS at 40–60 bpm
- Ventricular escape: wide QRS at 20–40 bpm
- P waves "march through" the QRS complexes
ECG
Third-degree heart block: P waves and wide QRS complexes occur independently. Slow ventricular escape rhythm with no consistent PR interval.
5. Pulmonary Embolism (PE)
Pathophysiology
Acute obstruction of pulmonary vasculature increases right ventricular afterload, causing acute right heart strain and dilation.
ECG Changes
- Sinus tachycardia — most common and most sensitive finding
- S1Q3T3 pattern — S wave in lead I, Q wave in lead III, inverted T wave in lead III (McGinn-White sign; present in ~20% of PE)
- Right axis deviation
- Incomplete or complete RBBB — new right bundle branch block pattern
- T-wave inversions in V1–V3 (V4) — right ventricular strain
- P-pulmonale — tall, peaked P waves in II (if severe)
- Right ventricular strain pattern
ECG
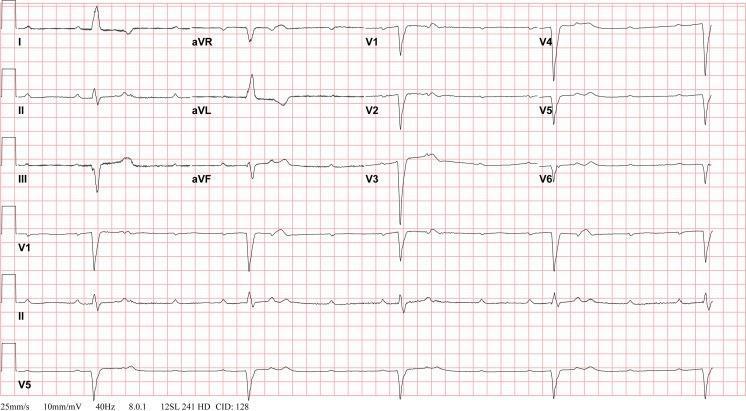
Acute PE: sinus tachycardia, S1Q3T3 pattern, incomplete RBBB, T-wave inversions in V1–V3 indicating RV strain.
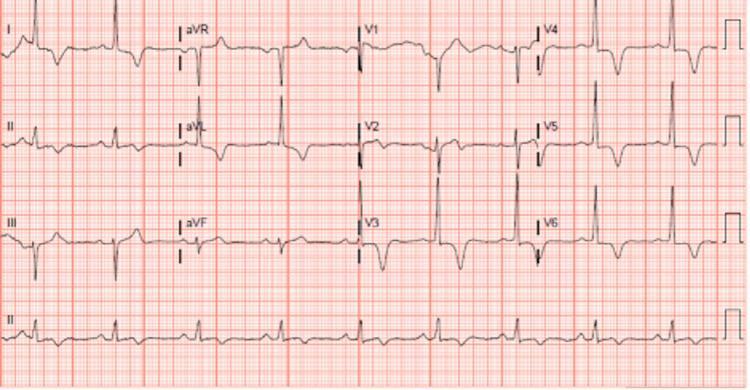
6. Left Ventricular Hypertrophy (LVH)
Pathophysiology
Chronic pressure overload (e.g., hypertension, aortic stenosis) causes the left ventricular myocardium to thicken, generating larger electrical forces and delayed repolarization.
ECG Changes
Voltage criteria (Sokolow-Lyon):
- S in V1 + R in V5 or V6 ≥ 35 mm
- R in aVL ≥ 11–12 mm
Strain pattern (LVH with strain):
- ST depression and T-wave inversion in I, aVL, V5–V6 (lateral leads)
- "Strain" reflects subendocardial ischemia from increased wall stress
Other features:
- Left axis deviation
- Broad, notched P waves (P-mitrale) if left atrial enlargement coexists
- Prolonged QRS duration
ECG
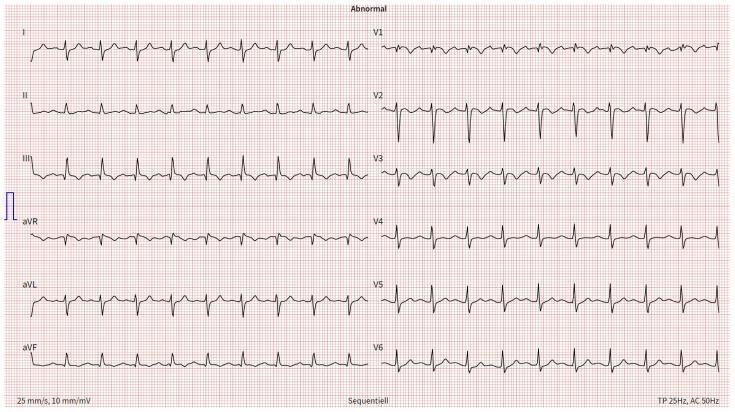
LVH with strain: tall R waves in V5/V6, deep S in V1/V2 (Sokolow-Lyon criteria met); ST depression and T inversion in II, III, aVF, V5–V6.
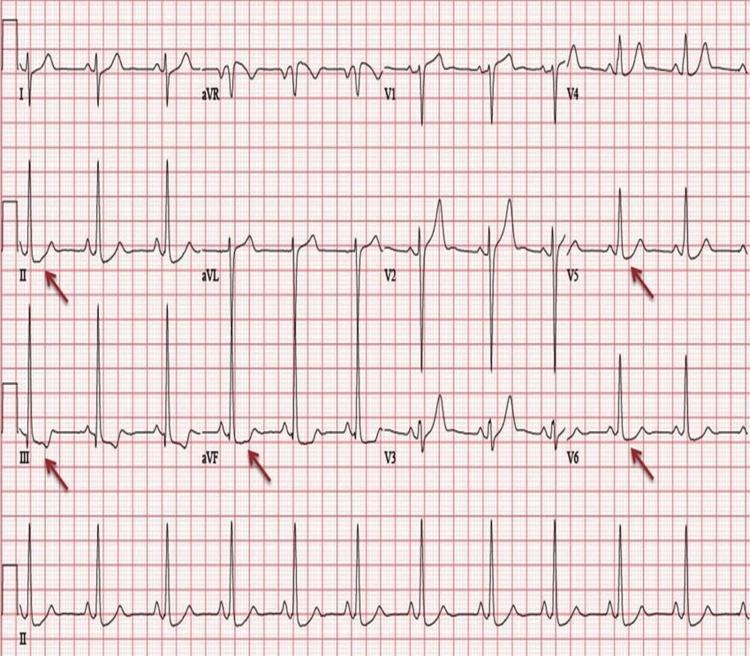
7. Wolff-Parkinson-White (WPW) Syndrome
Pathophysiology
An accessory pathway (Bundle of Kent) bypasses the AV node, causing ventricular pre-excitation. The ventricles begin depolarizing earlier than normal via the bypass tract before AV node conduction arrives.
ECG Changes (classic triad)
- Short PR interval — < 120 ms (pre-excitation bypasses AV nodal delay)
- Delta wave — slurred, slow initial upstroke of the QRS (initial ventricular activation via the accessory pathway, which conducts more slowly through myocardium)
- Widened QRS — > 120 ms (fusion of accessory + normal conduction)
Secondary changes:
- Discordant ST-T changes (T waves opposite to QRS direction)
- Pseudo-Q waves in inferior leads (can mimic old MI — "pseudoinfarction pattern")
- Delta wave polarity localizes the accessory pathway
During tachycardia:
- Orthodromic AVRT: narrow QRS, retrograde P waves after QRS
- Antidromic AVRT: very wide QRS (fully pre-excited)
ECG
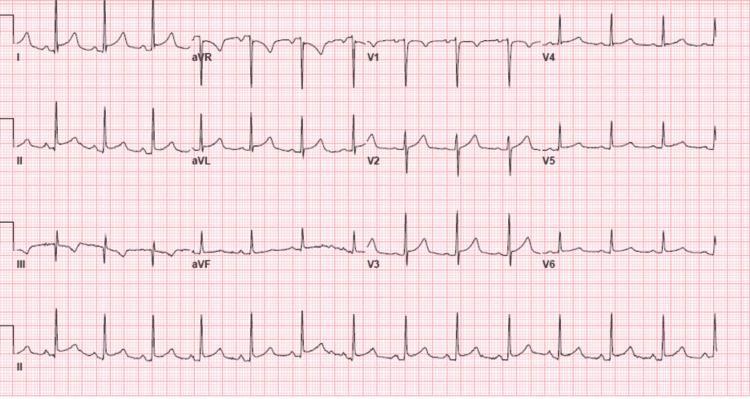
WPW: short PR interval (<120 ms), prominent delta waves in II, III, aVF and V2–V6, widened QRS — the classic pre-excitation triad.
8. Hyperkalemia
Pathophysiology
Elevated serum potassium reduces the resting membrane potential, slowing phase 0 depolarization and prolonging repolarization. Progressive ECG changes correlate with serum K⁺ levels.
ECG Changes (progressive, by K⁺ level)
| K⁺ Level | ECG Finding |
|---|---|
| 5.5–6.5 mEq/L | Tall, narrow, peaked ("tented") T waves — earliest sign, best in V2–V4 |
| 6.5–7.5 mEq/L | PR interval prolongation, P-wave flattening/disappearance |
| 7.5–8.5 mEq/L | QRS widening (intraventricular conduction delay) |
| >8.5–9 mEq/L | Sine-wave pattern — QRS and T merge into a continuous undulation; precedes VF/asystole |
ECG
Severe hyperkalemia (K⁺ ~9.2 mEq/L): absent P waves, markedly widened QRS complexes, peaked T waves, sine-wave morphology in V2–V3 — critical pre-arrest state.
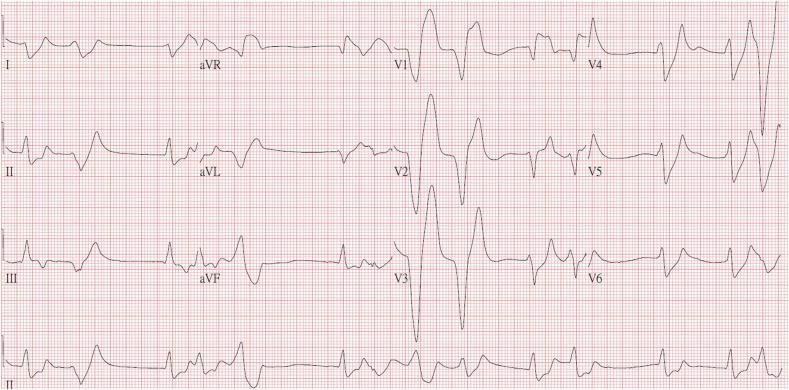
9. Hypertrophic Cardiomyopathy (HCM)
Pathophysiology
Asymmetric hypertrophy — most commonly of the interventricular septum — creates increased wall mass, abnormal myocyte arrangement (disarray), and diastolic dysfunction. Apical HCM (Yamaguchi syndrome) produces particularly striking ECG changes.
ECG Changes
- LVH voltage criteria — tall R in V5/V6, deep S in V1/V2
- Deep, symmetric T-wave inversions — classic in lateral leads (I, aVL, V4–V6); may be "giant" (>10 mm) in apical HCM
- Left axis deviation
- Abnormal Q waves — deep, narrow Q waves in lateral/inferior leads (due to septal hypertrophy — not infarction)
- Atrial fibrillation — common complication
- Apical HCM (Yamaguchi): giant negative T waves in V3–V5 with high precordial voltage
ECG
Apical HCM (Yamaguchi syndrome): giant symmetric T-wave inversions in V3–V6 and inferior leads with high QRS voltage — a hallmark of apical variant HCM.
10. Brugada Syndrome
Pathophysiology
A sodium channelopathy (SCN5A gene mutation) causing abnormal repolarization in the right ventricular outflow tract (RVOT). Despite structurally normal hearts, it carries a high risk of sudden cardiac death from polymorphic ventricular tachycardia/fibrillation.
ECG Changes
There are 3 ECG types (Type 1 is the only diagnostic pattern):
| Type | Pattern | Significance |
|---|---|---|
| Type 1 (diagnostic) | Coved-type: ≥2 mm ST elevation in V1–V2, descending to inverted T wave ("shark fin" or "coved" shape) | Diagnostic of Brugada syndrome |
| Type 2 | Saddle-back ST elevation ≥2 mm with positive/biphasic T wave | Suggestive — needs provocation |
| Type 3 | <1 mm ST elevation of either morphology | Non-diagnostic |
Other features:
- Incomplete or complete RBBB pattern
- Normal QT interval
- Pattern may be intermittent — unmasked by fever, sodium channel blockers (ajmaline/flecainide provocation test), or vagotonic states
- May show first-degree AV block
ECG
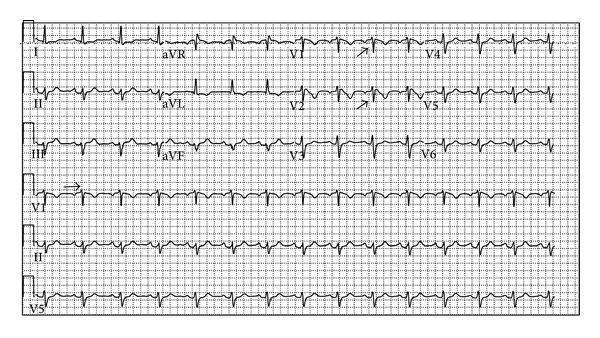
Brugada Type 1 pattern: coved-type ST elevation ≥2 mm in V1–V2, descending into symmetric T-wave inversion — pathognomonic for Brugada syndrome. Arrows highlight the diagnostic coved morphology.
Quick Reference Summary
| # | Disease | Key ECG Feature |
|---|---|---|
| 1 | STEMI | Convex ST elevation (territory-specific) → Q waves |
| 2 | Pericarditis | Diffuse concave ST elevation + PR depression |
| 3 | Atrial Fibrillation | Absent P waves + irregularly irregular rhythm |
| 4 | Complete Heart Block | AV dissociation — independent P and QRS |
| 5 | Pulmonary Embolism | Sinus tach + S1Q3T3 + RV strain pattern |
| 6 | LVH | High voltage (Sokolov-Lyon) + lateral strain |
| 7 | WPW Syndrome | Short PR + delta wave + wide QRS |
| 8 | Hyperkalemia | Peaked T waves → wide QRS → sine wave |
| 9 | HCM | Giant T inversions (lateral/precordial) + LVH |
| 10 | Brugada Syndrome | Coved ST elevation V1–V2 + RBBB pattern |
Sources: Tintinalli's Emergency Medicine (9781260019933), Fuster and Hurst's The Heart 15e (9781264257560), Medical Physiology (9780323319737). ECG images sourced from peer-reviewed PMC clinical literature.
This is a shared conversation. Sign in to Orris to start your own chat.