
Absence of 3 peak in bera test
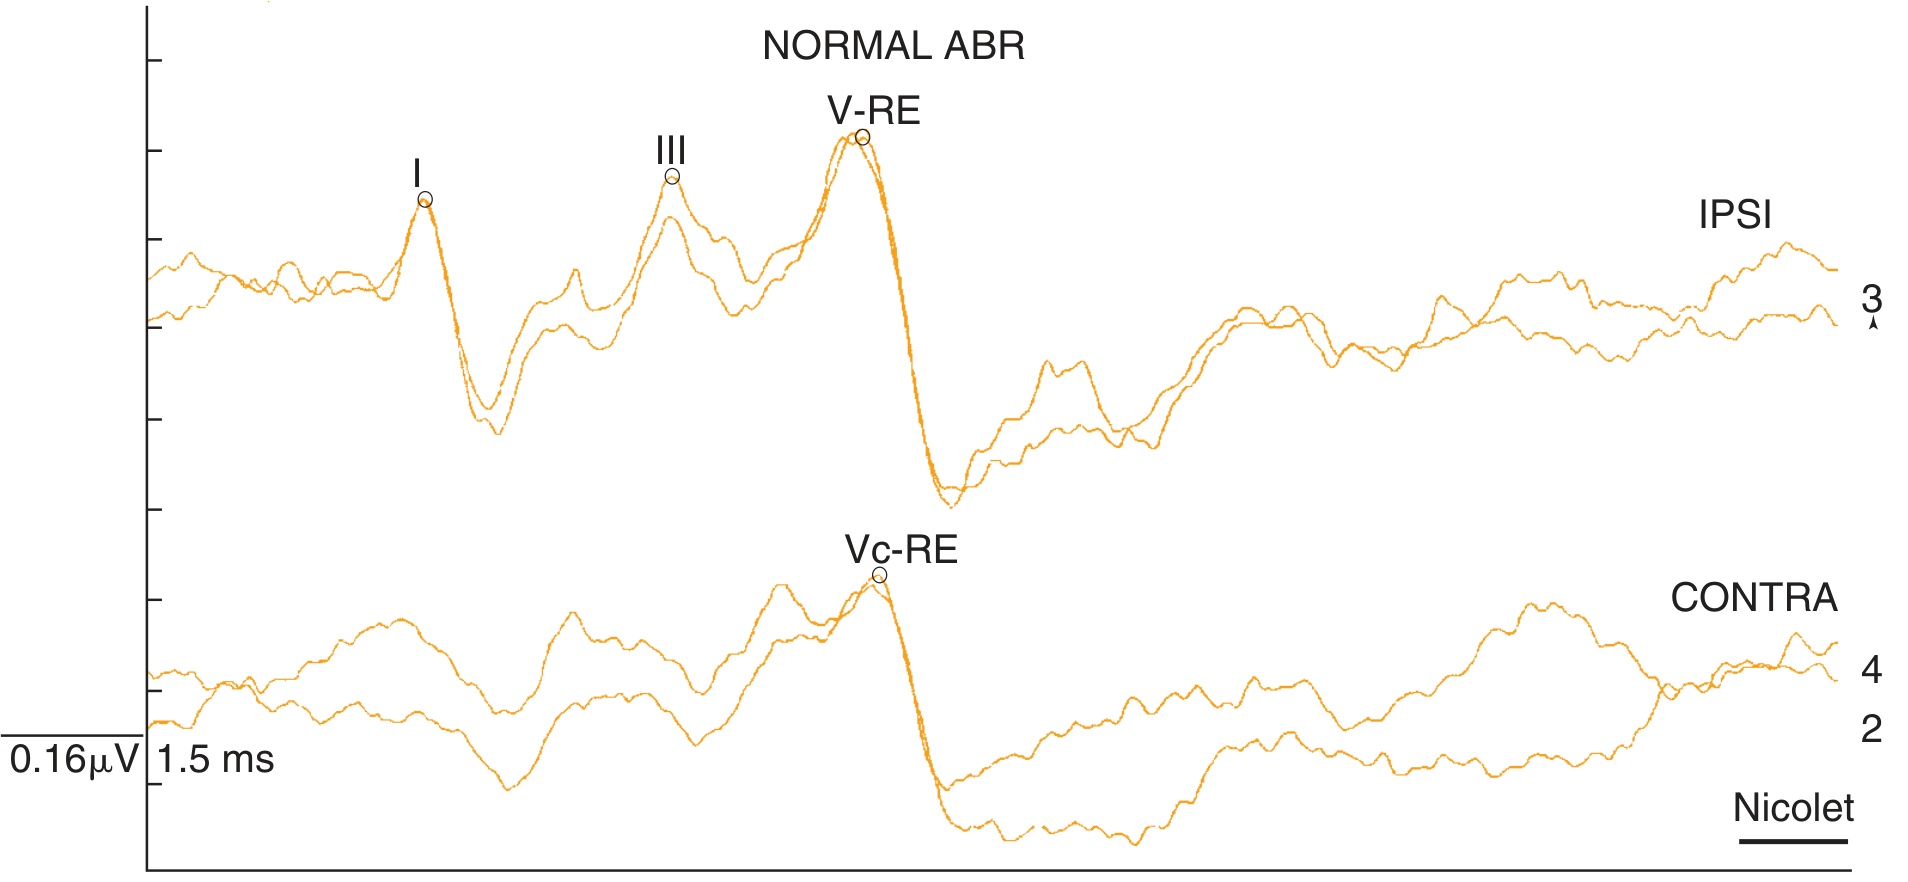
BERA auditory brainstem response waves I II III IV V normal
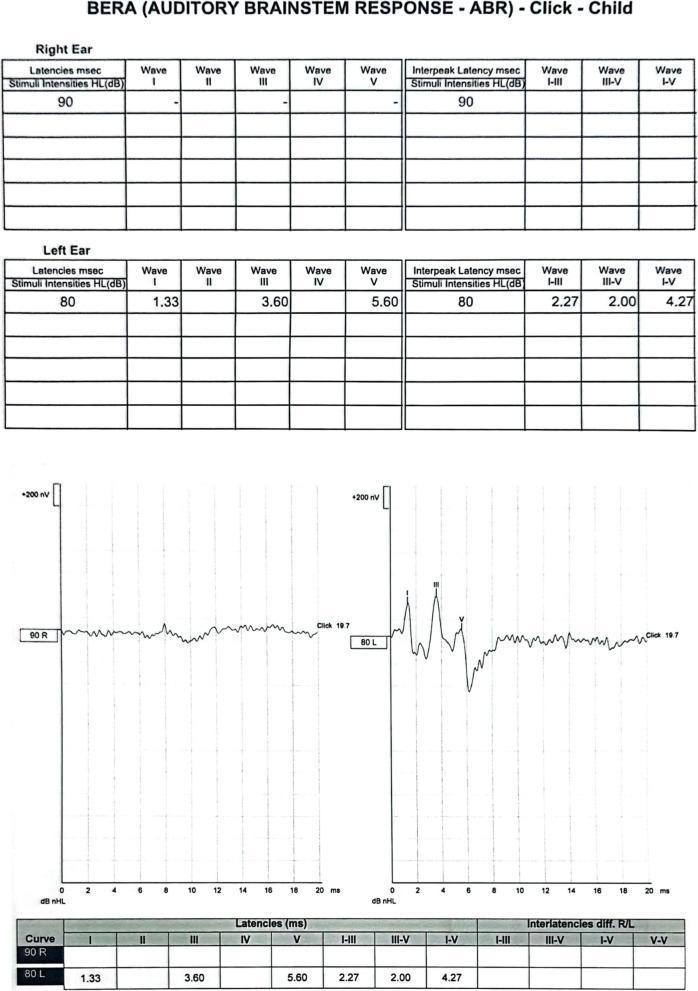
This diagnostic report presents an Auditory Brainstem Response (ABR/BERA) test for a pediatric patient using click stimuli. The image contains both numerical data tables and neurophysiological waveforms for the right and left ears. The 'Right Ear' (90 R) waveform is significantly abnormal, appearing flat and without identifiable peaks (Waves I-V), indicating an absent response to auditory stimuli at 90 dB nHL. In contrast, the 'Left Ear' (80 L) display shows a normal neurophysiological response with clearly defined and labeled waveforms for Waves I (1.33 ms), III (3.60 ms), and V (5.60 ms). Accompanying tables provide detailed latency and inter-latency measurements for the left ear, including I-III (2.27 ms), III-V (2.00 ms), and I-V (4.27 ms) intervals. These findings are clinically consistent with unilateral hearing loss or auditory nerve dysfunction on the right side, contrasting with the physiological neural conduction through the auditory brainstem pathways on the left. This diagnostic material is relevant for audiology, otolaryngology, and neurology trainees.
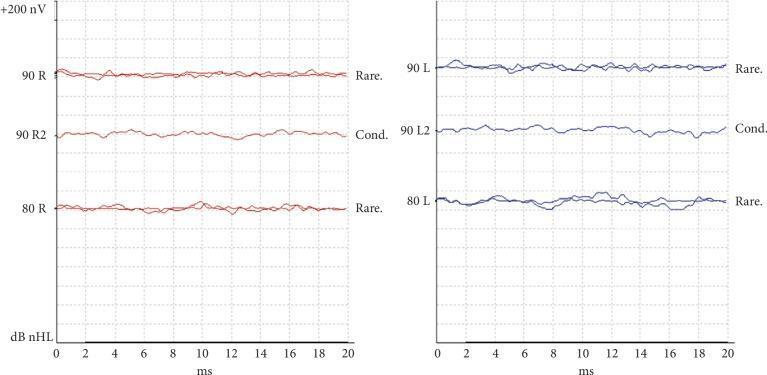
This diagnostic image displays a Brainstem Auditory Evoked Response (BAER) or Brainstem Evoked Response Audiometry (BERA) recording, a neurophysiological test used to evaluate hearing and brainstem function. The data is presented in two separate graph panels for the right ear (labeled 'R' in red) and the left ear (labeled 'L' in blue). The x-axis represents time in milliseconds (0 to 20 ms), and the y-axis represents amplitude in nanovolts (nV). Measurements are shown for auditory stimulations at 90 dB nHL and 80 dB nHL, utilizing both rarefaction (Rare.) and condensation (Cond.) click polarities. In both panels, the traces are essentially flat or demonstrate low-amplitude non-specific noise, with a complete absence of the characteristic Waves I-V typically seen in a normal response. This visual pattern is a clinical indicator of severe to profound bilateral hearing loss or significant pathology along the auditory pathway, as it demonstrates an absence of measurable neural response even at high intensity (90 dB) stimulation.
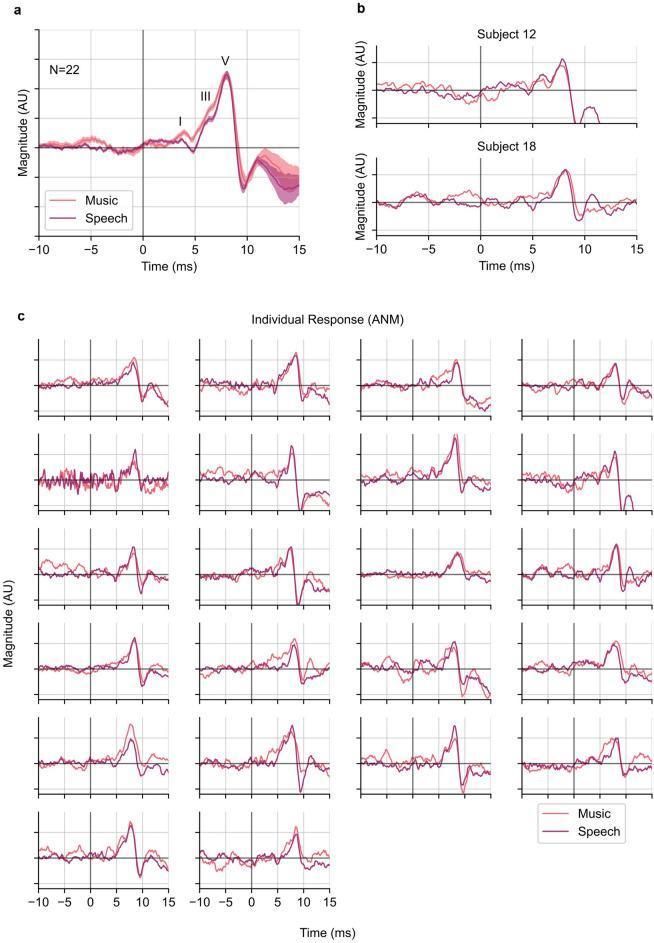
This figure presents Auditory Brainstem Response (ABR) waveforms evoked by music and speech stimuli, derived using an Auditory Nerve Modeled (ANM) regressor. Panel (a) shows the grand average waveforms for 22 subjects, with Magnitude (AU) on the y-axis and Time (ms) ranging from -10 to 15 on the x-axis. The canonical ABR components—Wave I (cochlear nerve), Wave III (superior olivary complex), and Wave V (inferior colliculus)—are clearly annotated and identifiable for both music (pink) and speech (dark red) at typical latencies, with Wave V peaking around 7.5–8.1 ms. Panel (b) provides example individual responses for Subjects 12 and 18, demonstrating subject-level variation. Panel (c) displays a 6x4 grid of individual ABR waveforms for all participants, illustrating that while Wave V is consistently robust across all subjects, the clarity of Waves I and III varies. These diagnostic plots demonstrate that accounting for peripheral nonlinearities through ANM modeling reveals a high degree of subcortical encoding similarity between music and speech stimuli.
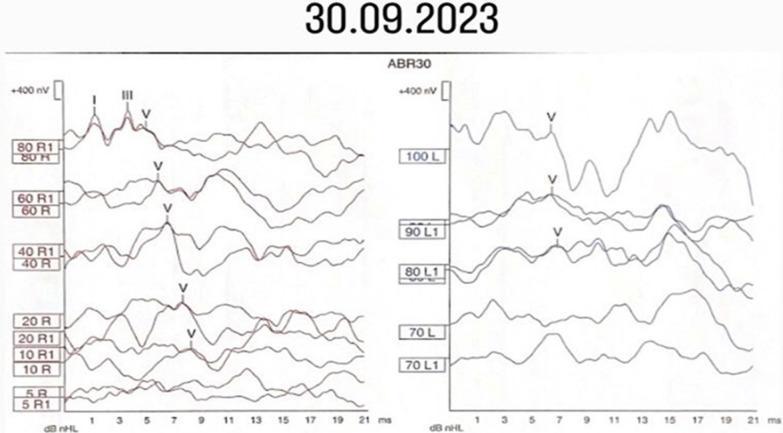
This diagnostic image displays the wave morphologies of an Auditory Brainstem Response (ABR) test, showing objective electrophysiological data for both the right (R) and left (L) ears. The ABR traces represent neural activity along the auditory pathway from the cochlear nerve to the brainstem. The right ear traces show well-defined, reproducible wave peaks (labeled I, III, and V) down to lower intensities, with Wave V identifiable at 10 dB nHL, indicating normal hearing sensitivity and neural synchrony. In contrast, the left ear traces exhibit significant distortion and poor wave morphology. While Wave V is identified at higher intensities (70-100 dB nHL), earlier waves (I and III) are absent or poorly defined, and the latency of Wave V appears delayed compared to the right side. This side-by-side comparison demonstrates a pathological response in the left ear, consistent with sensorineural hearing loss and impaired neural conduction. The x-axis represents time in milliseconds (ms), and the y-axis shows amplitude in nanovolts (nV).
Absence of Wave III in BERA (Brainstem Evoked Response Audiometry)
Normal ABR Waves - Quick Review
| Wave | Generator | Approximate Latency |
|---|---|---|
| I | Distal cochlear (auditory) nerve - peripheral end | ~1.5 ms |
| II | Proximal cochlear nerve (near porus acusticus) | ~2.7 ms |
| III | Cochlear nucleus complex / Superior olivary complex (lower pons) | ~3.7 ms |
| IV | Superior olivary complex (upper pons) | ~5.0 ms |
| V | Lateral lemniscus / inferior colliculus (midbrain) | ~5.6 ms |
Wave III - Generator & Significance
Clinical Significance of Absent Wave III
- Indicates pathology at or beyond the cochlear nucleus/lower pons
- Suggests a lesion at the level of the lower pons (pontine lesion)
- This pattern is seen in:
- Acoustic neuroma (vestibular schwannoma) - compression at the CPA
- Cerebellopontine angle (CPA) tumors / meningioma
- Multiple sclerosis (demyelination at the lower brainstem)
- Brainstem infarct involving the lower pons
- Pontine glioma
- Confirms a retrocochlear (central/post-cochlear) lesion
- The I-V interpeak latency becomes unmeasurable
- This is a definitive indicator of retrocochlear involvement per Cummings Otolaryngology
- Can be a normal variant in some individuals - Wave III is the least robust of the key peaks
- Cummings notes: "Wave V is the most robust of the ABR components...waves I and III are less robust. Wave I is difficult to resolve with hearing loss that exceeds 40-45 dB...with wave III persisting somewhat beyond that"
- An absent wave III does not automatically equal retrocochlear pathology if Wave V is normal
Diagnostic Hierarchy (from Cummings Otolaryngology)
- Is there any ABR? - A completely flat response at 85 dB nHL in a patient with severe hearing loss may not indicate retrocochlear pathology
- Are all major peaks (I, III, V) present? - Absent Wave V in the presence of Wave I or III = definitive retrocochlear involvement
- Measure interpeak latencies - Key diagnostic thresholds:
- I-III: ≥ 2.3 ms = abnormal (most sensitive for lower brainstem lesions)
- III-V: ≥ 2.1 ms = abnormal
- I-V: ≥ 4.4 ms = abnormal
- Interaural latency difference for V: ≥ 0.4 ms = abnormal
Summary Table: Absent Wave III Patterns
| Pattern | Interpretation |
|---|---|
| I present, III absent, V absent | Pontine/lower brainstem lesion; definitive retrocochlear pathology |
| I present, III absent, V present | Possible normal variant OR mild pontine pathology; check I-V latency |
| I absent, III absent, V present | Cochlear nerve (peripheral) problem; not a central lesion |
| All waves absent | Severe hearing loss OR complete auditory pathway disruption |
Key Takeaway for Exams
Absence of Wave III = lesion at the level of the cochlear nucleus / lower pons (superior olive). The most common pathology is an acoustic neuroma or CPA tumor. The I-III interpeak latency is the gold standard measurement for detecting lower brainstem retrocochlear lesions.