
Angina Vs MI
angina vs myocardial infarction comparison ECG changes
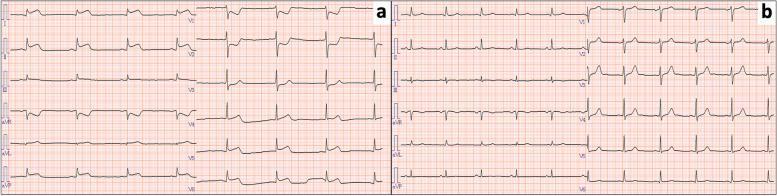
This diagnostic image displays a comparison chart containing two 12-lead electrocardiogram (ECG) recordings, labeled 'a' and 'b'. Panel 'a' illustrates acute cardiac changes during an episode of coronary vasospasm. It shows significant, diffuse ST-segment elevation in the inferior leads (II, III, aVF), the high lateral leads (I, aVL), and the precordial leads (V4–V6), alongside reciprocal ST-segment depression in leads V1 and V2. These findings are characteristic of a transmural injury pattern or Prinzmetal angina. Panel 'b' shows a follow-up ECG recorded 24 hours later, demonstrating a complete resolution of the ST-segment abnormalities and a return to a normal sinus rhythm with baseline isoelectric ST segments. The comparison serves as an educational tool for identifying transient ST-elevation myocardial infarction (STEMI) patterns induced by drug-related vasospasm, such as that caused by paclitaxel, and highlights the reversible nature of the electrical findings once the spasm resolves.
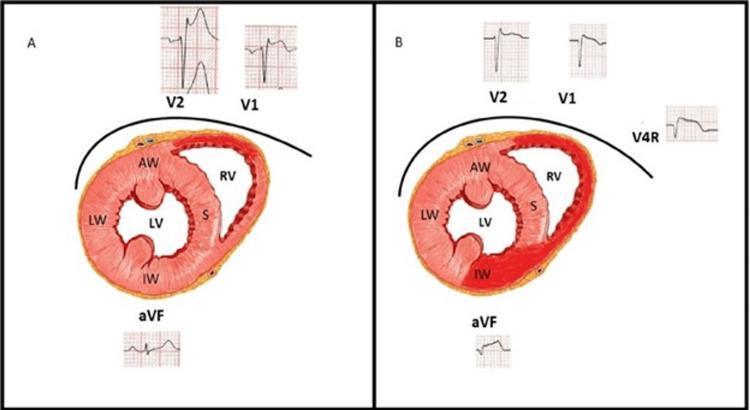
Educational comparison diagram illustrating the progression of myocardial ischemia and associated electrocardiographic (ECG) changes over time (30 vs. 90 minutes). Panel A shows a cross-sectional anatomical diagram of the heart with normal perfusion, labeled with structures including the Anterior Wall (AW), Lateral Wall (LW), Septum (S), Inferior Wall (IW), and Right Ventricle (RV). Corresponding ECG tracings for leads V1, V2, and aVF show baseline morphologies. Panel B demonstrates the progression of a transmural injury, visually indicated by dark red shading in the Inferior Wall (IW) and Right Ventricle (RV). This pathological change is correlated with dynamic ECG findings: leads V1 and V2 show a reduction in ST-elevation amplitude compared to Panel A, while lead aVF now exhibits new ST-segment elevation. Additionally, Panel B includes a right-sided lead V4R showing ST-elevation, diagnostic of right ventricular involvement. The diagram serves to teach the 'wandering' nature of ST-elevation during evolving myocardial infarction, specifically highlighting the shift from early anterior injury vectors to inferior and right ventricular manifestations.
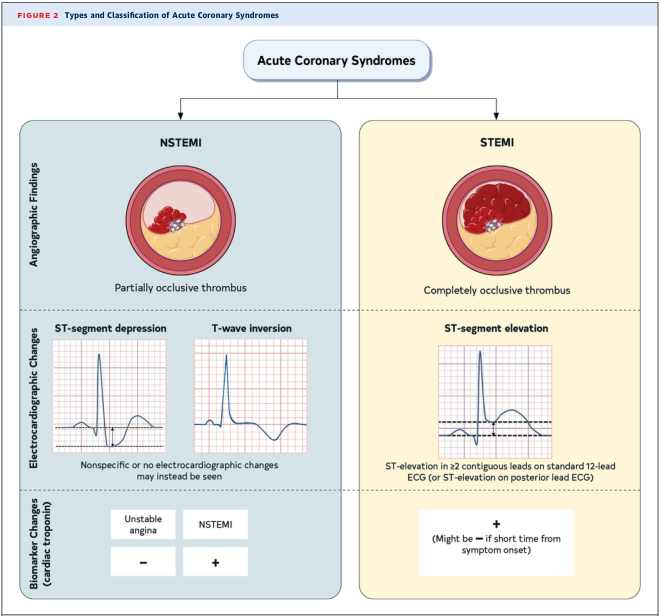
Summary : This figure presents the types and classification of Acute Coronary Syndromes, contrasting NSTEMI (Non-ST-Elevation Myocardial Infarction) and STEMI (ST-Elevation Myocardial Infarction) based on angiographic findings, electrocardiographic changes, and cardiac biomarker changes. flowchart: # Main Categories : • Acute Coronary Syndromes (central node) – Branches into: NSTEMI (left), STEMI (right) # NSTEMI : ## Angiographic Findings : • Illustration of a coronary artery with a partially occlusive thrombus. • Label: "Partially occlusive thrombus" ## Electrocardiographic Changes : • ST-segment depression (example ECG tracing) • T-wave inversion (example ECG tracing) • Note: "Nonspecific or no electrocardiographic changes may instead be seen" ## Biomarker Change (cardiac troponin) : • Unstable angina: negative (–) • NSTEMI: positive (+) # STEMI : ## Angiographic Findings : • Illustration of a coronary artery with a completely occlusive thrombus. • Label: "Completely occlusive thrombus" ## Electrocardiographic Changes : • ST-segment elevation (example ECG tracing) • Note: "ST-elevation in ≥2 contiguous leads on standard 12-lead ECG (or ST-elevation on posterior lead ECG)" ## Biomarker Change (cardiac troponin) : • Positive (+) • Note: "Might be – if short time from symptom onset" # Layout : • Two-column comparison: NSTEMI (blue background, left), STEMI (yellow background, right) • Each column subdivided into three horizontal sections: Angiographic Findings, Electrocardiographic Changes, Biomarker Change # Analysis : • NSTEMI is characterized by partial thrombus occlusion, ST-segment depression or T-wave inversion (or nonspecific ECG changes), and positive cardiac troponin. • STEMI is defined by complete thrombus occlusion, ST-segment elevation on ECG, and positive cardiac troponin (may be negative early after symptom onset). • The figure visually distinguishes the pathophysiology, ECG findings, and biomarker profiles of NSTEMI and STEMI, aiding in clinical differentiation.
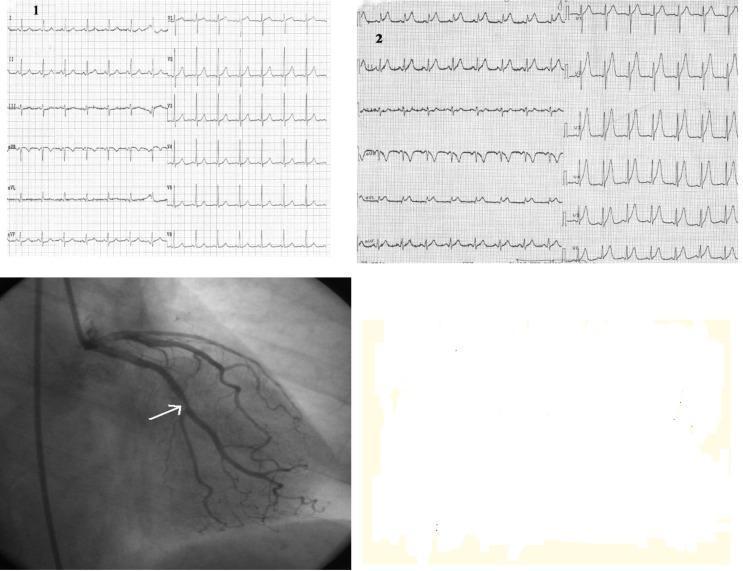
This composite figure presents a clinical case study of acute coronary syndrome through ECG comparison and invasive imaging. Panels 1 and 2 show 12-lead electrocardiogram (ECG) tracings. Panel 1 depicts a baseline sinus rhythm with normal repolarization. Panel 2, recorded during symptomatic chest pain, reveals significant ST-segment elevation in the high lateral (I, aVL) and precordial (V1-V6) leads, accompanied by hyperacute, tall, peaked T-waves, indicative of an acute anterolateral ST-elevation myocardial infarction (STEMI). Below the ECGs, a grayscale coronary angiogram (fluoroscopy) visualizes the left coronary artery system using radiopaque contrast. A white arrow points to a significant focal stenosis within the left circumflex coronary artery, specifically at the origin of the first marginal branch (Mg1). This visual combination illustrates the correlation between dynamic electrocardiographic changes during angina and the underlying obstructive coronary artery disease. The educational focus is on identifying acute ischemic patterns on ECG and their angiographic confirmation in the context of one-vessel coronary disease.
Angina vs Myocardial Infarction (MI)
1. Pathophysiology
| Feature | Angina | Myocardial Infarction |
|---|---|---|
| Mechanism | Temporary imbalance between O₂ supply and demand | Sustained ischemia leading to irreversible cell death |
| Coronary occlusion | Partial / transient (no complete blockage) | Complete (STEMI) or partial with prolonged ischemia (NSTEMI) |
| Tissue outcome | Ischemia only - no necrosis | Myocardial necrosis - irreversible |
| Onset of necrosis | Does not occur | Begins as early as 15-20 minutes of occlusion, spreads endocardium → epicardium |
2. Types of Angina
- Stable angina - predictably triggered by exertion or stress; relieved by rest or sublingual nitroglycerin within minutes
- Unstable angina (UA) - angina at rest, new-onset angina, or rapidly worsening angina; part of the Acute Coronary Syndrome (ACS) spectrum
- Variant (Prinzmetal) angina - coronary vasospasm; transient ST elevation that fully resolves
3. Clinical Presentation
| Feature | Angina | MI |
|---|---|---|
| Chest pain quality | Tightness, pressure, burning, aching - usually anterior chest/retrosternal | Same quality but more severe and persistent |
| Duration | Stable: < 15-20 min; UA: > 20 min | > 20-30 min (often hours) |
| Relieved by rest | Yes (stable angina) | No |
| Relieved by nitrates | Yes | Not reliably |
| Radiation | Left arm, jaw, shoulder | Same pattern |
| Associated symptoms | Mild/none in stable; diaphoresis in UA | Nausea, vomiting, diaphoresis, dyspnea, restlessness, apprehension |
| Silent presentation | Uncommon | ~20% are silent; more common in elderly, diabetics, women |
"The discomfort of acute MI is not reliably relieved by rest or nitroglycerin." - Goldman-Cecil Medicine
4. ECG Changes
| Stable Angina | Unstable Angina / NSTEMI | STEMI | |
|---|---|---|---|
| ECG | Usually normal (at rest) | ST depression, T-wave inversion, or pseudo-normalization; may be silent | ST elevation ≥2 contiguous leads |
| Reversibility | Fully reversible | Transient; may persist | Evolves to Q waves over time |
5. Cardiac Biomarkers
| Marker | Stable Angina | Unstable Angina | NSTEMI / STEMI |
|---|---|---|---|
| Troponin I / T | Negative | Negative | Positive |
| CK-MB | Normal | Normal | Elevated (peaks ~24 hrs) |
| Myoglobin | Normal | Normal | Elevated (rises within 1-2 hrs) |
6. Diagnosis
- Ischemic chest discomfort
- ECG abnormalities
- Elevated serum cardiac biomarkers
7. Management Overview
| Approach | Stable Angina | UA/NSTEMI | STEMI |
|---|---|---|---|
| Immediate | Sublingual nitro, rest | ED/chest pain unit, monitoring | Emergency PCI within 90 min (preferred) or fibrinolytics |
| Antiplatelet | Aspirin | Aspirin + P2Y12 inhibitor | Dual antiplatelet |
| Anticoagulation | Not required acutely | Heparin/LMWH | Heparin + reperfusion |
| Revascularization | Elective (PCI/CABG) if high-risk | Early invasive if high-risk | Primary PCI urgently |
| Long-term | Beta-blockers, nitrates, statins | Statins, ACEi, beta-blockers | Same + aggressive secondary prevention |
8. Key Differentiating Points (Quick Summary)
| Angina | MI | |
|---|---|---|
| Necrosis | No | Yes |
| Troponin | Negative | Positive |
| ECG | Transient/reversible changes | ST elevation (STEMI) or persistent depression (NSTEMI) |
| Pain relieved by rest/nitrates | Yes (stable) | No |
| Duration | < 20 min (stable) | > 20-30 min |
| Urgency | Outpatient (stable) / ED (UA) | Always emergency |
- Goldman-Cecil Medicine (STEMI pathophysiology, clinical manifestations, diagnosis)
- Textbook of Family Medicine 9e (UA/NSTEMI criteria, biomarker kinetics)
- Swanson's Family Medicine Review (angina pectoris symptoms, management)
- Washington Manual of Medical Therapeutics (troponin as recommended biomarker for MI)