
What are the main differences between osteoarthritis and rheumatoid arthritis, including the primary tissues affected and the typical age of onset?"
osteoarthritis vs rheumatoid arthritis comparison joint pathology
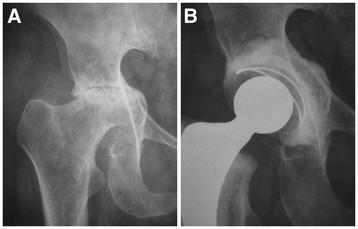
This diagnostic image consists of two side-by-side anteroposterior (AP) radiographs of the hip, comparing preoperative pathology with postoperative results. Panel A illustrates Grade II protrusio acetabuli, a deformity characterized by the medial migration of the femoral head beyond the ilio-ischial (Kohler's) line, often associated with rheumatoid arthritis. There is visible joint space narrowing and subchondral sclerosis consistent with secondary osteoarthritis. Panel B displays the same hip following a Total Hip Replacement (THR). The image shows a prosthetic construct comprising a radio-opaque femoral stem, a modular femoral head, and an acetabular cup. The reconstruction demonstrates the restoration of the anatomical center of rotation lateral to Kohler’s teardrop. This was achieved through the surgical use of a medial bone graft (impacted morselized bone) to address the medial wall deficiency and provide a stable base for the acetabular component. The radiographic comparison highlights the transition from a debilitating pelvic deformity to a corrected prosthetic alignment designed to restore joint biomechanics and weight-bearing function.
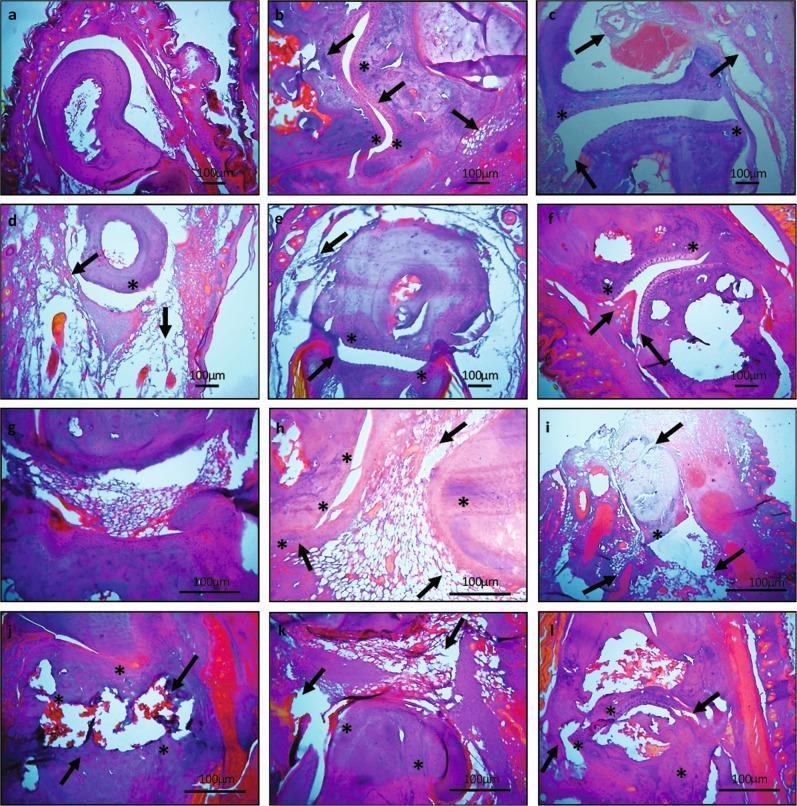
This composite diagnostic image consists of twelve light microscopy panels (a-l) showing hematoxylin and eosin (H&E) stained sections of mouse tarsal (a-f) and ankle (g-l) joints. The image serves as a comparison chart for rheumatoid arthritis pathology and treatment efficacy. Panels 'a' and 'g' represent normal controls, displaying intact articular cartilage, smooth synovial linings, and clear joint spaces. Panels 'b' and 'h' depict untreated arthritic joints, characterized by significant pannus formation, continuous cartilage degradation, bone erosion (indicated by arrows), and dense inflammatory cellular infiltration (marked by asterisks). Subsequent panels (c-f and i-l) illustrate the histological effects of various interventions, including hydroxychloroquine, leflunomide, and experimental plant extracts (aqueous and ethyl acetate). These panels demonstrate varying degrees of therapeutic response, ranging from persistent joint modification and bone loss in standard drug groups to preserved joint architecture and reduced synovial hyperplasia in extract-treated groups. The magnification (20x and 40x) allows for the visualization of key pathophysiological markers such as cellular infiltration, joint space narrowing, and osteoclast-mediated erosion.
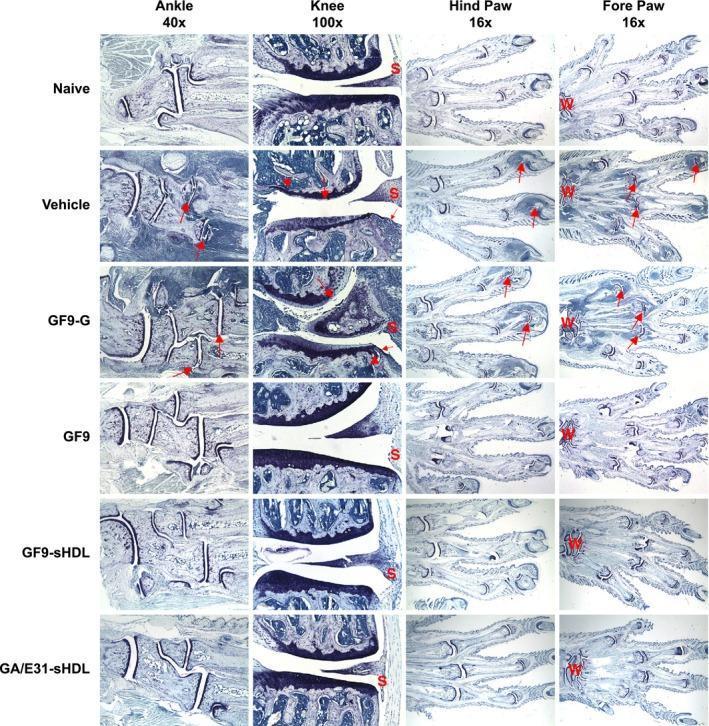
This composite of histological photomicrographs illustrates the joint pathology in a murine model of collagen-induced arthritis (CIA) across various treatment groups. The sections are stained with toluidine blue to visualize proteoglycan content and structural integrity in the ankle (40x), knee (100x), hind paw (16x), and fore paw (16x). Comparison between the 'Naive' and 'Vehicle' or 'GF9-G' control groups reveals marked inflammation, synovial thickening ('S'), pannus formation (small arrows), cartilage destruction (large arrows), and bone resorption (arrowheads) in the arthritic controls. In contrast, mice treated with TREM-1 inhibitory sequences—specifically free GF9, GF9-sHDL, and GA/E31-sHDL—demonstrate significant preservation of joint architecture. These therapeutic groups show increased staining intensity indicating better proteoglycan retention, minimal pannus formation, and reduced inflammatory cell infiltration. Labels 'W' and 'S' indicate the wrist and synovium, respectively. The images provide evidence that ligand-independent TREM-1 inhibition, particularly when delivered via synthetic high-density lipoprotein (sHDL) platforms, protects against the pathological hallmarks of rheumatoid arthritis-like disease.
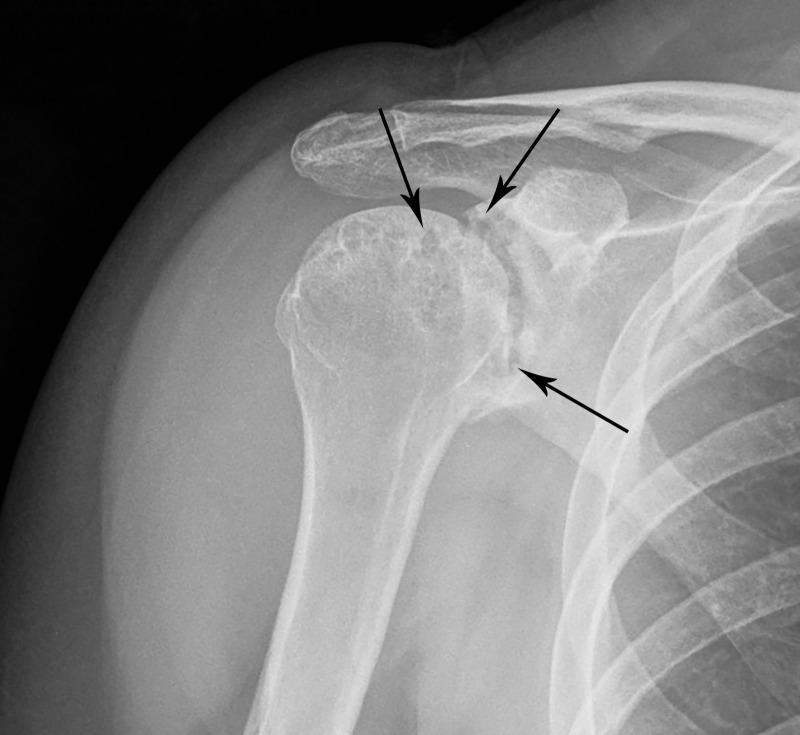
Anteroposterior (AP) conventional radiograph of the right shoulder demonstrating advanced osseous changes associated with rheumatoid arthritis. The imaging reveals marked, symmetric narrowing of the glenohumeral joint space. Significant periarticular pathology is evident, specifically numerous marginal and subchondral bone erosions (indicated by black arrows) involving both the superior and inferior aspects of the humeral head and the adjacent glenoid fossa. These erosions present as radiolucent irregularities and cortical interruptions, leading to an irregular articular contour. Additionally, soft tissue swelling is visible in the deltoid and subdeltoid regions, consistent with chronic inflammatory synovitis or bursitis. Key educational features include the demonstration of classic inflammatory arthropathy hallmarks: joint space loss, periarticular osteopenia, and marginal erosions, which distinguish this condition from degenerative osteoarthritis where subchondral sclerosis and osteophyte formation would be more prominent.
Osteoarthritis vs. Rheumatoid Arthritis: Key Differences
1. Fundamental Nature
| Feature | Osteoarthritis (OA) | Rheumatoid Arthritis (RA) |
|---|---|---|
| Primary abnormality | Mechanical injury to articular cartilage | Autoimmunity |
| Role of inflammation | Secondary - inflammatory mediators exacerbate damage | Primary - cartilage destruction driven by T cells and autoantibodies |
| Serum antibodies | None | ACPA (anticitrullinated peptide antibody), Rheumatoid Factor (IgM/IgA) |
| Systemic involvement | No | Yes (lungs, heart, blood vessels, skin) |
2. Primary Tissue Affected
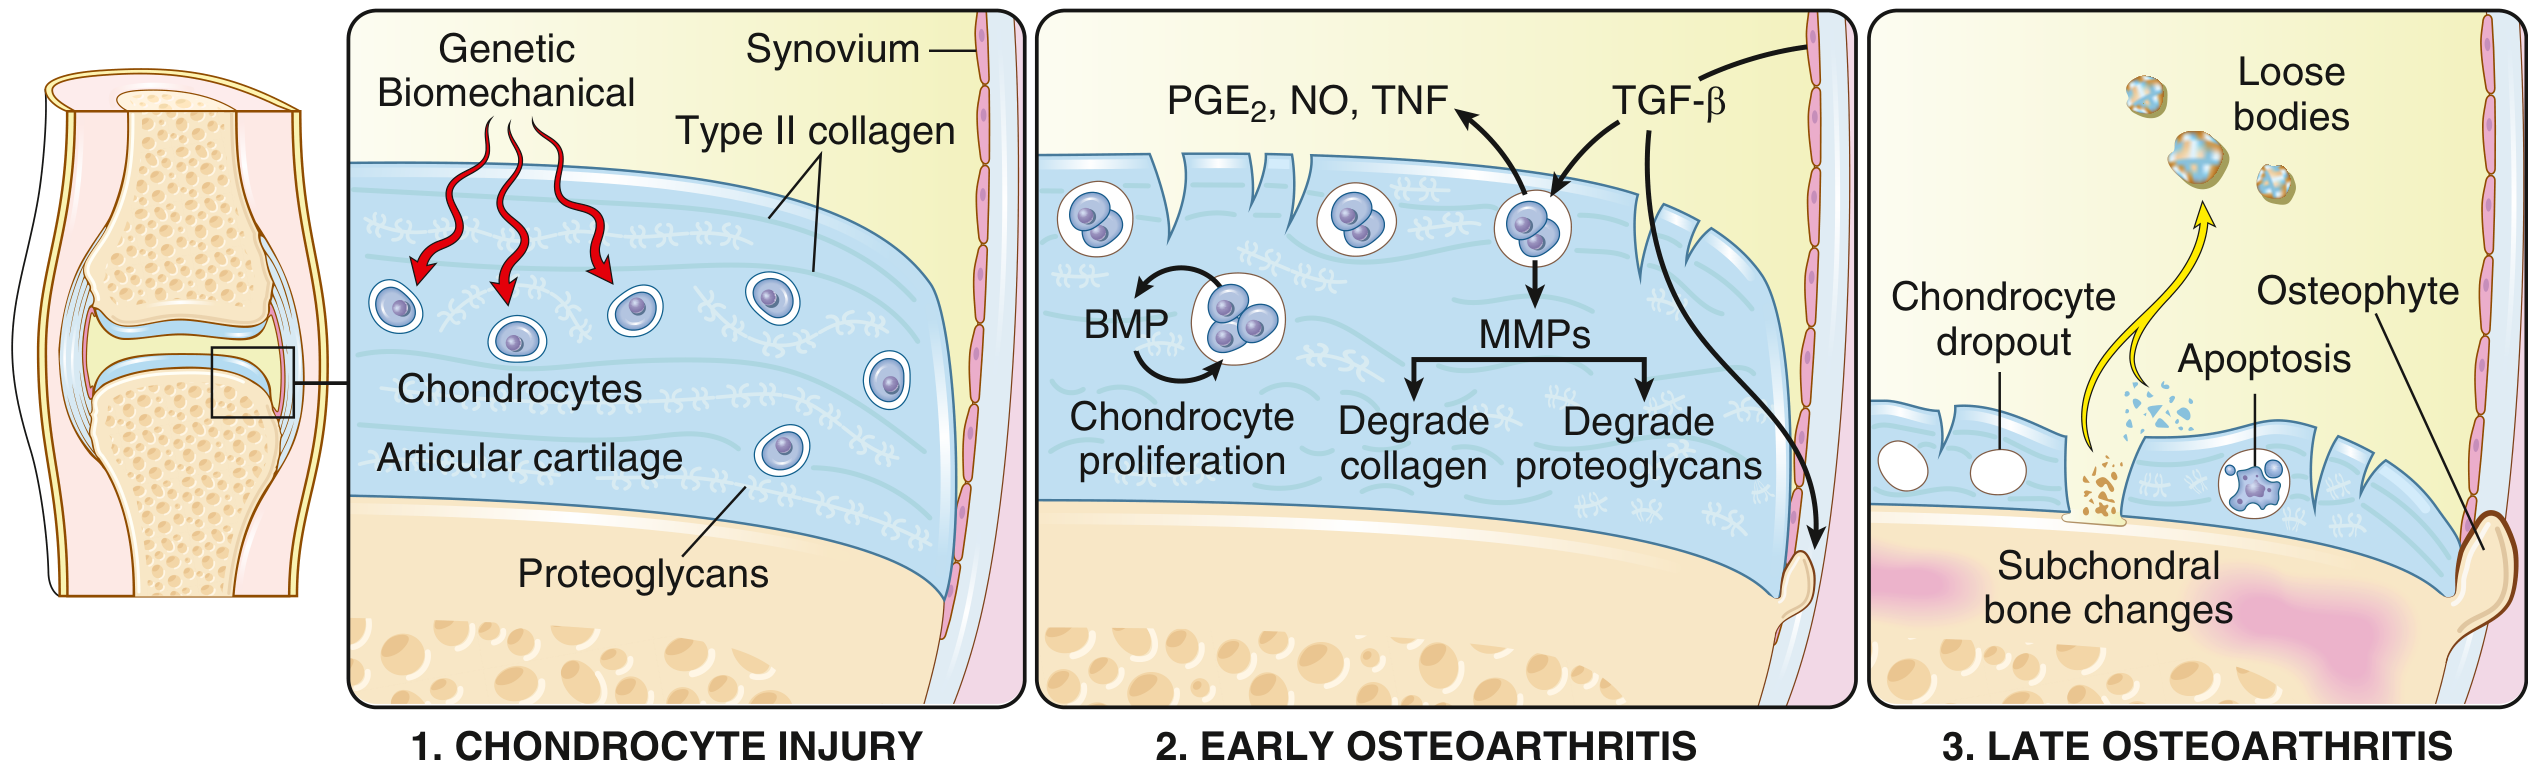
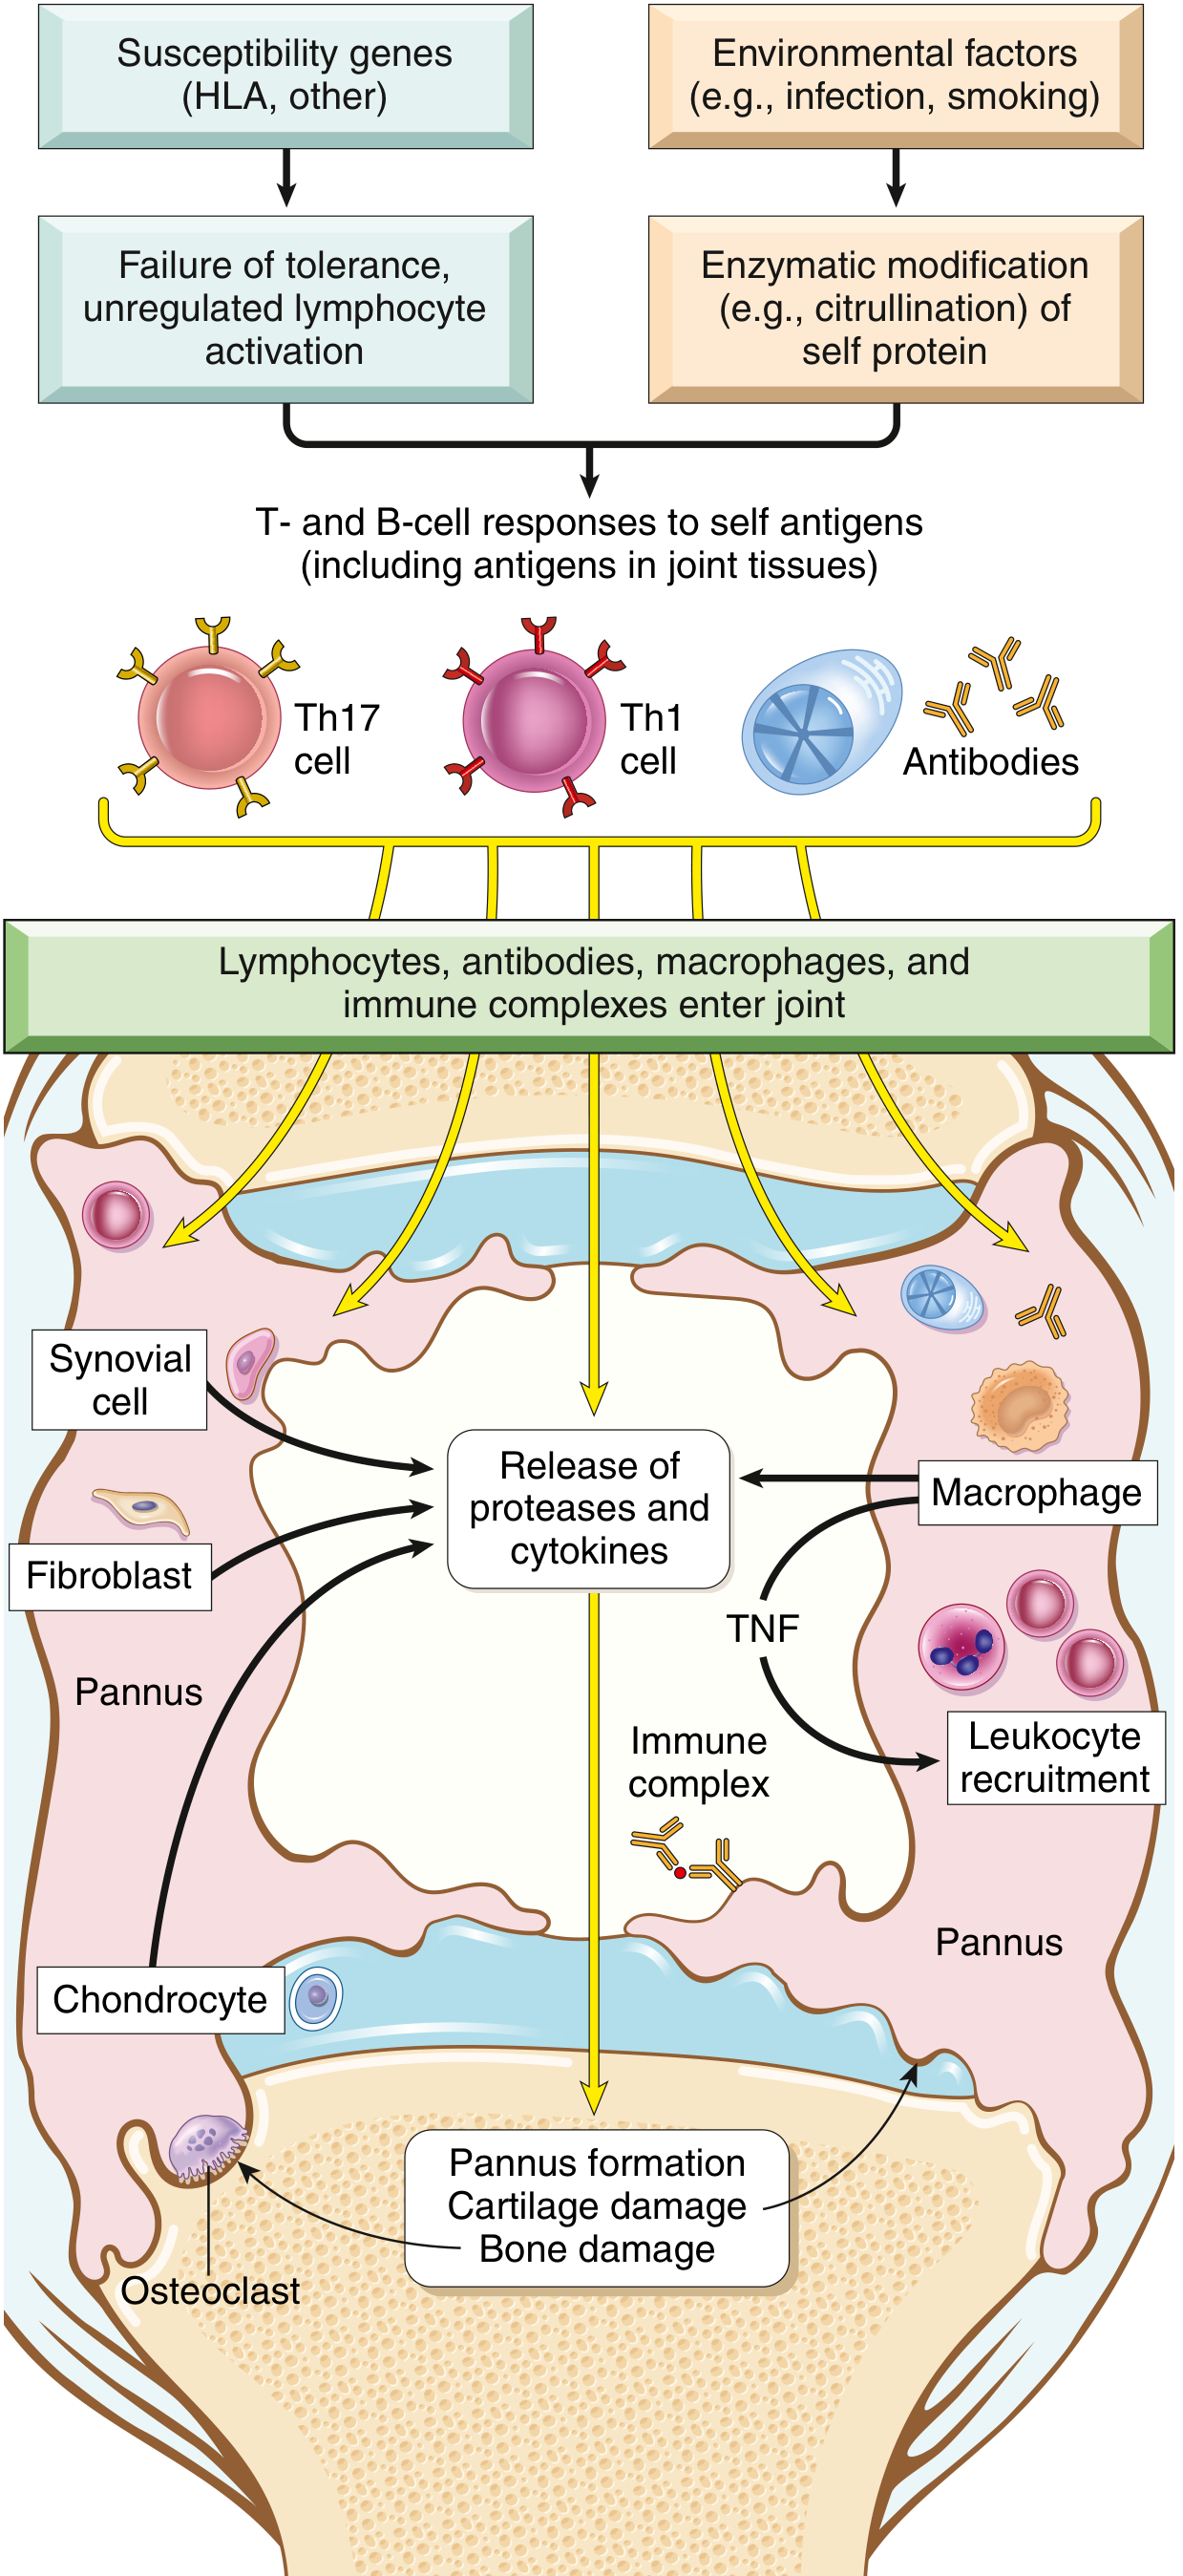
3. Age of Onset
- OA: Prevalence increases exponentially after age 50; roughly 40% of people older than 70 are affected. When it occurs in younger individuals it is classified as "secondary OA," usually due to prior joint trauma, deformity, diabetes, or obesity.
- RA: Peak incidence is in the 3rd to 5th decades of life (ages ~30-50), though it can occur at any age. It is three times more common in women than men.
4. Joint Distribution
- OA: Oligoarticular, preferentially affecting weight-bearing joints - knees, hips, lumbar spine, and the distal/proximal interphalangeal joints of the fingers. Heberden's nodes (DIP) and Bouchard's nodes (PIP) are classic finger findings.
- RA: Often begins with the small joints of the hands and feet - metacarpophalangeal (MCP) and proximal interphalangeal (PIP) joints - then progresses to wrists, ankles, elbows, and knees. Distribution is typically symmetric. The DIP joints are usually spared (key distinguishing feature from OA).
5. Key Clinical Features
| Feature | OA | RA |
|---|---|---|
| Morning stiffness | Brief (<30 min), improves with movement | Prolonged (>1 hour), a hallmark symptom |
| Joint appearance | Hard, bony enlargement; cool | Warm, swollen, tender, boggy |
| Deformities | Heberden's/Bouchard's nodes | Swan-neck deformity, boutonnière deformity, ulnar deviation of fingers |
| X-ray findings | Joint space narrowing, osteophytes, subchondral sclerosis | Joint space narrowing, juxtaarticular osteopenia, marginal bone erosions |
| Systemic symptoms | Absent | Malaise, fatigue, fever, weight loss; rheumatoid nodules (subcutaneous, at elbows/forearm) |
6. Pathology Summary
| OA | RA | |
|---|---|---|
| Pathology | Cartilage degeneration and fragmentation, bone spurs, subchondral cysts; minimal inflammation | Inflammatory pannus invading and destroying cartilage; severe chronic inflammation; joint fusion (ankylosis) |
7. Treatment Approaches
- OA: Primarily symptomatic - NSAIDs, analgesics, physical therapy, weight reduction, and eventually joint replacement.
- RA: Immunosuppression is the cornerstone - methotrexate (first-line DMARD), corticosteroids, and most notably TNF antagonists (e.g., etanercept, adalimumab). Patients typically require long-term TNF blockade; discontinuation leads to disease flares, and long-term use increases risk of opportunistic infections including TB.
Using the VMC, identify and describe the zones of the epiphyseal plate. Why is this structure crucial for a child's growth? At approximately what age does the growth plate disappear? What is left behind once it's completely replaced by bone?
epiphyseal growth plate zones histology diagram
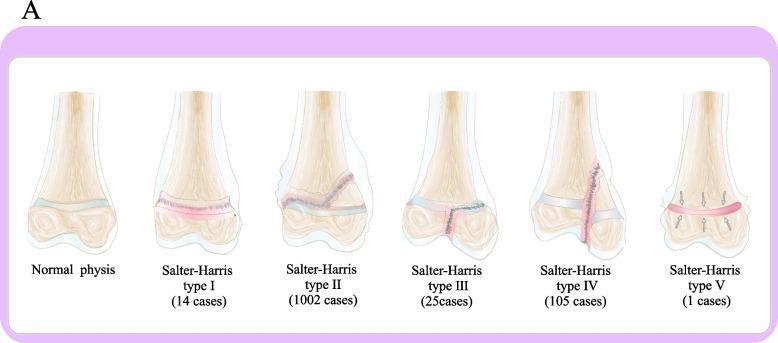
This medical illustration presents the Salter-Harris classification system for pediatric epiphyseal plate fractures, shown on a long bone model. Six diagrams compare the normal anatomy with fracture types I through V. The 'Normal physis' shows an intact growth plate between the metaphysis and epiphysis. Type I is a transverse fracture through the physis. Type II, the most frequent at 1002 cases, travels through the physis and exits through the metaphysis, creating a Thurston-Holland fragment. Type III travels through the physis and exits through the epiphysis into the joint space. Type IV is a vertical fracture crossing the metaphysis, physis, and epiphysis. Type V, the rarest with 1 case, is depicted as a crush or compression injury of the physis indicated by inward-pointing arrows. Each diagram is labeled with the corresponding fracture type and the number of cases from a clinical study, providing a visual guide for orthopedic classification and prevalence in pediatric populations.
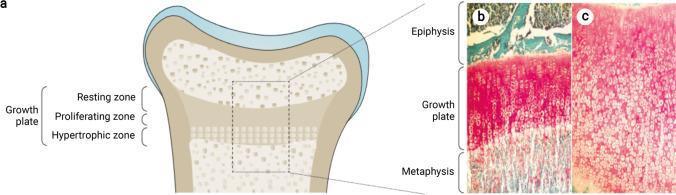
This composite educational resource illustrates the histological and anatomical characteristics of the human growth plate (physis) in healthy and rachitic states. Panel (a) is an anatomical diagram of a long bone end, labeling the growth plate zones: resting, proliferating, and hypertrophic. Panels (b) and (c) present histological comparison images, likely utilizing Goldner's trichrome or similar staining. Panel (b) demonstrates a healthy growth plate with a highly organized transition from the epiphysis to the metaphysis. Key features include organized columns of chondrocytes, a well-defined zone of provisional calcification (red-pink staining), and mineralized bone (turquoise staining) at the metaphyseal border. Panel (c) depicts a rachitic growth plate, showing significant pathological changes characteristic of rickets. There is a marked increase in the longitudinal width of the physis, a loss of the orderly columnar arrangement of chondrocytes, and a persistent, expanded zone of hypertrophic chondrocytes. The dominant red-pink staining indicates an accumulation of unmineralized cartilage matrix, reflecting impaired chondrocyte apoptosis and defective mineralization. This visual comparison highlights the skeletal manifestations of disturbances in calcium and phosphate homeostasis.
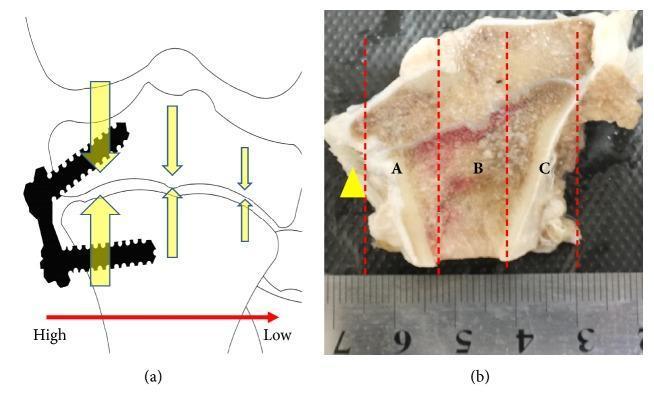
This educational image depicts orthopedic research regarding hemiepiphysiodesis. (a) A conceptual diagram illustrates asymmetric stress distribution across a growth plate following the application of a tension band plate and screws. Vertical arrows represent varying compressive forces, decreasing from the surgical site (high stress) to the opposite side (low stress). (b) A gross clinical photograph displays a coronally sectioned proximal tibia specimen. The specimen is divided into three equidistant regions labeled A (medial/surgical site), B (central), and C (lateral) using vertical dashed red lines. A yellow arrow indicates the surgical site. Visually, regions A and B exhibit increased reddish coloration within the cancellous bone and growth plate area, likely representing vascular response or mechanical irritation, compared to the paler appearance of region C. A metric ruler at the bottom provides a spatial scale for the anatomical divisions. This material is used to demonstrate the morphological changes in the epiphyseal plate in response to localized compressive forces during guided growth procedures.
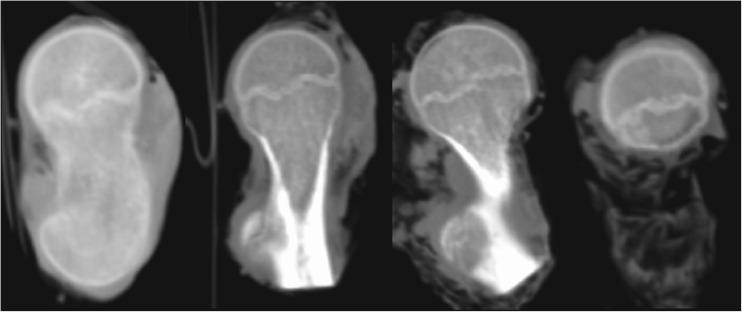
This diagnostic image consists of four CT scan sections of a proximal femoral epiphysis from a 6-year-old child (cadaveric study). The series highlights the morphological and structural characteristics of the growth plate (physis). The epiphysis is visible as a superior region with relatively uniform density, while the metaphysis below exhibits a more trabecular, heterogeneous texture. The growth plate appears as a radiolucent (darker), non-uniform line separating these two regions. In the first image on the left, the physis presents as a thicker, more prominent structure. In the subsequent three sections, it demonstrates a characteristic sinusoidal and irregular form with significant 'ruggedness.' This corrugated interface shows the growth plate interpenetrating both the epiphyseal and metaphyseal bone, which anatomically increases the surface area for stability. The boundary with the metaphysis appears less defined compared to the epiphyseal border, as the physis blends with the underlying trabecular architecture. These images illustrate the complex three-dimensional topology of the pediatric growth plate during mid-childhood development.
Explain what might happen to this child's bone growth if the fracture had severely damaged the epiphyseal plate. Why would this be a concern for their future height?