Write a notes on clinical application of Oxygen dissociation curve
Reading File
Finding Sources
Finding Sources
Reading File
Reading File
Reading File
Reading File
Reading File
Reading File
Reading File
Reading File
Reading File
Finding Sources
Reading File
Reading File
Loading Image
Loading Image
I have all the material needed. Here are comprehensive notes on the clinical applications of the Oxygen Dissociation Curve.
Clinical Applications of the Oxygen Dissociation Curve
1. The Curve — Basic Anatomy
The Oxygen Dissociation Curve (ODC) plots hemoglobin (Hb) oxygen saturation (%) against the partial pressure of oxygen (PO₂, mm Hg). It has a characteristic sigmoid (S-shaped) form resulting from the cooperative binding of O₂ to hemoglobin's four heme subunits — each successive O₂ molecule binds with greater affinity than the last (~300× greater for the 4th vs. the 1st).
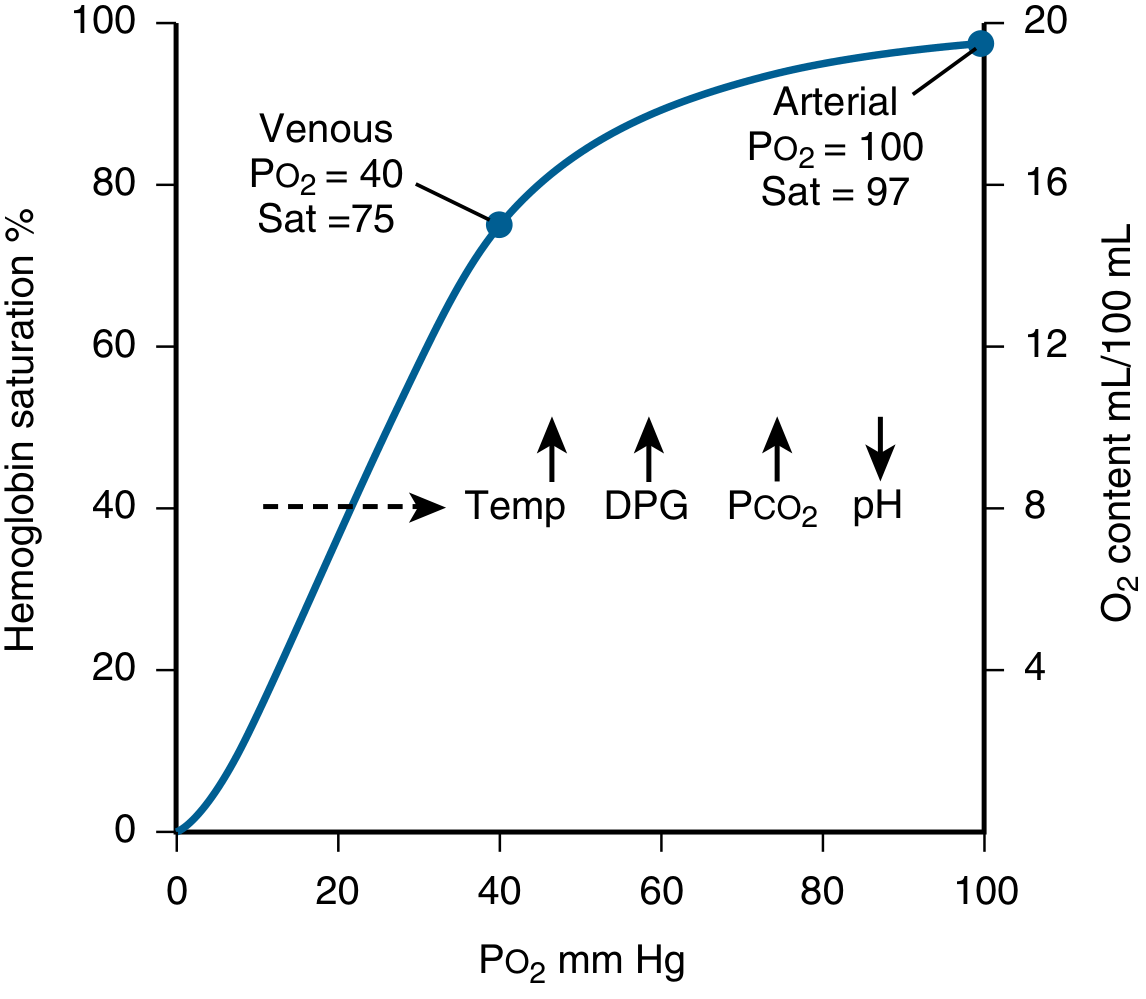
Normal reference points:
| Point | PO₂ (mm Hg) | SaO₂ (%) |
|---|---|---|
| Arterial blood | 100 | 97 |
| Mixed venous blood (rest) | 40 | 75 |
| P50 (50% saturation) | 26.5 | 50 |
The P50 (normally ~26–27 mm Hg) is the standard measure of Hb-O₂ affinity. A higher P50 = right shift (lower affinity); a lower P50 = left shift (higher affinity).
2. Clinical Significance of the Sigmoid Shape
The shape is not incidental — it is physiologically essential and has direct clinical implications:
a) Flat Upper Portion (PO₂ 60–100 mm Hg) — the "Safety Zone"
- Hemoglobin remains >90% saturated even when arterial PO₂ drops from 100 to 60 mm Hg.
- Clinical implication: Patients with mild-to-moderate lung disease (e.g., early pneumonia, mild COPD) may have substantially reduced PO₂ but near-normal SpO₂ and oxygen content. This provides a "safety margin" for gas exchange.
- Caveat for pulse oximetry: SpO₂ monitoring will appear reassuringly normal while PO₂ is silently falling (e.g., from 100 → 70 mm Hg). Clinicians must not rely solely on SpO₂ when evaluating respiratory failure — blood gas analysis is essential.
b) Steep Middle Portion (PO₂ 20–60 mm Hg) — the "Unloading Zone"
- A small drop in capillary PO₂ releases large amounts of O₂ to tissues.
- Clinical implication: During exercise, sepsis, or high metabolic demand, tissues can extract much more O₂ without requiring a large fall in blood oxygen content. This also maintains tissue PO₂ high enough to drive diffusion from capillary to cell.
- Compare this with myoglobin, which has a hyperbolic curve: it would remain near-fully saturated across this range and could not release O₂ to tissues at physiologic PO₂ levels.
3. Factors Shifting the Curve and Their Clinical Relevance
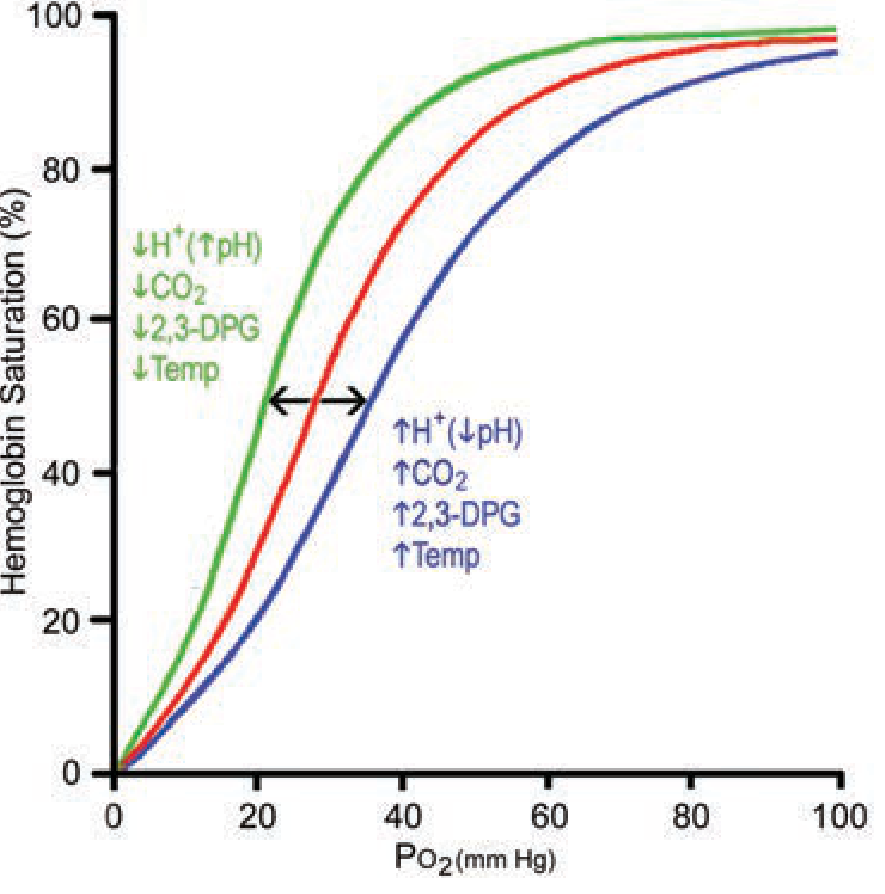
Right Shift (↑ P50 — ↓ O₂ affinity — more O₂ unloaded to tissues)
| Factor | Cause | Clinical Scenario |
|---|---|---|
| ↑ H⁺ (↓ pH) | Acidosis | Sepsis, diabetic ketoacidosis, tissue ischemia, vigorous exercise |
| ↑ PCO₂ | Hypercapnia | Metabolically active tissues, COPD |
| ↑ Temperature | Fever, exercise | Sepsis, strenuous exercise |
| ↑ 2,3-BPG | Chronic hypoxia, anemia | COPD, high altitude, chronic anemia |
Clinical benefit of right shift: O₂ is released more readily to hypoxic/ischemic tissues. During exercise, working muscles produce CO₂, lactic acid, and heat — all shifting the curve right and ensuring maximal O₂ delivery exactly where it is needed.
Left Shift (↓ P50 — ↑ O₂ affinity — O₂ held more tightly, less unloaded)
| Factor | Cause | Clinical Scenario |
|---|---|---|
| ↓ H⁺ (↑ pH) | Alkalosis | Over-ventilation, metabolic alkalosis |
| ↓ PCO₂ | Hypocapnia | Hyperventilation |
| ↓ Temperature | Hypothermia | Cardiac surgery, drowning, therapeutic cooling |
| ↓ 2,3-BPG | Stored blood, hypothyroidism | Massive transfusion with bank blood |
| CO bound to Hb | CO poisoning | House fires, engine exhaust inhalation |
| Fetal Hb (HbF) | Normal neonates | Physiologically beneficial (see below) |
| Methemoglobin | Nitrite/dapsone toxicity | Shifts remaining Hb sites to higher affinity |
Clinical danger of left shift: Hb picks up O₂ normally in the lungs but cannot release it in tissues — "oxygen trap" physiology.
4. The Bohr Effect
When metabolizing tissues produce CO₂ and H⁺, these act as allosteric effectors on hemoglobin:
- Deoxyhemoglobin has greater affinity for H⁺ than oxyhemoglobin — protonation stabilizes the T (deoxy) conformation
- This causes O₂ release in tissues (right shift)
- In the lungs, CO₂ is exhaled and pH rises → curve shifts left → O₂ loading is enhanced
The Bohr effect is the coupling of CO₂/pH metabolism to O₂ delivery. It accounts for a 2–3% augmentation of O₂ release at rest but becomes clinically significant during strenuous exercise with anaerobic lactic acid production.
Schematically: HbO₂ + H⁺ ⇌ HbH + O₂
5. Role of 2,3-Bisphosphoglycerate (2,3-BPG / 2,3-DPG)
2,3-BPG is the most abundant organic phosphate in RBCs. It binds the β-chain pocket of deoxyhemoglobin, stabilizing the T conformation and shifting the ODC rightward.
Key clinical situations:
a) Chronic hypoxia and high altitude
- Low PO₂ increases 2,3-BPG synthesis in RBCs
- Rightward shift allows greater O₂ offloading at tissue level — an adaptive response
- A person acclimatized to altitude (8 mmol/L 2,3-BPG) can deliver the same % O₂ to tissues as a sea-level person despite lower Hb saturation in the lungs
b) Chronic anemia
- Fewer RBCs → compensatory rise in 2,3-BPG per cell
- ODC shifts right → each remaining RBC unloads more O₂
- This partly compensates for reduced Hb mass
c) COPD/Emphysema
- Chronically low PO₂ → elevated 2,3-BPG → rightward shift → better O₂ delivery to tissues
d) Banked blood transfusion
- Stored blood becomes progressively depleted of 2,3-BPG over days
- Transfused RBCs have a left-shifted curve and act as an "oxygen trap" for 6–24 hours until 2,3-BPG is restored
- Clinical implication: Massive transfusion with old bank blood may paradoxically worsen tissue O₂ delivery in critically ill patients
6. Fetal Hemoglobin (HbF) and the ODC
- HbF (α₂γ₂) binds 2,3-BPG less avidly than adult HbA (α₂β₂) because the γ-chains have lower affinity for BPG
- Result: HbF has a left-shifted ODC (higher O₂ affinity, P50 ≈ 19–20 mm Hg vs. 26.5 in adults)
- Clinical benefit: At the placenta, fetal blood with its high-affinity HbF extracts O₂ from maternal blood (which has normal HbA) efficiently, despite relatively low PO₂ at the placental interface
- After birth, HbF is progressively replaced by HbA, allowing more effective O₂ release to growing tissues
7. Carbon Monoxide (CO) Poisoning
CO binds hemoglobin with 220× greater affinity than O₂, producing carboxyhemoglobin (COHb). The ODC is distorted in two ways:
- Functional anemia — CO occupies heme sites, reducing O₂-carrying capacity
- Left shift — CO binding shifts the remaining heme sites to a high-affinity R conformation, so what O₂ is carried cannot be released to tissues
Clinical danger: Arterial chemoreceptors respond to PO₂, not O₂ content. Because PO₂ (dissolved O₂) may be normal while total O₂ content is severely reduced (due to COHb), the normal hypoxic drive to breathe is absent. Standard pulse oximetry (SpO₂) cannot distinguish COHb from OxyHb and gives falsely normal readings — co-oximetry is required for diagnosis.
Treatment: High-flow 100% O₂ (or hyperbaric O₂) competitively displaces CO from heme sites.
8. Abnormal Hemoglobins and the ODC
| Variant Type | ODC Shift | Clinical Features |
|---|---|---|
| High-affinity Hb (e.g., Hb Chesapeake, Yakima, Rainier) | Left | Erythrocytosis — bone marrow compensates for poor tissue O₂ delivery by making more RBCs |
| Low-affinity Hb (e.g., Hb Kansas, Beth Israel) | Right | Anemia + cyanosis — Hb releases O₂ too easily; less is carried in arterial blood; cyanosis visible but patient often asymptomatic |
| HbS (sickle cell) | Slight right | Variable; sickling occurs at low PO₂, worsened by fever/acidosis (rightward factors) |
High-affinity variants are identified by measuring the P50 and confirming with molecular analysis. Unexplained erythrocytosis without hypoxia should prompt P50 measurement.
9. Clinical Application in Pulse Oximetry
Pulse oximeters measure SpO₂, which sits on the flat upper portion of the ODC. Key limitations:
- SpO₂ 95% corresponds to PO₂ ≈ 75 mm Hg (acceptable)
- SpO₂ 90% corresponds to PO₂ ≈ 60 mm Hg (already significantly hypoxic — the "critical" threshold)
- SpO₂ does not detect CO poisoning or methemoglobinemia accurately
- In alkalosis or hypothermia (left shift), the same SpO₂ reflects lower tissue O₂ delivery than expected
10. ODC in Clinical Practice — Summary Table
| Clinical Setting | Shift | P50 | Physiologic Effect | Clinical Relevance |
|---|---|---|---|---|
| Metabolic acidosis / sepsis | Right | ↑ | More O₂ released to tissues | Adaptive; treat underlying cause |
| Strenuous exercise | Right | ↑ | Maximises O₂ delivery to working muscle | Normal physiology |
| Chronic anemia / COPD / high altitude | Right | ↑ | Compensatory O₂ unloading | 2,3-BPG mediated |
| Hypothermia / alkalosis | Left | ↓ | O₂ held tightly, tissue hypoxia possible | Caution in bypass surgery, drowning resuscitation |
| Massive transfusion (stored blood) | Left | ↓ | Poor O₂ release for 6–24 h | Use fresher blood where possible; monitor tissue perfusion |
| Carbon monoxide poisoning | Left | ↓ | O₂ content ↓ + affinity ↑ = tissue hypoxia | Give 100% O₂ or HBO₂ |
| Fetal hemoglobin | Left | ↓ | Extracts O₂ from maternal blood efficiently | Normal; transitions to HbA after birth |
| High-affinity Hb variants | Left | ↓ | Erythrocytosis | Check P50 in unexplained polycythaemia |
Sources:
- Fishman's Pulmonary Diseases and Disorders (§ Oxygen Transport / Oxygen Dissociation Curve)
- Biochemistry, 8th ed — Lippincott Illustrated Reviews (Chapter 3: Hemoglobin)
- Guyton and Hall Textbook of Medical Physiology (Chapter 41)
- Murray & Nadel's Textbook of Respiratory Medicine (Chapter 10)
- Mulholland and Greenfield's Surgery (Table 10.6)
This is a shared conversation. Sign in to Orris to start your own chat.