
Uses and side effects of adrenergic drugs
adrenergic receptor agonist antagonist pharmacology diagram
![This physiological diagram displays nine time-series graphs (A–I) illustrating intracellular calcium ([Ca2+]i) dynamics in adipocytes, measured via Fura-2 fluorescence ratios. The graphs demonstrate the synergistic and potentiation effects of various agonists on calcium signaling. Panels A and B show periodic, high-amplitude [Ca2+]i oscillations induced by the combination of Acetylcholine (ACh) and Norepinephrine (NE). Panel C depicts the inhibition of these oscillations using the M3-cholinergic receptor antagonist p-F-HHSID, resulting in only a single transient spike. Panels D–H illustrate diverse dynamic regimes triggered by ACh and the α1-adrenergic agonist Phenylephrine, including fast oscillations (D), impulse-shaped oscillations (E), relaxation-type oscillations (F), and transitions to new steady states (G, H). Panel I shows impulse-shaped oscillations elicited by the α2-adrenergic agonist UK-14,304 in the presence of ACh. The data illustrate complex nonlinear signaling pathways and the convergence of M3-cholinergic and α-adrenergic receptor activation in adipocyte calcium homeostasis.](https://cdn.orris.care/cdss_images/pmc_clinical_VQA_89f4396e44260123ca58985d1422823adf03181a9bbd5bbbe3f5c85a21f8880e.jpg)
This physiological diagram displays nine time-series graphs (A–I) illustrating intracellular calcium ([Ca2+]i) dynamics in adipocytes, measured via Fura-2 fluorescence ratios. The graphs demonstrate the synergistic and potentiation effects of various agonists on calcium signaling. Panels A and B show periodic, high-amplitude [Ca2+]i oscillations induced by the combination of Acetylcholine (ACh) and Norepinephrine (NE). Panel C depicts the inhibition of these oscillations using the M3-cholinergic receptor antagonist p-F-HHSID, resulting in only a single transient spike. Panels D–H illustrate diverse dynamic regimes triggered by ACh and the α1-adrenergic agonist Phenylephrine, including fast oscillations (D), impulse-shaped oscillations (E), relaxation-type oscillations (F), and transitions to new steady states (G, H). Panel I shows impulse-shaped oscillations elicited by the α2-adrenergic agonist UK-14,304 in the presence of ACh. The data illustrate complex nonlinear signaling pathways and the convergence of M3-cholinergic and α-adrenergic receptor activation in adipocyte calcium homeostasis.
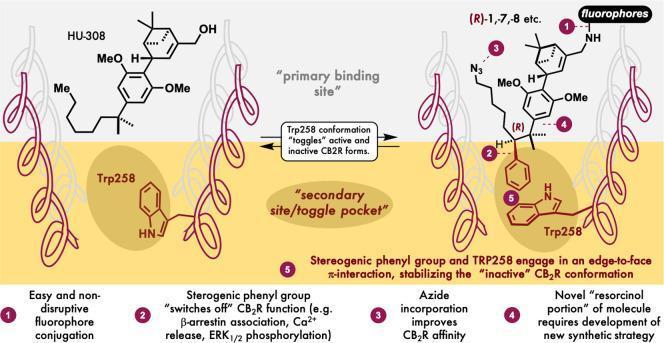
A molecular pharmacology diagram illustrating the conformational switch of the Cannabinoid Receptor 2 (CB2R) between active (left) and inactive (right) states. The visual depicts a G protein-coupled receptor (GPCR) model featuring alpha-helical transmembrane domains. The central mechanism shown is the 'toggle switch' involving the Trp258 residue within a 'secondary site/toggle pocket'. On the left, the agonist HU-308 binds to the primary site, leaving Trp258 in an upright active conformation. On the right, a modified ligand stabilizes the inactive state through a stereogenic phenyl group that engages in an edge-to-face pi-interaction with Trp258, effectively 'switching off' receptor signaling. Key molecular modifications to the ligand for therapeutic development are highlighted: 1) fluorophore conjugation for imaging, 2) stereogenic phenyl group for functional inactivation (e.g., inhibiting beta-arrestin association and ERK1/2 phosphorylation), 3) azide incorporation for improved affinity, and 4) a novel resorcinol moiety. The diagram highlights structural biology concepts in drug design, specifically targeting the active/inactive equilibrium of GPCRs for pain modulation research.
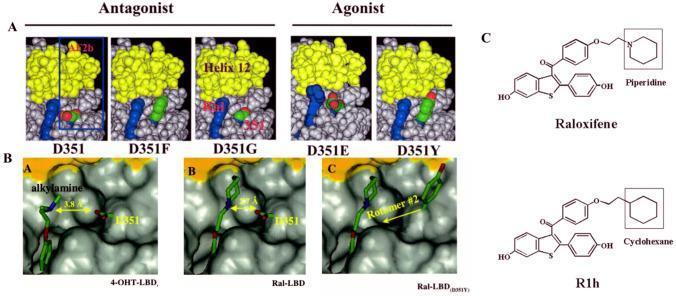
This composite educational graphic illustrates the molecular pharmacology and structural biology of the Estrogen Receptor alpha (ERα) ligand-binding domain (LBD). Panel A presents surface-filling structural models of ERα bound to raloxifene, categorized by functional outcome. Antagonist configurations (D351, D351F, D351G) show the yellow-colored Helix 12 positioned to block coactivator binding. Agonist configurations (D351E, D351Y) demonstrate a conformational shift in Helix 12 and its proximity to the blue-colored protein surface, following mutations at the Asp351 residue (the anti-estrogenic region). Panel B provides detailed molecular modeling of the surface interaction between specific ligands and the D351/Y351 residue. It compares 4-hydroxytamoxifen (4-OHT) and raloxifene (Ral), highlighting the distance (3.8 Å) between the ligand alkylamine chain and the protein surface. Subpanel C shows how the Asp351Tyr mutation introduces steric considerations (Rotamer #2). Panel C displays the chemical structures of Raloxifene (featuring a piperidine ring) and its derivative R1h (featuring a cyclohexane ring), illustrating the importance of the nitrogen-containing side chain for anti-estrogenic activity.
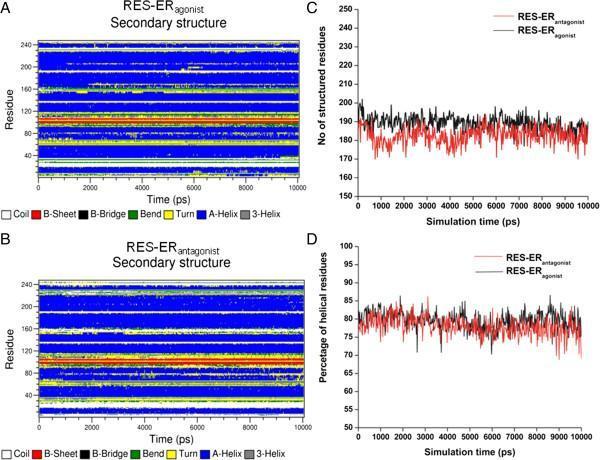
This educational graphic presents Molecular Dynamics (MD) simulation data for Estrogen Receptor alpha (ERα) complexes bound with Resveratrol (RES) in both agonist and antagonist conformations. The image consists of four panels (A-D). Panels A and B are secondary structure profiles over a 10,000 ps simulation time for the agonist and antagonist complexes, respectively. The y-axis identifies residue numbers (0–240), with color-coding indicating structural elements: A-Helix (blue), Turn (yellow), B-Sheet (red), Coil (white), and Bend (green). Both profiles demonstrate high alpha-helical stability, particularly in the regions corresponding to the receptor's 12 helices. Panel C provides a line graph comparing the total number of structured residues for the agonist (black) and antagonist (red) complexes, fluctuating between approximately 170 and 200 residues. Panel D tracks the percentage of helical residues, showing both complexes maintain a high helical content between 70% and 85% throughout the simulation. This visual demonstrates the structural stability of ERα-LBD when bound to different ligand subtypes, relevant for pharmacology and structural biology studies on Selective Estrogen Receptor Modulators (SERMs).
adrenergic sympathomimetic drugs epinephrine norepinephrine receptor effects
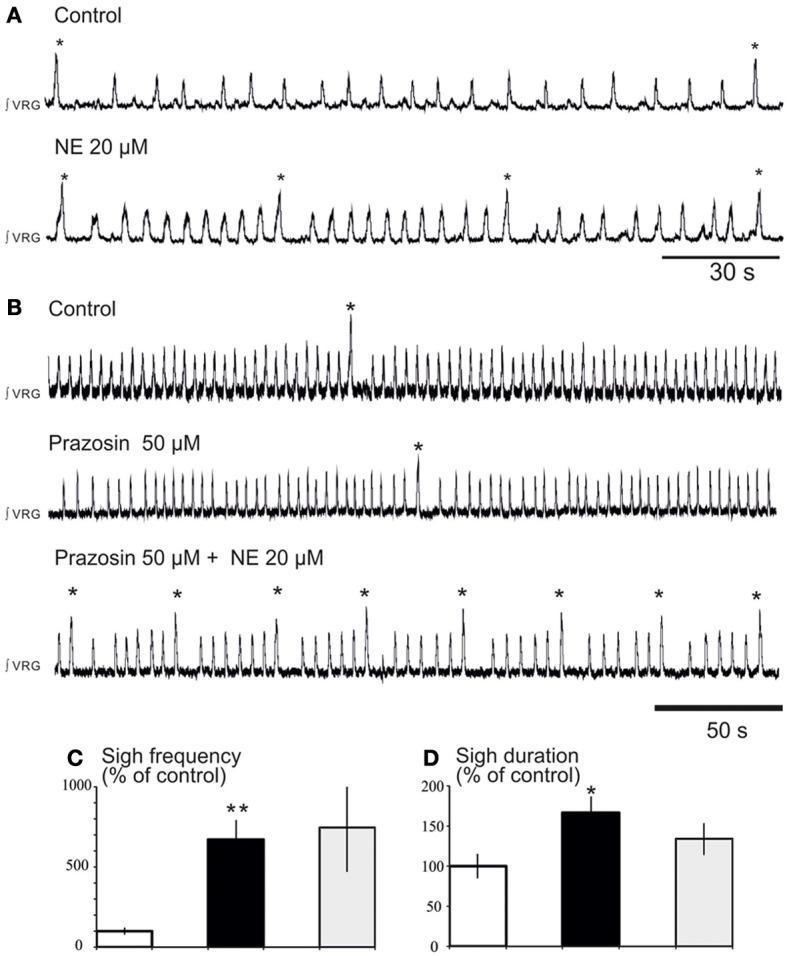
This physiological data panel illustrates the noradrenergic modulation of respiratory rhythm in mouse brainstem slices, focusing on the pre-Bötzinger Complex (preBötC). Panels A and B display integrated population activity recordings (∫VRG) showing two distinct patterns: low-amplitude 'fictive eupneic' bursts and high-amplitude 'fictive sighs' (marked by asterisks). In Panel A, norepinephrine (NE, 20 μM) increases the frequency of both eupneic and sigh-like activity. Panel B demonstrates that the α1-adrenergic receptor antagonist prazosin (50 μM) selectively abolishes the NE-induced increase in eupneic frequency but fails to block the increase in sigh frequency, which remains elevated upon NE application. Panels C and D provide statistical histograms quantifying these effects, showing significant increases in sigh frequency and duration (expressed as percentage of control) following pharmacological intervention. The visual data supports the concept that sigh-like activity is modulated by noradrenergic pathways independent of α1-receptors, likely involving β-adrenergic mechanisms. This content is relevant for neurobiology and respiratory physiology, specifically studying central rhythmogenesis and autonomic control.
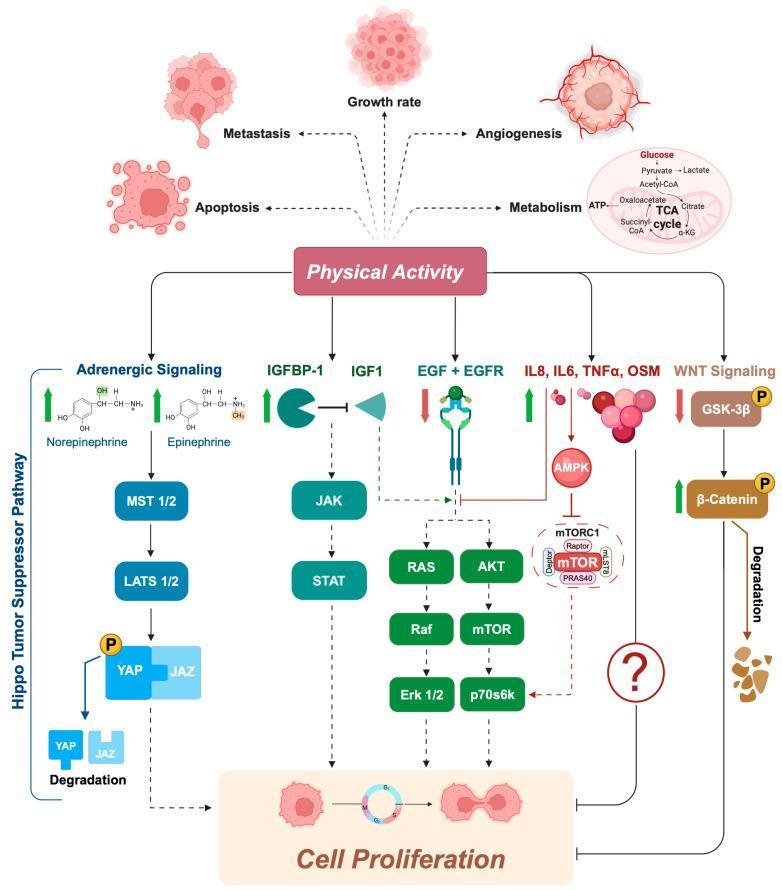
This pathophysiology diagram illustrates the multi-pathway signaling mechanisms by which physical activity inhibits cancer cell proliferation and influences tumor hallmarks. The central 'Physical Activity' node links to five distinct regulatory axes. 1) Adrenergic Signaling: Increased norepinephrine and epinephrine activate the Hippo Tumor Suppressor Pathway (MST 1/2 and LATS 1/2), leading to YAP/TAZ phosphorylation and degradation. 2) IGF-1 Axis: Increased IGFBP-1 levels inhibit IGF1, thereby suppressing JAK/STAT signaling. 3) EGF Axis: Decreased EGF/EGFR activity downregulates the RAS/Raf/Erk and AKT/mTOR pathways. 4) Myokine/Cytokine Axis: Elevated IL-8, IL-6, TNF̡, and OSM trigger AMPK, which inhibits the mTORC1 complex. 5) WNT Signaling: Physical activity decreases GSK-3̢ phosphorylation, promoting ̢-catenin degradation. These combined molecular shifts collectively lead to decreased cell proliferation and also influence apoptosis, metastasis, growth rate, angiogenesis, and metabolic processes such as the TCA cycle. The diagram uses standard flow logic (arrows for activation, T-bars for inhibition) to explain the anti-tumorigenic systemic effects of exercise.
This physiological diagram displays nine time-series graphs (A–I) illustrating intracellular calcium ([Ca2+]i) dynamics in adipocytes, measured via Fura-2 fluorescence ratios. The graphs demonstrate the synergistic and potentiation effects of various agonists on calcium signaling. Panels A and B show periodic, high-amplitude [Ca2+]i oscillations induced by the combination of Acetylcholine (ACh) and Norepinephrine (NE). Panel C depicts the inhibition of these oscillations using the M3-cholinergic receptor antagonist p-F-HHSID, resulting in only a single transient spike. Panels D–H illustrate diverse dynamic regimes triggered by ACh and the α1-adrenergic agonist Phenylephrine, including fast oscillations (D), impulse-shaped oscillations (E), relaxation-type oscillations (F), and transitions to new steady states (G, H). Panel I shows impulse-shaped oscillations elicited by the α2-adrenergic agonist UK-14,304 in the presence of ACh. The data illustrate complex nonlinear signaling pathways and the convergence of M3-cholinergic and α-adrenergic receptor activation in adipocyte calcium homeostasis.
Adrenergic Drugs: Uses and Side Effects
Part I: Adrenergic AGONISTS (Sympathomimetics)
Classification by Mechanism
| Type | Mechanism | Examples |
|---|---|---|
| Direct-acting | Bind receptors directly | Epinephrine, NE, dopamine, phenylephrine, albuterol, clonidine |
| Indirect-acting | Release stored catecholamines from nerve endings | Amphetamine, tyramine, ephedrine |
| Mixed-acting | Both direct and indirect | Pseudoephedrine |
1. Epinephrine (Adrenaline)
- Anaphylaxis - first-line treatment (reverses bronchospasm, hypotension, angioedema)
- Cardiac arrest - restores cardiac rhythm via β1 stimulation
- Bronchospasm (acute severe asthma - now largely replaced by selective β2 agonists)
- Local vasoconstrictor - added to local anesthetics to prolong their effect and reduce bleeding
- Glaucoma (topical)
- Hypertension (from α1-mediated vasoconstriction)
- Tachycardia, palpitations, arrhythmias (from β1 effects)
- Anxiety, tremor, headache
- Tissue necrosis if extravasation occurs (powerful vasoconstriction)
- Pulmonary edema at high doses
2. Norepinephrine (Levaterenol)
- Vasopressor in septic shock and other distributive shock states (raises both systolic and diastolic BP by increasing peripheral resistance)
- Second-line agent in shock when dopamine fails
- Severe hypertension
- Reflex bradycardia (baroreceptor-mediated, overcoming the direct β1 chronotropic effect)
- Peripheral ischemia / tissue necrosis on extravasation
- Renal/mesenteric vasoconstriction with prolonged use
3. Dopamine
- Cardiogenic and septic shock - increases cardiac output (β1) and maintains renal perfusion at low doses (DA1 receptors increase renal blood flow and sodium excretion)
- Oliguric renal failure (adjunct)
- Tachycardia, arrhythmias
- Nausea, vomiting
- At high doses: vasoconstriction, tissue ischemia
4. Selective α1 Agonists (e.g., Phenylephrine, Midodrine)
- Nasal decongestant (topical - relieves congestion by vasoconstriction of nasal mucosa)
- Mydriatic (topical ocular use for eye examination)
- Orthostatic hypotension (midodrine - oral prodrug)
- Raising blood pressure intraoperatively
- Rebound nasal congestion (rhinitis medicamentosa) with prolonged use of topical decongestants
- Hypertension
- Reflex bradycardia
- Urinary retention (α1 contraction of bladder neck)
5. Selective α2 Agonists (e.g., Clonidine, Methyldopa, Brimonidine)
- Clonidine: Hypertension (especially when other drugs have failed); opioid/alcohol withdrawal; ADHD (extended-release); pain management
- Methyldopa: Hypertension in pregnancy (considered safe in obstetrics)
- Brimonidine/Apraclonidine: Topical treatment of glaucoma
- Dexmedetomidine: ICU sedation in mechanically ventilated patients; procedural sedation
- Sedation / drowsiness
- Dry mouth (xerostomia)
- Constipation
- Hypotension
- Confusion
- Rebound hypertension on abrupt withdrawal - must taper slowly
- Sedation, depression
- Positive Coombs test (hemolytic anemia - rare but serious)
- Hepatotoxicity (rare)
- Gynecomastia, galactorrhea
6. Selective β2 Agonists (e.g., Albuterol/Salbutamol, Salmeterol, Terbutaline, Formoterol)
- Asthma and COPD - mainstay bronchodilators
- Short-acting (albuterol): acute bronchospasm relief ("rescue inhaler")
- Long-acting (salmeterol, formoterol): maintenance/prevention
- Premature labor (terbutaline - tocolytic, though meta-analysis shows no significant benefit on perinatal mortality)
- Hyperkalemia (albuterol promotes K⁺ shift into cells via β2)
- Tachycardia (especially with non-selective agents or high doses)
- Skeletal muscle tremor (most common complaint)
- Hypokalemia (potassium shift into cells - clinically significant at high doses)
- Palpitations
- Tolerance/tachyphylaxis with prolonged use
- Paradoxical bronchospasm (rare)
Note: Inhalation is the preferred delivery route for respiratory indications - this maximizes local airway effect and minimizes systemic toxicity.
7. Indirect-Acting Sympathomimetics
- ADHD - methylphenidate and amphetamine salts
- Narcolepsy
- Obesity (short-term, limited benefit)
- Insomnia, anxiety, agitation
- Tachycardia, hypertension
- Growth suppression in children
- High abuse potential / addiction
- Psychosis at high doses
Part II: Adrenergic ANTAGONISTS (Sympatholytics)
1. Alpha-Receptor Antagonists
Non-selective α-blockers (e.g., Phenoxybenzamine - irreversible; Phentolamine - reversible)
- Pheochromocytoma - preoperative preparation to prevent hypertensive crises from catecholamine release
- Phentolamine: reversal of local anesthetic-induced soft tissue anesthesia
- Orthostatic hypotension
- Reflex tachycardia (from blocked α1 → vasodilation → baroreceptor-mediated tachycardia)
- Nasal stuffiness
- Inhibition of ejaculation
Selective α1-blockers (Prazosin, Doxazosin, Terazosin, Tamsulosin)
- Hypertension (prazosin, doxazosin)
- Benign prostatic hyperplasia (BPH) - relax smooth muscle of bladder neck and prostate (tamsulosin is particularly uroselective)
- Raynaud phenomenon
- First-dose syncope - marked orthostatic hypotension with the first dose (counsel patients to take at bedtime)
- Dizziness, lightheadedness
- Headache, palpitations
2. Beta-Receptor Antagonists (Beta-Blockers)
Non-selective β-blockers (Propranolol, Nadolol, Timolol)
Cardioselective β1-blockers (Metoprolol, Atenolol, Bisoprolol, Esmolol)
Mixed α/β-blockers (Labetalol, Carvedilol)
- Hypertension - reduce cardiac output and renin release
- Ischemic heart disease (angina, post-MI) - reduce myocardial oxygen demand
- Heart failure (carvedilol, metoprolol succinate, bisoprolol) - reduce morbidity and mortality
- Arrhythmias - atrial fibrillation rate control, SVT
- Glaucoma (timolol - topical; reduces aqueous humor production)
- Hyperthyroidism - control sympathetic symptoms
- Pheochromocytoma - only after alpha blockade is established
- Migraine prophylaxis (propranolol)
- Essential tremor (propranolol)
- Performance anxiety (propranolol)
- Hypertensive emergencies in pregnancy (labetalol)
- Portal hypertension / variceal bleeding prophylaxis (propranolol, nadolol)
- Bronchospasm - from β2 blockade; dangerous in asthma/COPD (use cardioselective agents cautiously if unavoidable)
- Bradycardia and heart block
- Hypotension
- Fatigue, exercise intolerance
- Cold extremities (peripheral vasoconstriction)
- Masking of hypoglycemia - block the tachycardic warning sign in diabetics (sweating is still present)
- Impotence / sexual dysfunction
- CNS effects (propranolol - lipophilic, crosses BBB): depression, vivid dreams, nightmares, insomnia
- Rebound angina/hypertension on abrupt withdrawal - must taper slowly
- Metabolic effects: dyslipidemia (increased triglycerides, decreased HDL), impaired glucose tolerance
Quick Summary Table
| Drug Class | Key Receptors | Primary Uses | Key Side Effects |
|---|---|---|---|
| Epinephrine | α1, α2, β1, β2 | Anaphylaxis, cardiac arrest | Hypertension, arrhythmias |
| Norepinephrine | α1, α2, β1 | Septic shock | Peripheral ischemia, rebound bradycardia |
| Dopamine | DA, β1, α1 (dose-dependent) | Shock, oliguria | Arrhythmias, tachycardia |
| Phenylephrine | α1 | Nasal decongestant, mydriasis | Rebound congestion, HTN |
| Clonidine | α2 (central) | Hypertension, ADHD withdrawal | Sedation, dry mouth, rebound HTN |
| Methyldopa | α2 (via false transmitter) | Hypertension in pregnancy | Sedation, Coombs-positive hemolysis |
| Albuterol | β2 | Asthma, COPD | Tremor, tachycardia, hypokalemia |
| Salmeterol | β2 | COPD/asthma maintenance | Tremor, must not be used as monotherapy |
| Amphetamine/methylphenidate | Indirect (NE/DA release) | ADHD, narcolepsy | Insomnia, HTN, abuse potential |
| Phentolamine | α (non-selective) | Pheochromocytoma | Orthostatic hypotension, reflex tachycardia |
| Prazosin/tamsulosin | α1 | Hypertension, BPH | First-dose syncope |
| Propranolol | β1, β2 | Hypertension, arrhythmias, angina | Bronchospasm, masking hypoglycemia |
| Metoprolol/bisoprolol | β1 (selective) | Heart failure, HTN, post-MI | Bradycardia, fatigue, cold extremities |
| Carvedilol/labetalol | α1, β1, β2 | Heart failure, hypertensive emergencies | Orthostatic hypotension, fatigue |
- Katzung's Basic and Clinical Pharmacology, 16th ed. - Chapters 9 & 10 (Adrenoceptor Agonists and Antagonists)
- Lippincott Illustrated Reviews: Pharmacology - Chapter 8 (Antihypertensive drugs, centrally acting adrenergic drugs)
- Goodman & Gilman's The Pharmacological Basis of Therapeutics - Adrenergic transmission section